Popular Tags

Smashing Magazine - we smash you with the information that will make your life easier. really.

Data Visualization and Infographics

Advertisement

The main goal of data visualization is its ability to visualize data, communicating information clearly and effectivelty. It doesn’t mean that data visualization needs to look boring to be functional or extremely sophisticated to look beautiful. To convey ideas effectively, both aesthetic form and functionality need to go hand in hand, providing insights into a rather sparse and complex data set by communicating its key-aspects in a more intuitive way. Yet designers often tend to discard the balance between design and function, creating gorgeous data visualizations which fail to serve its main purpose — communicate information.

In both print and web design infographics — visual representations of information, data or knowledge — are often used to support information, strengthen it and present it within a provoking and sensitive context, depending on designer’s creativity.

This article presents some spectacular data visualizations and infographics which manage to combine a strong visual appeal with the effective presentation of information.

Data Visualization and Infographics

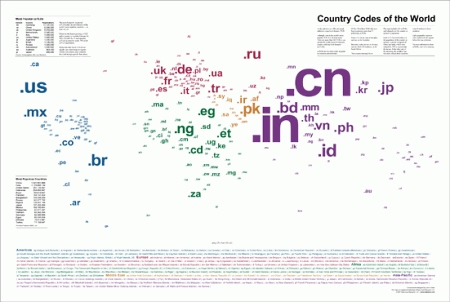
Country Codes of the World
Country Codes of the World maps 245 top-level domain country codes encompassing all United Nations countries as well as numerous islands and territories. Each two-digit code is aligned over the country it represents and is color coded with the legend below for quick and easy reference.

Countries in Data Visualization and Infographics

Flags as Infographics
These posters have been designed for the political magazine Grande “Reportagem”. The main idea behind visualization is to turn flags of various countries into infographics by adding a legend to them. For instance: United States. Red: In favor of the war in Iraq. White: Against the war in Iraq. Blue: Don’t know where Iraq is.

Usa in Data Visualization and Infographics

Brazil in Data Visualization and Infographics

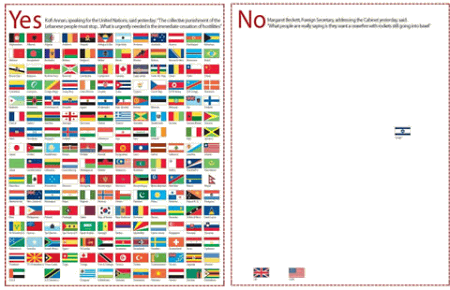
Independent: Infographic
Middle-East: who backs immediate cease-fire? The infographic below was published on the front page of the “Independent” magazine during the Middle-East crisis in July 2007.

Middle-east-cease-fire-country-vote in Data Visualization and Infographics

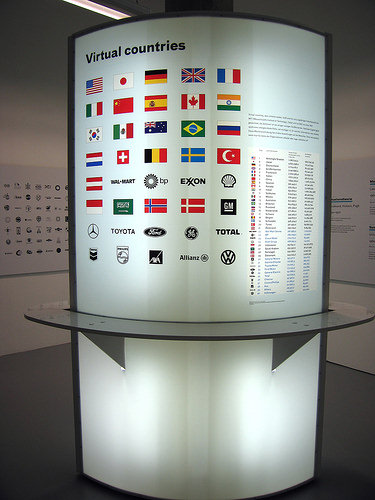
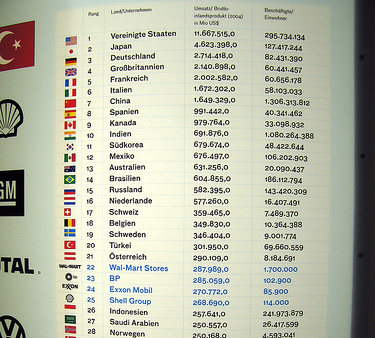
Virtual countries
This stand present the largest virtual countries according to the gross domestic product of the countries and world’s largest companies.

Countries in Data Visualization and Infographics

Countries2 in Data Visualization and Infographics

Net Neutrality
This infographic is supposed to emphasize the importance of net neutrality; it isn’t really a data visualization, but it instantly delivers the message: this is how our future might look like.

Net-neutrality in Data Visualization and Infographics

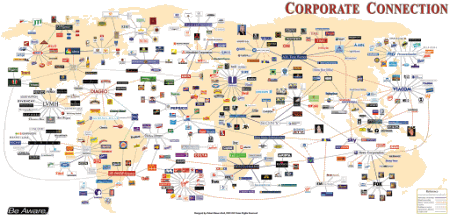
Corporate connections:
An extremely compact and useful source of information.

Corporate in Data Visualization and Infographics

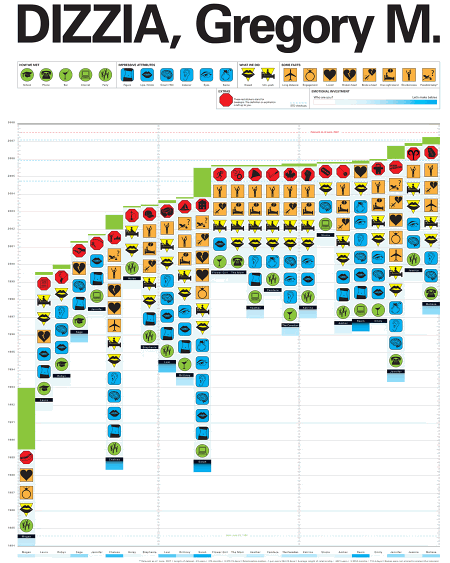
DIZZIA, Gregory M.
This is the documentation of every intimate relationship Gregory Dizzia has ever had. The data spans 23 years.

Intimate in Data Visualization and Infographics

Amadana Infographics
Amadana is a Japanese company, which explains why they might not have realized that a scapegoat isn’t the same as an “acuarium.” The first row is for that toaster oven, the second and third rows are for an air purifier, while the last is for a hot plate.

Toaster in Data Visualization and Infographics

The Japanese Wii Safety Manual
This Japanese Wii safety manual is pretty much indicative of Japanese people’s general insanity. [via Gizmodo]

Wii in Data Visualization and Infographics

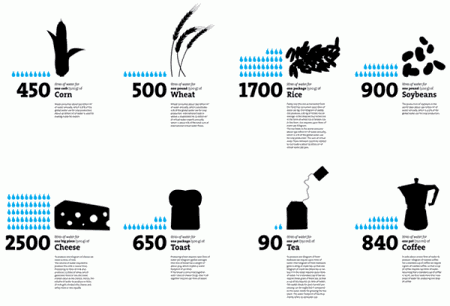
Virtual Water
Simple, clean, elegant and effective. A double-sided poster visualizing the water footprint of products and nations.

Virtualwater in Data Visualization and Infographics

Apple’s Tipping Point: Macs For The Masses
Very calm, soft and appealing colors within a clearly presented context. Design by Paul Nixon.

Apple in Data Visualization and Infographics

AT&T/Bell System Pre- & Post-Divestiture Chart
Peter Ross. 1985.

Pyramid in Data Visualization and Infographics

Flickr User Model
A slightly more complex data infographics, however still clear and well-presented.

Flickr in Data Visualization and Infographics

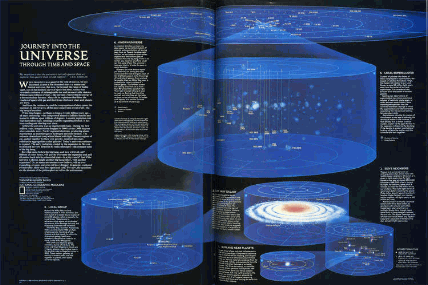
Journey into the Universe (1985)
Information design, 1985.

Journey in Data Visualization and Infographics

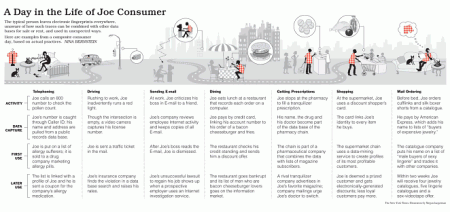
Megan Jaegerman
A review of Megan Jaegerman’s work by Edward Tufte. Notice how clean and legible the infographics are.

Asket1 in Data Visualization and Infographics

Asket2 in Data Visualization and Infographics

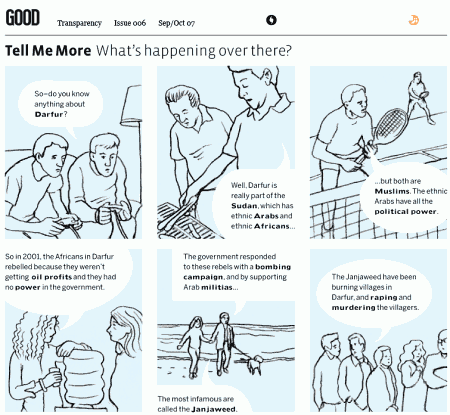
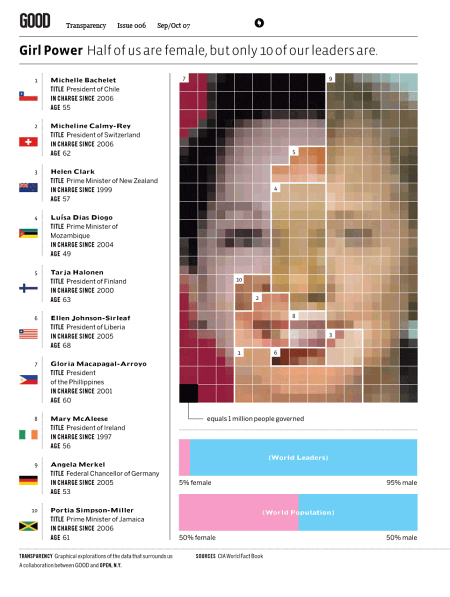
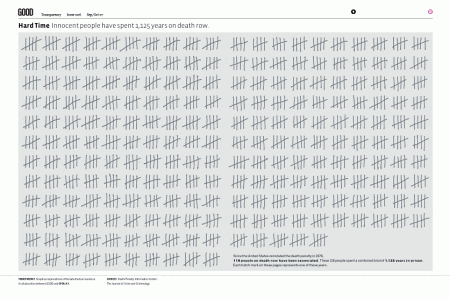
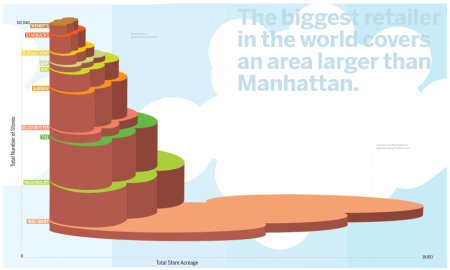
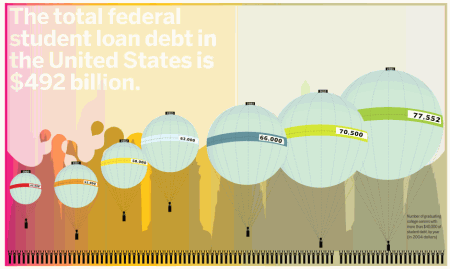
Good Magazine Infographics
In each of its issues Good magazine offers good, even excellent, infographics related to aspects of our life. Some excellent examples below.

Tellmemore in Data Visualization and Infographics

Girls in Data Visualization and Infographics

Innocent in Data Visualization and Infographics

Storespace in Data Visualization and Infographics

Debt in Data Visualization and Infographics

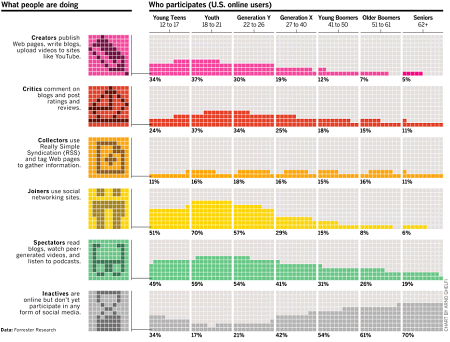
Who Participates and what people are doing online
A slightly different presentation of usual charts gives it some uniqueness and appeal. [via Kottke.org]

Online in Data Visualization and Infographics

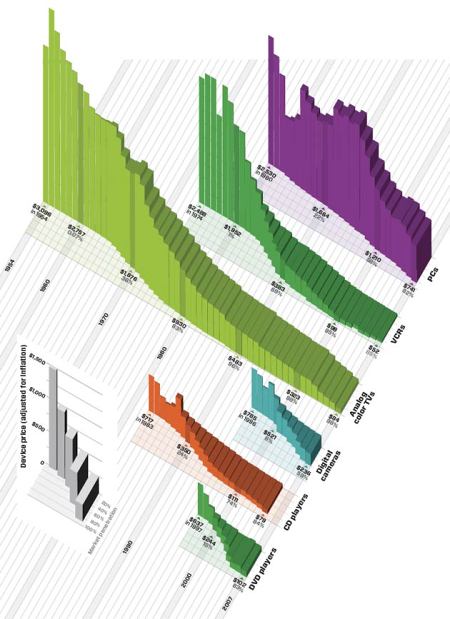
The Cost of Living on the Bleeding Edge of Gadgetry
Price and market penetration of consumer electronics over the past 50 years. By Arno Ghelfi. Infographics from a quite different perspective.

Infogr in Data Visualization and Infographics

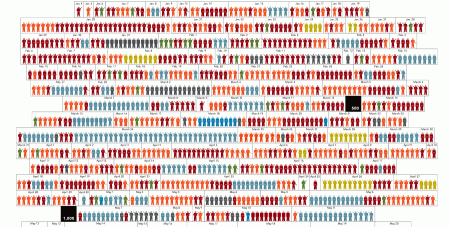
A year in Iraq
An unusual data visualization which gives information on the type and location of each attack responsible for the 2,592 recorded deaths.

Iraq in Data Visualization and Infographics

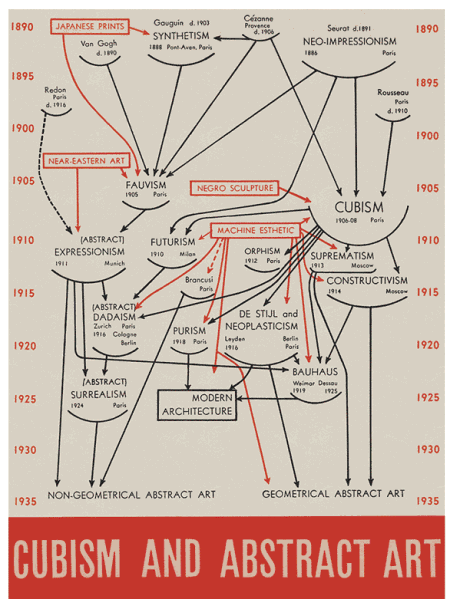
Cubism and Abstract Art
Clean, informative and elegant. Alfred Barr’s work, found in Edward Tufte’s book.

Tufte in Data Visualization and Infographics

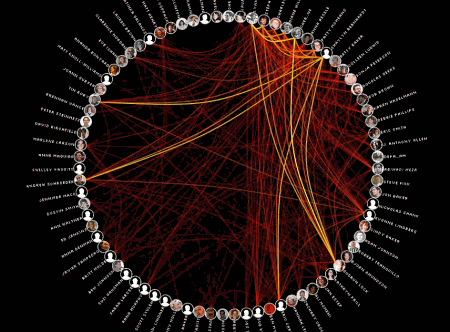
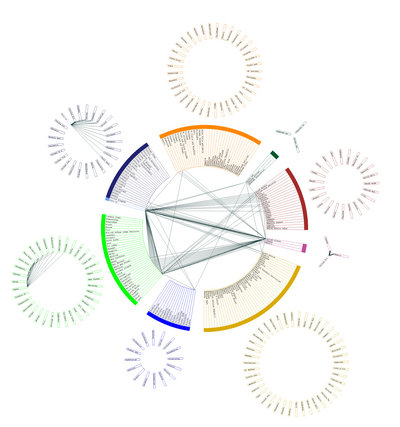
MyMap
A data visualization application capable of rendering the relationships between the user and individuals in the address book by examining the TO:, FROM:, and CC: fields of every email in the 60,000-large email archive.the intensity of the relationship is determined by the color intensity of the line. “My Map” allows to explore different relational groupings and periods of time, revealing the temporal ebbs and flows in various relationships. My Map thus becomes a veritable self-portrait, a visual reflection of personal associations and relationships.

Social in Data Visualization and Infographics

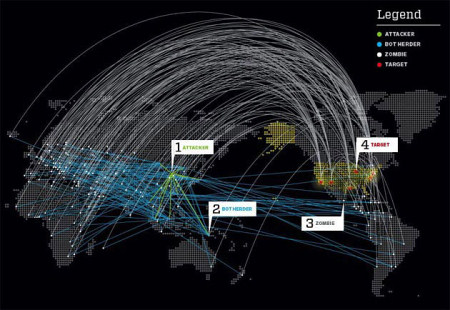
When Bots Attack
Using rented botnets, you can launch hundreds of thousands — even millions — of infobombs at a target, all while maintaining total deniability. In this hypothetical scenario, a single attack launched by China against the US lasts only a few hours, but a full-scale assault lasting days or weeks could bring an entire modern information economy to its knees. This infographic is supposed to illustrate it.

Estonia in Data Visualization and Infographics

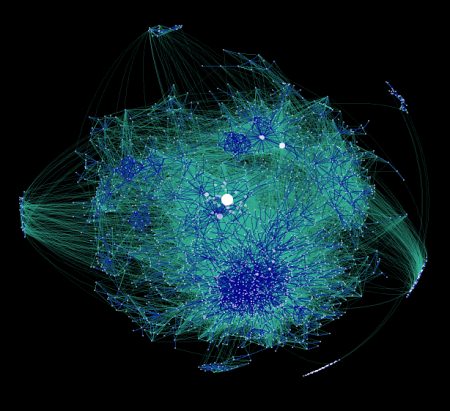
Mapping the Blogosphere
This is what the blogosphere looks like…

Blogs in Data Visualization and Infographics

Globalization
…what about globalization?

Global in Data Visualization and Infographics

George W. Bush Speech Infographics
An interactive infographic, compares the number of times certain words appear in the address. Both are a nice example of how information design can give readers more ways to evaluate and contextualize a given text or set of data. So simple, but extremely intuitive and clear.

Nyt Words in Data Visualization and Infographics

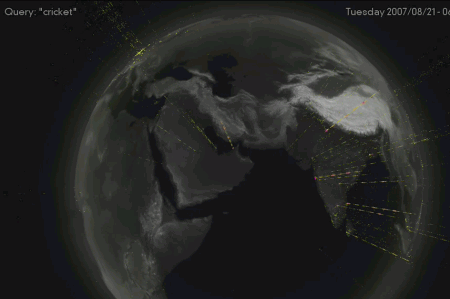
yHaus: BookScape, Query Bursts. Experimental projects by Yahoo! Design Innovation Team. These query bursts depict individual IP numbers that start very popular bursts of search queries. each particle shows a query from a unique location worldwide. bookscape represents about 250,000 illustrations taken from children books, originally collected by the Open Library Project. The experimental interface uses dynamic resampling of image data to place all the images in a single zoomable space, arranged alphabetically by title.

Query in Data Visualization and Infographics

Sources and Resources

Vitaly Friedman, editor-in-chief of Smashing Magazine (www.smashingmagazine.com), an online magazine dedicated to designers and developers.

Post Rating
1 Star2 Stars3 Stars4 Stars5 Stars (No votes yet)
Loading ... Loading ...

Tags: ,

Advertising
  1. 1
    Evandro Guedes
    January 14th, 2008 3:40 am

    GREAT POST!!!

  2. 2
    Mike Seaby
    January 14th, 2008 4:03 am

    There’s some beautiful examples here – in particular MyMap. Loving the wii safety manual btw!

  3. 3
    Jon Aizlewood
    January 14th, 2008 4:27 am

    Fantastic post.
    Phenomenal post.
    Splendiferous post.
    Supercalafragilisticexpialadocious post.

    Keep up the great work (as always).

  4. 4
    Chris Vincent
    January 14th, 2008 4:49 am

    Data is what makes the world turn and to make it look good… is good

  5. 5
    Amarjeet Sinh Rai
    January 14th, 2008 4:53 am

    Please fix the link for “When Bots Attack” goes to a wrong page.

    Thanks.

  6. 6
    uli
    January 14th, 2008 4:59 am

    very interesting collection, thanks!

  7. 7
    uyasar
    January 14th, 2008 5:03 am

    Thanks nice collection!

  8. 8
    Alexis Brion
    January 14th, 2008 5:04 am

    Nice collection. The Japanese Wii safety manual is hilarious!

  9. 9
    Vitaly Friedman & Sven Lennartz
    January 14th, 2008 5:05 am

    @Amarjeet Sinh Rai: thank you, fixed.

  10. 10
    bbx
    January 14th, 2008 5:37 am

    I only knew a couple of these. It’s a great list: thoughtful and interesting. It really shows how images can easily deliver a powerful message. It’s not always the case, but when it’s well done and well thought, it works great.

  11. 11
    Jorge camoes
    January 14th, 2008 5:39 am

    Great post, as usual, but “communicating information clearly and effectively” is something that several of these examples don’t really do (there are great infographics in the NYT, but the one presented here is not one of them, imho).

  12. 12
    Jens Meiert
    January 14th, 2008 6:16 am

    Certainly inspirational but also containing quite some chartjunk and samples for rather bad information design. It would be interesting to see what at least Kaiser Fung thinks and makes of these samples.

  13. 13
    Fuadass
    January 14th, 2008 6:29 am

    Amazing post, love the information. and so many examples :)

  14. 14
    Fiona
    January 14th, 2008 7:08 am

    I love this list! Thanks! I must get a copy of the Country Codes of the World map for my home office.

  15. 15
    Anthony
    January 14th, 2008 7:22 am

    This is a pretty awesome post! Thanks!

  16. 16
    Redshift
    January 14th, 2008 7:37 am

    COOOOOOOOL. :-D

  17. 17
    Andrew
    January 14th, 2008 8:48 am

    The Cubism and Abstract Art diagram is not by Edward Tufte, although he’s included it as an example in his books. The diagram is by Alfred Barr, as Tufte himself says here.

  18. 18
    Nathan
    January 14th, 2008 9:01 am

    Practically everything the Times produces is top notch, and GOOD magazine’s transparency section is always enjoyable. Probably why I subscribe to both.

  19. 19
    Vitaly Friedman & Sven Lennartz
    January 14th, 2008 9:42 am

    @Andrew: thank you, fixed.

  20. 20
    Alex
    January 14th, 2008 10:38 am

    For more great infographics (and some not-so-great), check out http://www.visualcomplexity.com
    That site and Edward Tufte give me all the inspiration I need. Great post!

  21. 21
    Creativepayne
    January 14th, 2008 12:19 pm

    Awesome, it’s nice to see non web examples mixed in. Thanks

  22. 22
    Joke Cricket
    January 14th, 2008 1:04 pm

    Its really Funny and Informative..

  23. 23
    jayhan
    January 14th, 2008 7:15 pm

    Cool and inspiring post. I love the clean approach of Virtual Water, brilliant design!

  24. 24
    Eryn Whitworth
    January 14th, 2008 8:10 pm

    I am very impressed with this post and hope to see more like it!!

  25. 25
    johno
    January 14th, 2008 10:21 pm

    Some truly inspiring examples. Thanks for putting this together. This one is being bookmarked twice :)

  26. 26
    kuldeep
    January 14th, 2008 11:53 pm

    Whats a creative post!!
    Thank you! really inspired me :)

  27. 27
    Edi
    January 15th, 2008 12:59 am

    Usually, Great article
    Can’t wait for the next one to come

  28. 28
    imaginepaolo
    January 15th, 2008 3:22 am

    Great Post, please help us to stop destroing Campania…
    Stop Killing Campania

  29. 29
    emptyzpace
    January 15th, 2008 9:30 am

    Great!!

  30. 30
    nick
    January 15th, 2008 12:53 pm

    What about Information Architects’ web trend map?

  31. 31
    martin
    January 15th, 2008 3:42 pm

    thank you, awesome! i mean, really.
    nothing in the near future will be able to cope with this list, but for the interested:

  32. 32
    fedmich
    January 16th, 2008 12:00 am

    wow, those are beautiful thanks
    :)

  33. 33
    Sonny
    January 16th, 2008 12:47 am

    WONDERFUL :O :D !

  34. 34
    Keith
    January 16th, 2008 10:13 am

    This is a really GREAT article…thanks for sharing. Regards, Keith

  35. 35
    NL
    January 16th, 2008 8:05 pm

    Very useful collection! Thank you

  36. 36
  37. 37
    Rafael Pol
    January 17th, 2008 5:23 pm

    I Just Love Smashing Magazine. I can’t imagine a life without it.

    Thanks!

  38. 38
    norman
    January 29th, 2008 3:08 am

    great, really good collection.

  39. 39
    Tyler @ Building Camelot
    January 29th, 2008 10:03 pm

    I’m a data guy at work and I LOVE these visualizations! I wish I could apply some of these to explain things at work.
    Great site! Keep up the great work!

  40. 40
    grace v
    February 12th, 2008 8:37 am

    I love love love infographics done well, but my fav from this post might be the flags as infographics. I think it’s very clever and challenging to use an existing image and then relate true & relevant information in proportion to the simple flag graphics.

    And the deathrow scratches are a very simple solution that speaks nicely to the topic.

  41. 41
    Jan Alvin
    March 6th, 2008 5:59 pm

    You have a great collection of art pieces.

  42. 42
    andol
    April 6th, 2008 6:58 pm

    i like it~

  43. 43
    Hisham Abdel Maguid
    April 29th, 2008 10:15 am

    Epic Systems together with Beemode (www.beemode.com) has developed a Data Visualization software “Trend Compass” almost ready to be released soon. It is an extension to Gapminder which was invented by a Swedish Professor. You can view it :

    - http://www.gapminder.org

    We are looking to promote that software in various sectors. It is a new concept in viewing statistics and trends in an animated way. It could be used in presentation, analysis,research, decision making, etc.

    Here is one link for part of what we did with some Governmental institution:
    http://www.epicsyst.com/visual.swf

    Here is another link for a project we did with Princeton University on US unemployment :

    http://www.epicsyst.com/main3.swf

    I hope you could evaluate it and give me your comments. So many ideas are there.

    In a few days you can test the software by uploading data on our website and getting the corresponding Flash charts. This is for a limited number of users.

    Eng. Hisham Abdel Maguid

  44. 44
    Arnaud Velten
    May 13th, 2008 6:02 am

    try my isomap ;) 3D iso resume (french texte :/)
    http://www.as-map.com

  45. 45
    Hisham Abdel Maguid
    May 15th, 2008 5:09 pm

    Now you can upload EXCEL and use our Trend Compass Software at :

    http://www.epicsyst.com

    Also see another sample link :

    http://www.epicsyst.com/main11.swf

    Hisham Abdel Maguid

  46. 46
    Hisham Abdel Maguid
    June 9th, 2008 2:23 pm

    Try this link on Ads Monitoring on TV Sattelite Channels during April 2008. Pick Duration (Ads daily duration) vs Repeat (Ads repetition per day). Check the Trail Box to get a better view.

    http://www.epicsyst.com/ads3/allchannels.swf

  47. 47
    Arindam Biswas
    June 23rd, 2008 3:56 am

    It is very encouraging to do better and better everyday. Thanks for posting all these.

  48. 48
    bily
    July 11th, 2008 10:57 pm

    love it

  49. 49
    glen
    August 15th, 2008 1:43 am

    fantastic resource, cheers

  50. 50
    giusy
    October 25th, 2008 7:02 am

    thank you for this link, it’s really really fantastic and interesting: I will use some links for my university thesis. thank you.

  51. 51
    George
    May 5th, 2009 5:09 pm

    Once again Smashing Magazine hits the nail on the head! Some really good graphics in this list. The first 3 in particular are really good, they are “as simple as possible, and no simpler” the list helped me a lot with my design project so I just wanted to say thanks! (I also added you guys as a resource on my own infographic list link )

  52. 52
    Jeremy Yingling
    May 21st, 2009 6:56 am

    I’m actually quite impressed by this list. Most of these lists include some pretty gratuitous graphics that value some visual style over clear presentation of data.

    Here’s one I finished recently for consideration in your next list.

    http://www.infojocks.com

  53. 53
    dlv
    September 11th, 2009 9:03 am

    about #”Flags as Infographics”, googe show me that Newsdesigner.com is blocked and targeted as dangerous :O

  54. 54
    Yucin txt
    October 31st, 2009 1:05 pm

    Thanks nice collection!

  1. 00

    There are no trackbacks at this time. If you are interested in leaving a trackback, please use this URL.

Leave a Comment

Make sure you enter the * required information where indicated. Please also rate the article as it will help us decide future content and posts. Comments are moderated – and rel="nofollow" is in use. Please no link dropping, no keywords or domains as names; do not spam, and do not advertise!


Advertisement Advertise with us!
Join in Smashing Forum
  • No items transmitted. Please check back later.
Post your job
Advertisement