15 Helpful In-Browser Web Development Tools

Email Newsletter
Weekly tips on front-end & UX.
Trusted by 182,000+ folks.
 Register for Free
 Celebrating 10 million developers
 Custom Web Forms for Angular, React, & Vue. Your backend.


There are many useful Web development tools that integrate in your browser. These in-browser tools are commonly known as add-ons or extensions. Though add-ons and extensions aren’t just for Web development, many of them out there are designed specifically for Web developers. In-browser tools vary greatly in the jobs they perform; for example, some of them help you diagnose issues with CSS, HTML and JavaScript, while others evaluate the accessibility of your website.
In this article, we explore some of the most popular and useful in-browser Web development tools. You’ll find tools for popular Web browsers like Firefox and Internet Explorer. Whether you need to debug and inspect your HTML, inspect HTTP headers, access FTP source files, evaluate accessibility or just figure out what color a Web page element is, you may find a variety of tools discussed here useful.
You might be interested in the following related posts:
- 40+ Desert Island Web Development Tools
- Useful Coding Tools and JavaScript Libraries For Web Developers
- Next-Generation Responsive Web Design Tools: Webflow, Edge Reflow, Macaw
Firebug
Firebug is an extension for the Mozilla Firefox browser that allows you to debug and inspect HTML, CSS, the Document Object Model (DOM) and JavaScript. Though it has many strong features, it’s most known for revolutionizing the way developers debug and profile JavaScript code.
For example, before Firebug, many developers would use the alert() function to see what a variable contains or to find what line the code breaks. With Firebug enabled, you’re told specifically what the error is and which line it comes from. Firebug is an excellent tool for AJAX application developers because it lets you explore and perform on-the-fly edits on the DOM to see what happens when you manipulate Web page elements after a user action.
Aside from its popular JavaScript and DOM functionalities, Firebug can also log network activity to allow you to see detailed results of HTTP connections, inspect and edit HTML on the fly and debug and visualize your CSS.
Further Reading
Web Developer
The Web Developer extension (for the Firefox, Flock and SeaMonkey Web browsers) is an add-on that adds a tool bar with a menu of options for debugging and inspecting Web pages. It has a ton of features, my favorite being the View CSS Information option (CSS >> View Style Information, or Control + Shift + Y on Windows) which makes a page element clickable and shows you CSS selectors that affect that particular page element. It’s helpful for exploring and understanding large CSS files and projects that you’re unfamiliar with (such as a new open-source content management system).
It has built-in options for syntax validation for popular Web services, such as W3C’s CSS Validator and HiSoftware’s Web Content Accessibility Report, for your convenience. It has many other useful features, such as disable options for CSS, JavaScript and images, to test for degradation and progressive enhancement; a Forms menu with options for working with Web forms; Display Div Order and Display Block Size options to help you visualize the layout; and so much more.
YSlow
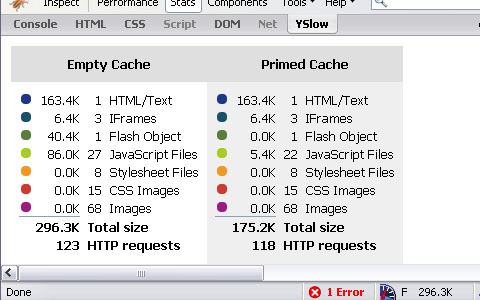
YSlow is a Firefox extension created by Yahoo! developers that integrates with Firebug (therefore you need to have Firebug enabled for it to work). YSlow analyzes a Web page for front-end performance and, in its simplest usage, gives you a letter grade (A being the best and F being the poorest) for each of the best practices for speeding up your website.
YSlow also allows you to inspect in detail things that are essential for a high-performance website. For example, the Stats view gives you the total size of a Web page and a summary of items that are loaded when the Web page is requested (i.e. style sheets, JavaScript files, Flash objects and images), so that you can hunt down the bottlenecks that cause a Web page to load slowly.
The Components view outlines every single component of a Web page in tabular format and allows you to inspect it to see attributes such as size, expiration date (for cached files), whether it uses server-side compression (Gzip) and response time (how long the component took to load).
Further Reading
- What the 80⁄20 Rule Tells Us about Reducing HTTP Requests
- Maximizing Parallel Downloads in the Carpool Lane
- Yahoo’s Problems Are Not Your Problems: counter-arguments for some of the rules developed by Yahoo!, such as penalizing you for not having a Content Delivery Network.
Internet Explorer Web (Edge) Developer Toolbar
If you need similar functionality to that of Firebug and Web Developer for Firefox, but want to debug, inspect and tune your Web pages and applications on the Internet Explorer browser, check out the Internet Explorer Web Developer Toolbar. The IE Web Developer Toolbar, when enabled, opens a toggle-able pane located at the bottom of the Web browser, giving you access to many helpful options for exploring Web page components.
For example, you can experiment to see how page elements work by editing the Web page’s DOM and HTML directly in the browser, allowing you to quickly change and edit DOM elements to see what happens when you perform certain actions or modify certain parts of the code. You can also debug, test and inspect JavaScript with the IE Web Developer Toolbar, giving you options for setting breakpoints, seeing the call stack and exploring variable attributes.
It has a ton of other helpful features, such as selectively disabling IE settings (to see how your Web pages degrade in IE); the ability to view the HTML and CSS source of any Web page with syntax-highlighting; and an in-browser ruler to help you measure things on a Web page.
Fiddler Web Debugger
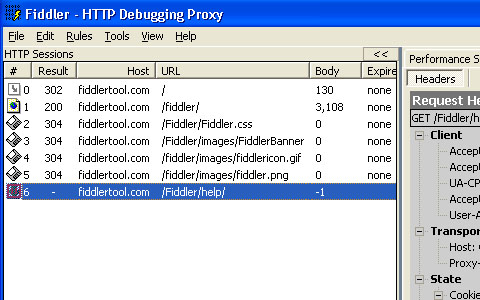
Fiddler is an Internet Explorer extension that analyzes and profiles a Web page’s HTTP traffic. If you’ve ever wanted to know exactly what happens when a client requests a Web page, Fiddler is the tool that’ll help you do the job. The HTTP Statistics view exposes all components and files required to generate a particular page, giving you details such as the total number of HTTP requests, total page weight, HTTP response headers and cache expiration.
Fiddler permits you to set up breakpoints, allowing you to step through and edit HTTP traffic (to see how it would affect your Web page), a useful feature for analyzing AJAX-based interaction and potential security flaws in a Web application. Perhaps what makes Fiddler so powerful is its extensibility, allowing you to create your own scripts (or import other developers’ scripts) to perform certain tasks or make interface modifications to the extension itself.
Further Reading
DebugBar
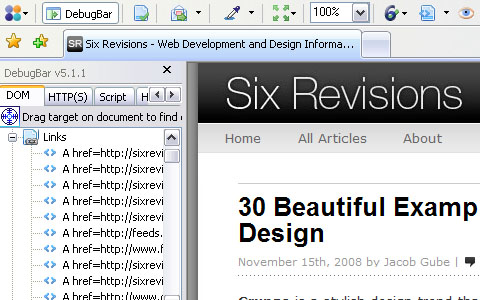
DebugBar is a debugging in-browser extension for the Internet Explorer browser. It has many helpful features, such as the ability to send a Web page screenshot via email, a color picker, the ability to view both the original and interpreted code (i.e. if you use JavaScript to manipulate the styles of a DOM object, then you can see the interpreted HTML source code of that manipulation) and a Console API (after installing Companion.JS) to help you gain information through a command-line interface about particular components of a Web page.
DebugBar is free for personal and educational use, but you are required to buy a license if you use it for commercial purposes.
HttpWatch
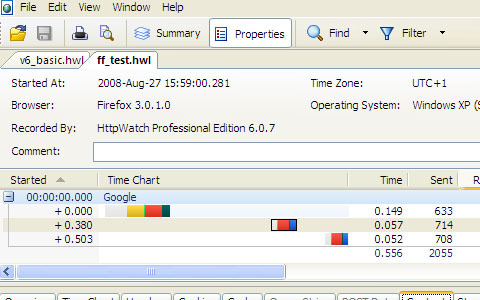
HttpWatch is another HTTP traffic viewer and debugger for Firefox and Internet Explorer that is similar to Fiddler. It has many unique features and a more intuitive, less intimidating interface than Fiddler. Some notable features are the ability to generate request-level time charts (useful for documentation and presentation purposes); decryption of HTTPS traffic to help you debug, inspect and tweak your secure SSL-based connections; and the ability to export captured data to XML and CSV formats for importing into spreadsheet applications such as Microsoft Excel or Google Spreadsheets.
HTTPWatch has a Basic edition, which is free, and a Professional edition, which has more options. Check out the comparison table between the two editions to see the exact differences.
Live HTTP Headers
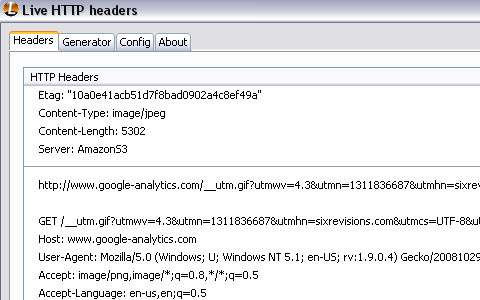
Live HTTP Headers is a Firefox extension that allows you to inspect HTTP request and response headers. Exploring HTTP headers allows you to debug Web applications, glean some information about the website’s server and inspect cookies sent to the client requesting the page.
For example, the Server response header gives you a website’s HTTP server type (Apache, IIS, nginx, etc.), the HTTP server version and the operating system (though server administrators can remove or limit the information you see for security purposes).
Web Accessibility Toolbar
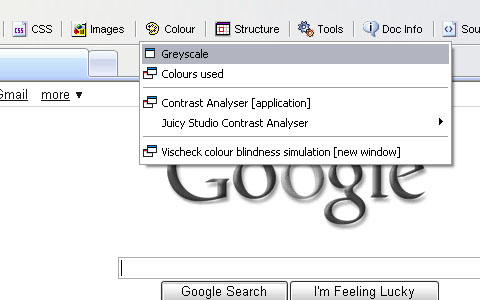
The Web Accessibility Toolbar is a freeware extension for Internet Explorer and Opera that gives you a slew of options for quickly evaluating and analyzing your Web content’s accessibility. It has validation options for submitting your URL to content accessibility web services, a grayscale converter to simulate the user experience of individuals with color-blindness and poor eyesight, and a search function for particular page structures (e.g. finding list objects and unordered lists).
Venkman JavaScript Debugger
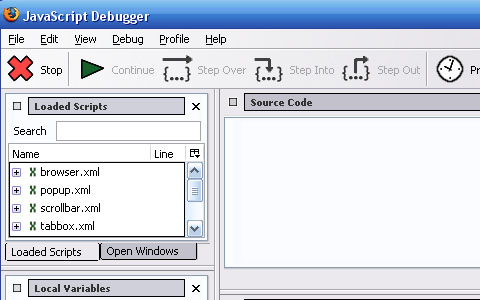
Venkman is the codename for Mozilla’s very own JavaScript debugging environment. It is available as an add-on that can be used to extend browsers such as Firefox, Netscape, and SeaMonkey. It is a robust environment for doing complex JavaScript debugging and troubleshooting. The Console view gives you a command-line interface for interacting with the debugger. It has an excellent Stack view feature that allows you to step through active functions when it reaches breakpoints.
Further Reading
ColorZilla
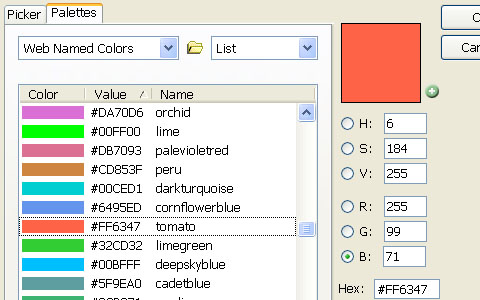
ColorZilla is an incredibly simple — but very useful — extension for Firefox. If you’ve ever wanted to determine what colors are used on a Web page, ColorZilla is the tool for the job. It adds an eyedropper icon to the bottom-left corner of Firefox.
Clicking on the eyedropper icon makes objects on the Web page clickable, and upon clicking a particular section of a Web page, it outputs the hexadecimal, RGB and hue/saturation values of that area . Before ColorZilla, you might have pasted a screen capture of a Web page into a graphics editor like Photoshop and then used the eyedropper tool in the editor to sample colors. ColorZilla saves you time and streamlines color-sampling processes.
FireShot
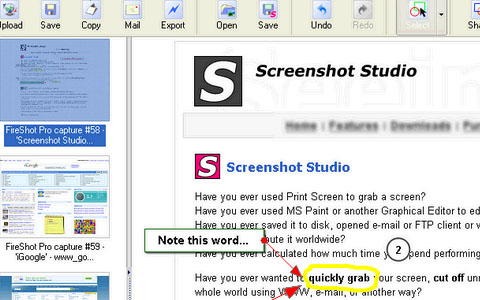
FireShot is an in-browser tool for Firefox and Internet Explorer that allows you to take screenshots and then annotate, edit, organize and export them. Screen-grabbing is a common activity for Web developers to document previews of Web application prototypes and share them with clients, and FireShot gives you a feature-packed in-browser option to manage and streamline your screenshot needs.
Web Inspector
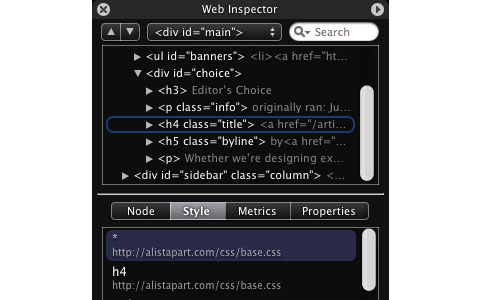
Web Inspector is part of the Webkit open-source browser engine project. It’s an ultra-sleek tool for inspecting the DOM hierarchy in a separate, compact HUD-style window. You can easily search the DOM, explore the DOM tree (hierarchy) and have a useful interface for isolating DOM sub-trees and nodes so that you can focus on particular sections of a Web page. The Web Inspector also provides you with a Style pane to explore CSS rules applied to particular page elements.
FireFTP
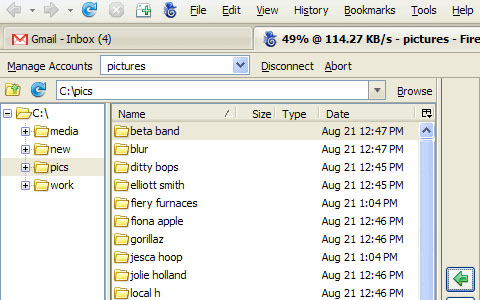
FireFTP is a free, cross-platform Firefox extension for FTP’ing files. It offers several advantages to stand-alone FTP applications, such as its operating system-independent requirements. What’s exceptional about FireFTP is that even though it is an in-browser (and free!) application, it has all the features you would expect from a standalone FTP application, such as support for secure (SSL, TLS, SFTP) protocols, a synchronization feature to sync up local and remote files, and directory comparison to help you see what files are missing or different between two directories and much more.
What’s your favorite in-browser tool?
There is an overwhelming amount of in-browser tools for Web development out there. Some are specific to particular Web technologies and set-ups (such as FirePHP for PHP developers, SQLite Manager for developers using SQLite databases. If your favorite tool isn’t on the list, let us know in the comments section why it’s your favorite and why we should check it out.


