How To Keep Your Google Analytics Data Safe And Clean
Whoever works with analytics on a day-to-to-day basis knows how important it is to have a continuity with the data. Any slip might be fatal: data can disappear, trends misunderstood and jobs lost. Losing data can have long-lasting consequences, as very often it isn’t possible to reprocess the data—so what is lost cannot be recovered.
For this reason, it is essential to have a place where you can test changes to your settings and configurations. It is also important to keep track of changes in a way that they can be used to provide a context for analysts, so that when you are looking at incomprehensible spikes in past data, you can check whether any changes were made to the data collection methods (or if an offline campaign was in place during the period analyzed). Having such a process in place will help to keep data safe from loss and clean from inaccuracies.
Further Reading on SmashingMag:
- A Guide To Google Analytics And Useful Tools
- How To Simplify Mobile App Data With Analytics
- Enabling Multiscreen Tracking With Google Analytics
- Assessing Mobile Usability With Google Webmaster Tools
As Neil Mason describes on his presentation about Data Discovery: “all data is dirty and needs to be cleaned and transformed, this is the heavy lifting stage.” Below I describe four techniques that will help analysts and marketers to ease the burden of inaccurate data usage Google Analytics. I provide examples on how this can affect the data, and share tips on ways to make them happen.
Google Analytics Accounts And Profiles
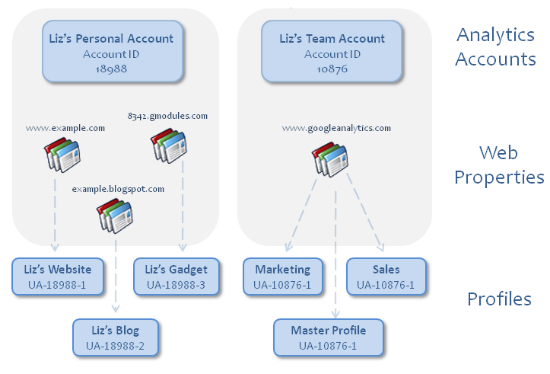
The Google Analytics code site offers an in depth explanation of the hierarchy used by the tool to manage report access and data collection. There are three important levels that we need to be aware of:
- Account: An account is the mother of all Web properties and profiles, and has a unique account ID that can be used to track multiple websites.
- Web Property: The web property has a unique ID, which is a combination of the account ID and additional digits. Since different Web properties have different IDs, their data cannot be merged.
- Profile: the gateway to the website reports. It determines which data from your website appears in the reports. Filters can be applied to profiles in order to segment the data; for example, it is possible to create a profile only with visitors from USA, only from new visitors, etc. Since profiles use the same account and Web property IDs, data for multiple profiles can also be seen in aggregate.
Below is part of the scheme provided on the code from the website mentioned above. The image well represents the possibilities of data collection and management.

Diagram showing the possible Analytics account configurations.
Important to note that Google Analytics still misses the mark on an important feature related to account configuration: report level access. This means that the lowest access that can be given to a user is a profile, so it is not possible to provide access to reports. As I wrote in an article about Google Analytics Perception & Reality:
As of today, Google provides just two options when it comes to providing access: Administrator (who can access anything in the account) and Viewer (who can access specific profiles). This division is far from good. In any mid-sized company, the data needs to be more modular (i.e. enable showing different reports to different people).
Creating an Analytics Staging Profile
Let’s suppose you read in a random blog that you should create a filter to lowercase URIs for all of your profiles (if you don’t have one yet, check point five on this implementation checklist). And suppose you have no idea how this can impact your data.
The best way to learn how filters affect your Google Analytics data would be to have two profiles with the exact same settings (the real profile, and the test profile) and apply a new filter only to the test profile. Once it is applied, you can check the data and compare the number to learn if anything went wrong. Here is an article from the Google Analytics Help Center on how to create profiles.
Creating an Analytics Staging Account
If you work in the Web Analytics field long enough, you have certainly experienced data loss as a consequence of bad implementations. It happens, and the best we can do is to have a Web Analytics Process in place that will help us avoid it. Not long ago, I implemented the _trackPageLoadTime() method (now deprecated) for a website, and as a result from a lack of attention, I lost six days worth of data (yes, I didn’t log in quite enough to Analytics during this week!) See graph below:

Example of how a bad Google Analytics implementation can affect data collection.
The story above illustrates the fact that code changes should be dealt with carefully. Since most websites do have a staging site where changes are tested before going live, I suggest having a different tracking code used for those environments to test code changes on the Google Analytics script (i.e. a new Google Analytics account). This technique is very similar to the one proposed above to check filter changes—it only goes one step further.
Tracking Profile Changes & Configurations
When it comes to both external and internal changes, context is one of the most important factors for analyzing data. For this reason, it is crucial to have a log of changes that affect your data, as well as changes in marketing campaigns and other company efforts. Below I present two ways to keep this data in an accurate and accessible way.
Keeping Track of Internal Changes
Changes are constantly made to Google Analytics profiles by users: website goals, improved filters, new features, and others. Every change may impact data in several ways, even when not expected. For this reason, I propose a method that will help to keep track of those changes, especially in large organizations where more than one person is involved with Google Analytics. Even when one person is involved, this is important as employees usually do not work with just one company “to infinity… and beyond!”
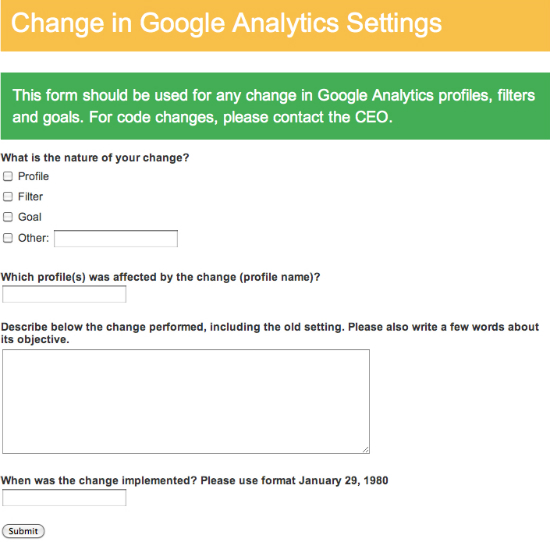
In order to make this task easy and centralized, I propose using a Google Docs form. Using such a form will facilitate the collection and sharing of the changes made to a Google Analytics account. The form should be created so that multiple teams will be aware of all changes. These will then be aggregated for historical knowledge that can be used by the whole team (and future teams members).
Below is an example of such a form with fields that you might want to create (learm how to build a Google Docs form).

Example of a Google Docs form that can be used to track Google Analytics changes.
Keeping Track of External & Overall Changes with Annotations
Back in 2010, The Analytics team had announced a feature which in my opinion is one of the most important features of the tool: Google Analytics Annotations. This feature allows website managers to provide context for where the numbers live (the graphs on the interface), allowing for richer analyses. Here are some important occasions when you should use this feature:
- New offline marketing campaigns (e.g. radio, TV, billboards).
- Major changes to the website (e.g. design, structure, content).
- Changes to tracking (e.g. changing the tracking code, adding events).
- Changes to goals or filters.
While annotations can—and should—also be used for technical changes to the website (as mentioned above), it is important to keep them at a high level. This means that you shouldn’t add too much information about your changes, just the overall picture; otherwise the annotations will quickly become overcrowded. Therefore, the use of both methods described above (form and annotations) should create an optimal mix. Below is a video explaining how to use the Annotations feature:
Video explaining how to use the Google Analytics Annotations feature.
Closing Thoughts
In this post we discussed ways to avoid bad implementations—by putting into place a process that requires users to report on changes made to their Google Analytics accounts. This not only helps in avoiding mistakes, but also helps find the source of problems, and solutions for fixing them quickly.
Google Analytics is a great tool, and one of its greatest qualities is that it makes Analytics ubiquitous—most people in any organization can use it; from Management to Marketing to IT. This means that many hands must deal with the tool, which requires an easy way to deal with the changes to those tool settings and configurations. Hopefully this post has provided some ideas on how to do it.
Please comment with any additional ideas on how to keep Google Analytics data safe and clean.
(jvb) (il)


 Flexible CMS. Headless & API 1st
 Register!

