Gone In 60 Frames Per Second: A Pinterest Paint Performance Case Study

Email Newsletter
Weekly tips on front-end & UX.
Trusted by 182,000+ folks.
 Custom Web Forms for Angular, React, & Vue. Your backend.
 Celebrating 10 million developers


Today we’ll discuss how to improve the paint performance of your websites and Web apps. This is an area that we Web developers have only recently started looking at more closely, and it’s important because it could have an impact on your user engagement and user experience.
Frame Rate Applies To The Web, Too
Frame rate is the rate at which a device produces consecutive images to the screen. A low frames per second (FPS) means that individual frames can be made out by the eye. A high FPS gives users a more responsive feel. You’re probably used to this concept from the world of gaming, but it applies to the Web, too.
Long image decoding, unnecessary image resizing, heavy animation and data processing can all lead to dropped frames, which reduces the frame rate, resulting in janky pages. We’ll explain what exactly we mean by “jank” shortly.
Why Care About Frame Rate?
Smooth, high frame rates drive user engagement and can affect how much users interact with your website or app.
At EdgeConf earlier this year, Facebook confirmed this when it mentioned that in an A/B test, it slowed down scrolling from 60 FPS to 30 FPS, causing engagement to collapse. That said, if you can’t do high frame rates and 60 FPS is out of reach, then you’d at least want something smooth. If you’re doing your own animation, this is one benefit of using requestAnimationFrame: the browser can dynamically adjust to keep the frame rate normal.
In cases where you’re concerned about scrolling, the browser can manage the frame rate for you. But if you introduce a large amount of jank, then it won’t be able to do as good a job. So, try to avoid big hitches, such as long paints, long JavaScript execution times, long anything.
Don’t Guess It, Test It!
Before getting started, we need to step back and look at our approach. We all want our websites and apps to run more quickly. In fact, we’re arguably paid to write code that runs not only correctly, but quickly. As busy developers with deadlines, we find it very easy to rely on snippets of advice that we’ve read or heard. Problems arise when we do that, though, because the internals of browsers change very rapidly, and something that’s slow today could be quick tomorrow.
Another point to remember is that your app or website is unique, and, therefore, the performance issues you face will depend heavily on what you’re building. Optimizing a game is a very different beast to optimizing an app that users will have open for 200+ hours. If it’s a game, then you’ll likely need to focus your attention on the main loop and heavily optimize the chunk of code that is going to run every frame. With a DOM-heavy application, the memory usage might be the biggest performance bottleneck.
Your best option is to learn how to measure your application and understand what the code is doing. That way, when browsers change, you will still be clear about what matters to you and your team and will be able to make informed decisions. So, no matter what, don’t guess it, test it!
We’re going to discuss how to measure frame rate and paint performance shortly, so hold onto your seats!
Note: Some of the tools mentioned in this article require Chrome Canary, with the “Developer Tools experiments” enabled in about:flags. (We — Addy Osmani and Paul Lewis — are engineers on the Developer Relations team at Chrome.)
Case Study: Pinterest
The other day we were on Pinterest, trying to find some ponies to add to our pony board (Addy loves ponies!). So, we went over to the Pinterest feed and started scrolling through, looking for some ponies to add.
Addy adding some ponies to his Pinterest board, as one does. Larger view.
Jank Affects User Experience
The first thing we noticed as we scrolled was that scrolling on this page doesn’t perform very well — scrolling up and down takes effort, and the experience just feels sluggish. When they come up against this, users get frustrated, which means they’re more likely to leave. Of course, this is the last thing we want them to do!
Pinterest showing a performance bottleneck when a user scrolls. Larger view.
This break in consistent frame rate is something the Chrome team calls “jank,” and we’re not sure what’s causing it here. You can actually notice some of the frames being drawn as we scroll. But let’s visualize it! We’re going to open up Frames mode and show what slow looks like there in just a moment.
Note: What we’re really looking for is a consistently high FPS, ideally matching the refresh rate of the screen. In many cases, this will be 60 FPS, but it’s not guaranteed, so check the devices you’re targeting.
Now, as JavaScript developers, our first instinct is to suspect a memory leak as being the cause. Perhaps some objects are being held around after a round of garbage collection. The reality, however, is that very often these days JavaScript is not a bottleneck. Our major performance problems come down to slow painting and rendering times. The DOM needs to be turned into pixels on the screen, and a lot of paint work when the user scrolls could result in a lot of slowing down.
Note: HTML5 Rocks specifically discusses some of the causes of slow scrolling. If you think you’re running into this problem, it’s worth a read.
Measuring Paint Performance
Frame Rate
We suspect that something on this page is affecting the frame rate. So, let’s go open up Chrome’s Developer Tools and head to the “Timeline” and “Frames” mode to record a new session. We’ll click the record button and start scrolling the page the way a normal user would. Now, to simulate a few minutes of usage, we’re going to scroll just a little faster.
Using Chrome’s Developer Tools to profile scrolling interactions. Larger view.
Up, down, up, down. What you’ll notice now in the summary view up at the top is a lot of purple and green, corresponding to painting and rendering times. Let’s stop recording for now. As we flip through these various frames, we see some pretty hefty “Recalculate Styles” and a lot of “Layout.”
If you look at the legend to the very right, you’ll see that we’ve actually blown our budget of 60 FPS, and we’re not even hitting 30 FPS either in many cases. It’s just performing quite poorly. Now, each of these bars in the summary view correspond to one frame — i.e. all of the work that Chrome has to do in order to be able to draw an app to the screen.
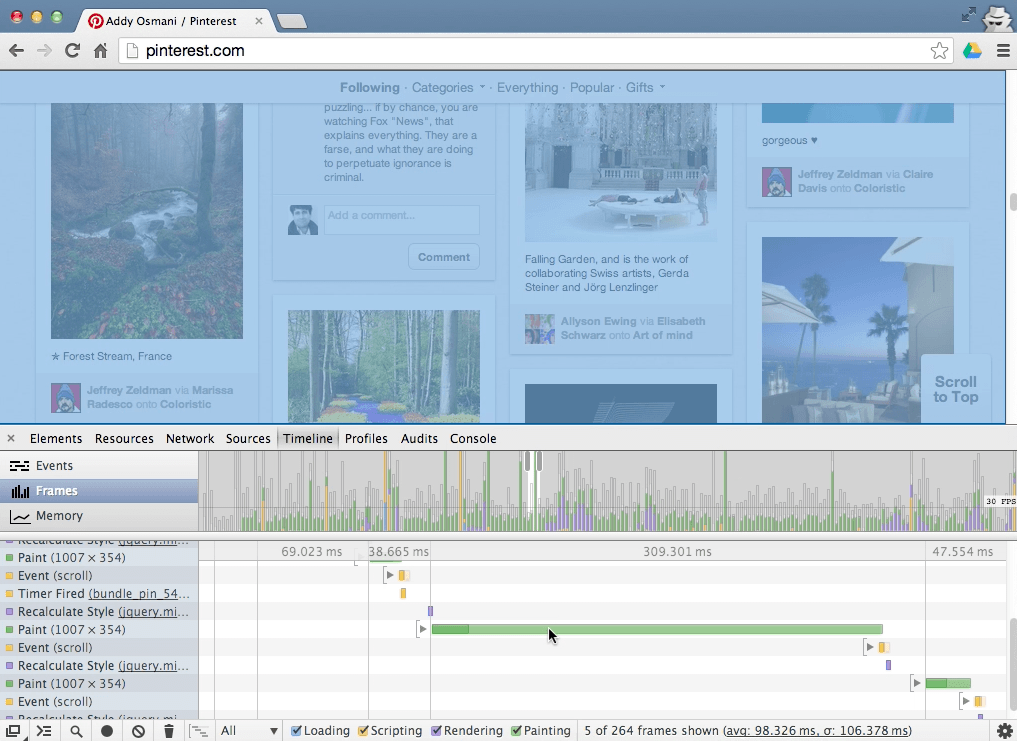
Chrome’s Developer Tools showing a long paint time. Larger view.
Frame Budget
If you’re targeting 60 FPS, which is generally the optimal number of frames to target these days, then to match the refresh rate of the devices we commonly use, you’ll have a 16.7-millisecond budget in which to complete everything — JavaScript, layout, image decoding and resizing, painting, compositing — everything.
Note: A constant frame rate is our ideal here. If you can’t hit 60 FPS for whatever reason, then you’re likely better off targeting 30 FPS, rather than allowing a variable frame rate between 30 and 60 FPS. In practice, this can be challenging to code because when the JavaScript finishes executing, all of the layout, paint and compositing work still has to be done, and predicting that ahead of time is very difficult. In any case, whatever your frame rate, ensure that it is consistent and doesn’t fluctuate (which would appear as stuttering).
If you’re aiming for low-end devices, such as mobile phones, then that frame budget of 16 milliseconds is really more like 8 to 10 milliseconds. This could be true on desktop as well, where your frame budget might be lowered as a result of miscellaneous browser processes. If you blow this budget, you will miss frames and see jank on the page. So, you likely have somewhere nearer 8 to 10 milliseconds, but be sure to test the devices you’re supporting to get a realistic idea of your budget.
An extremely costly layout operation of over 500 milliseconds. Larger view.
Note: We’ve also got an article on how to use the Chrome Developer Tools to find and fix rendering performance issues that focuses more on the timeline.
Going back to scrolling, we have a sneaking suspicion that a number of unnecessary repaints are occurring on this page with onscroll.
One common mistake is to stuff just way too much JavaScript into the onscroll handlers of a page — making it difficult to meet the frame budget at all. Aligning the work to the rendering pipeline (for example, by placing it in requestAnimationFrame) gives you a little more headroom, but you still have only those few milliseconds in which to get everything done.
The best thing you can do is just capture values such as scrollTop in your scroll handlers, and then use the most recent value inside a requestAnimationFrame callback.
Paint Rectangles
Let’s go back to Developer Tools → Settings and enable “Show paint rectangles.” This visualizes the areas of the screen that are being painted with a nice red highlight. Now look at what happens as we scroll through Pinterest.
Enabling Chrome Developer Tools’ “Paint Rectangles” feature. Larger view.
Every few milliseconds, we experience a big bright flash of red across the entire screen. There seems to be a paint of the whole screen every time we scroll, which is potentially very expensive. What we want to see is the browser just painting what is new to the page — so, typically just the bottom or top of the page as it gets scrolled into view. The cause of this issue seems to be the little “scroll to top” button in the lower-right corner. As the user scrolls, the fixed header at the top needs to be repainted, but so does the button. The way that Chrome deals with this is to create a union of the two areas that need to be repainted.
Chrome shows freshly painted areas with a red box. Larger view.
In this case, there is a rectangle from the top left to top right, but not very tall, plus a rectangle in the lower-right corner. This leaves us with a rectangle from the top left to bottom right, which is essentially the whole screen! If you inspect the button element in Developer Tools and either hide it (using the H key) or delete it and then scroll again, you will see that only the header area is repainted. The way to solve this particular problem is to move the scroll button to its own layer so that it doesn’t get unioned with the header. This essentially isolates the button so that it can be composited on top of the rest of the page. But we’ll talk about layers and compositing in more detail in a little bit.
The next thing we notice has to do with hovering. When we hover over a pin, Pinterest paints an action bar containing “Repin, comment and like” buttons — let’s call this the action bar. When we hover over a single pin, it paints not just the bar but also the elements underlying it. Painting should happen only on those elements that you expect to change visually.
A cause for concern: full-screen flashes of red indicate a lot of painting. Larger view.
There’s another interesting thing about scrolling here. Let’s keep our cursor hovered over this pin and start scrolling the page again.
Every time we scroll through a new row of images, this action bar gets painted on yet another pin, even though we don’t mean to hover over it. This comes down more to UX than anything else, but scrolling performance in this case might be more important than the hover effect during scrolling. Hovering amplifies jank during scrolling because the browser essentially pauses to go off and paint the effect (the same is true when we roll out of the element!). One option here is to use a setTimeout with a delay to ensure that the bar is painted only when the user really intends to use it, an approach we covered in “Avoiding Unnecessary Paints.” A more aggressive approach would be to measure the mouseenter or the mouse’s trajectory before enabling hover behaviors. While this measure might seem rather extreme, remember that we are trying to avoid unnecessary paints at all costs, especially when the user is scrolling.
Overall Paint Cost
We now have a really great workflow for looking at the overall cost of painting on a page; go back into Developer Tools and “Enable continuous page repainting.” This feature will constantly paint to your screen so that you can find out what elements have costly paint times. You’ll get this really nice black box in the top corner that summarizes paint times, with the minimum and maximum also displayed.
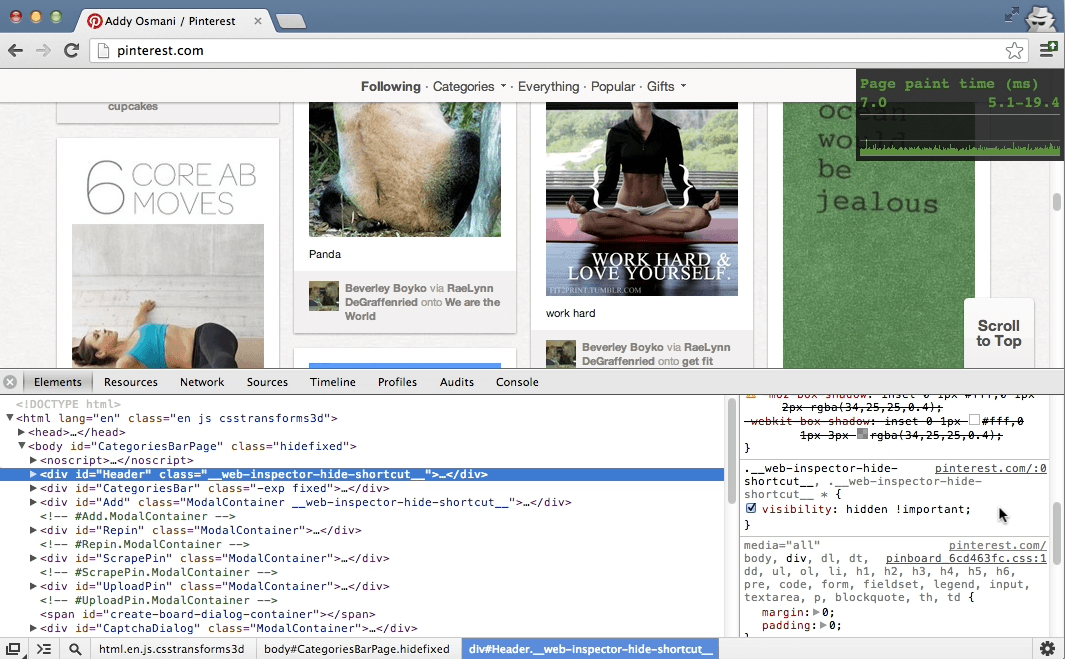
Chrome’s “Continuous Page Repainting” mode helps you to assess the overall cost of a page. Larger view.
Let’s head back to the “Elements” panel. Here, we can select a node and just use the keyboard to walk the DOM tree. If we suspect that an element has an expensive paint, we can use the H shortcut key (something recently added to Chrome) to toggle visibility on that element. Using the continuous paint box, we can instantly see whether this has a positive effect on our pages’ paint times. We should expect it to in many cases, because if we hide an element, we should expect a corresponding reduction in paint times. But by doing this, we might see one element that is especially expensive, which would bear further scrutiny!
The “Continuous Page Repainting” chart showing the time taken to paint the page.
For Pinterest’s website, we can do it to the categories bar or to the header, and, as you’d expect, because we don’t have to paint these elements at all, we see a drop in the time it takes to paint to the screen. If we want even more detailed insight, we can go right back to the timeline and record a new session to measure the impact. Isn’t that great? Now, while this workflow should work great for most pages, there might be times when it isn’t as useful. In Pinterest’s case, the pins are actually quite deeply nested in the page, making it hard for us to measure paint times in this workflow.
Luckily, we can still get some good mileage by selecting an element (such as a pin here), going to the “Styles” panel and looking at what CSS styles are being used. We can toggle properties on and off to see how they effect the paint times. This gives us much finer-grained insight into the paint profile of the page.
Here, we see that Pinterest is using box-shadow on these pins. We’ve optimized the performance of box-shadow in Chrome over the past two years, but in combination with other styles and when heavily used, it could cause a bottleneck, so it’s worth looking at.
Pinterest has reduced continuous paint mode times by 40% by moving box-shadow to a separate element that doesn’t have border-radius. The side effect is slightly fuzzy-looking corners; however, it is barely noticeable due to the color scheme and the low border-radius values.
Note: You can read more about this topic in “CSS Paint Times and Page Render Weight.”
Toggling styles to measure their effect on page-rendering weight. Larger view.
Let’s disable box-shadow to see whether it makes a difference. As you can see, it’s no longer visible on any of the pins. So, let’s go back to the timeline and record a new session in which we scroll the same way as we did before (up and down, up and down, up and down). We’re getting closer to 60 FPS now, and that’s just from one change.
Public service announcement: We’re absolutely not saying don’t use box-shadow — by all means, do! Just make sure that if you have a performance problem, measure correctly to find out what your own bottlenecks are. Always measure! Your website or application is unique, as will any performance bottleneck be. Browser internals change almost daily, so measuring is the smartest way to stay up to date on the changes, and Chrome’s Developer Tools makes this really easy to do.
Using Chrome Developer Tools to profile is the best way to track browser performance changes. Larger view.
Note: Eberhard Grather recently wrote a detailed post on “Profiling Long Paint Times With DevTools’ Continuous Painting Mode,” which you should spend some quality time with.
Another thing we noticed is that if you click on the “Repin” button, do you see the animated effect and the lightbox being painted? There’s a big red flash of repaint in the background. It’s not clear from the tooling if the paint is the white cover or some other affected being area. Be sure to double check that the paint rectangles correspond to the element or elements that you think are being repainted, and not just what it looks like. In this case, it looks like the whole screen is being repainted, but it could well be just the white cover, which might not be all that expensive. It’s nuanced; the important thing is to understand what you’re seeing and why.
Hardware Compositing (GPU Acceleration)
The last thing we’re going to look at on Pinterest is GPU acceleration. In the past, Web browsers have relied pretty heavily on the CPU to render pages. This involved two things: firstly, painting elements into a bunch of textures, called layers; and secondly, compositing all of those layers together to the final picture seen on screen.
Over the past few years, however, we’ve found that getting the GPU involved in the compositing process can lead to some significant speeding up. The premise is that, while the textures are still painted on the CPU, they can be uploaded to the GPU for compositing. Assuming that all we do on future frames is move elements around (using CSS transitions or animations) or change their opacity, we simply provide these changes to the GPU and it takes care of the rest. We essentially avoid having to give the GPU any new graphics; rather, we just ask it to move existing ones around. This is something that the GPU is exceptionally quick at doing, thus improving performance overall.
There is no guarantee that this hardware compositing will be available and enabled on a given platform, but if it is available the first time you use, say, a 3D transform on an element, then it will be enabled in Chrome. Many developers use the translateZ hack to do just that. The other side effect of using this hack is that the element in question will get its own layer, which may or may not be what you want. It can be very useful to effectively isolate an element so that it doesn’t affect others as and when it gets repainted. It’s worth remembering that the uploading of these textures from system memory to the video memory is not necessarily very quick. The more layers you have, the more textures need to be uploaded and the more layers that will need to be managed, so it’s best not to overdo it.
Note: Tom Wiltzius has written about the layer model in Chrome, which is a relevant read if you are interested in understanding how compositing works behind the scenes. Paul has also written a post about the translateZ hack and how to make sure you’re using it in the right ways.
Another great setting in Developer Tools that can help here is “Show composited layer borders.” This feature will give you insight into those DOM elements that are being manipulated at the GPU level.
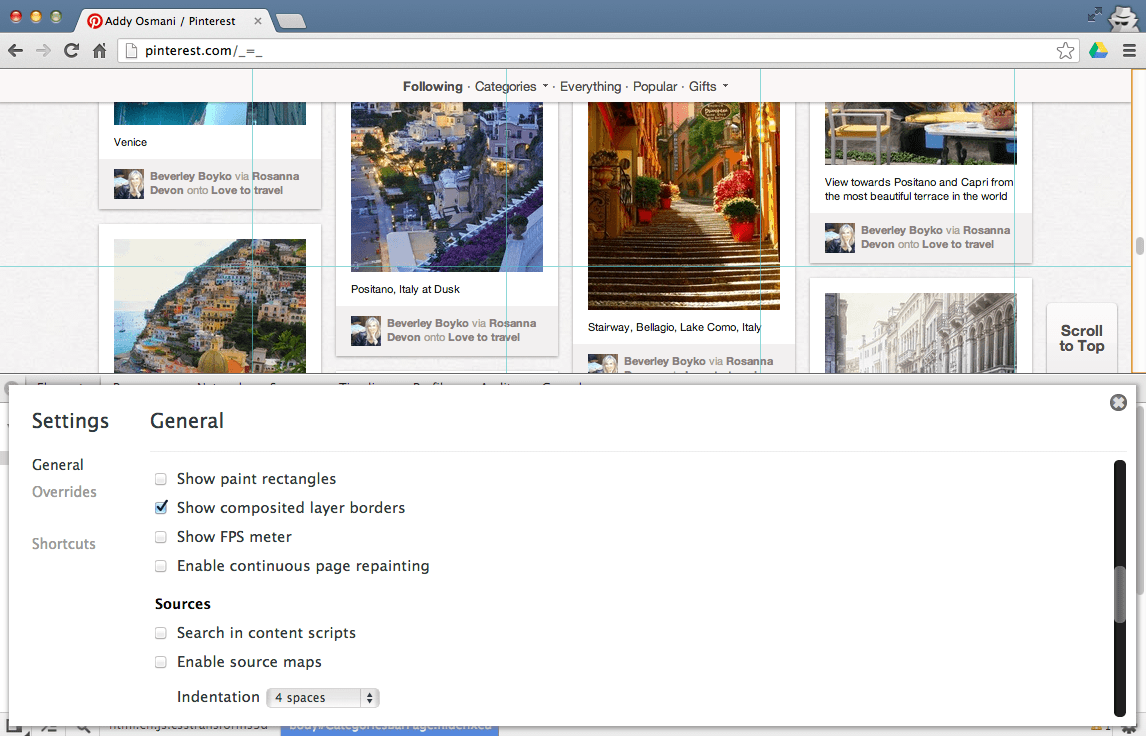
Switching on composited layer borders will indicate Chrome’s rendering layers. Larger view.
If an element is taking advantage of the GPU acceleration, you’ll see an orange border around it with this on. Now as we scroll through, we don’t really see any use of composited layers on this page — not when we click “Scroll to top” or otherwise.
Chrome is getting better at automatically handling layer promotion in the background; but, as mentioned, developers sometimes use the translateZ hack to create a composited layer. Below is Pinterest’s feed with translateZ(0) applied to all pins. It’s not hitting 60 FPS, but it is getting closer to a consistent 30 FPS on desktop, which is actually not bad.
Using the translateZ(0) hack on all Pinterest pins. Note the orange borders. Larger view.
Remember to test on both desktop and mobile, though; their performance characteristics vary wildly. Use the timeline in both, and watch your paint time chart in Continuous Paint mode to evaluate how fast you’re busting your budget.
Again, don’t use this hack on every element on the page — it might pass muster on desktop, but it won’t on mobile. The reason is that there is increased video memory usage and an increased layer management cost, both of which could have a negative impact on performance. Instead, use hardware compositing only to isolate elements where the paint cost is measurably high.
Note: In the WebKit nightlies, the Web Inspector now also gives you the reasons for layers being composited. To enable this, switch off the “Use WebKit Web Inspector” option and you’ll get the front end with this feature in there. Switch it on using the “Layers” button.
A Find-and-Fix Workflow
Now that we’ve concluded our Pinterest case study, what about the workflow for diagnosing and addressing your own paint problems?
Finding the Problem
- Make sure you’re in “Incognito” mode. Extensions and apps can skew the figures that are reported when profiling performance.
- Open the page and the Developer Tools.
- In the timeline, record and interact with your page.
- Check for frames that go over budget (i.e. over 60 FPS).
- If you’re close to budget, then you’re likely way over the budget on mobile.
- Check the cause of the jank. Long paint? CSS layout? JavaScript?
Spend some quality time with Frame mode in Chrome Developer Tools to understand your website’s runtime profile. Larger view.
Fixing the Problem
- Go to “Settings” and enable “Continuous Page Repainting.”
- In the “Elements” panel, hide anything non-essential using the hide (
H) shortcut. - Walk through the DOM tree, hiding elements and checking the FPS in the timeline.
- See which element(s) are causing long paints.
- Uncheck styles that could affect paint time, and track the FPS.
- Continue until you’ve located the elements and styles responsible for the slow-down.
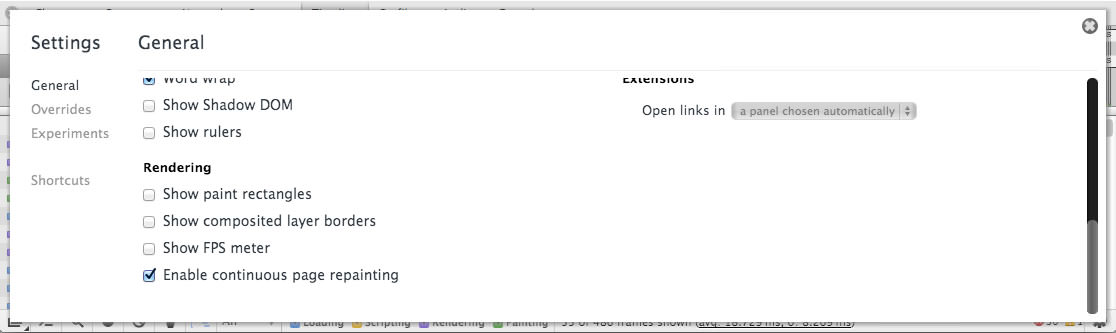
Switch on extra Developer Tools features for more insight. Larger view.
What About Other Browsers?
Although at the time of writing, Chrome has the best tools to profile paint performance, we strongly recommend testing and measuring your pages in other browsers to get a feel for what your own users might experience (where feasible). Performance can vary massively between them, and a performance smell in one browser might not be present in another.
As we said earlier, don’t guess it, test it! Measure for yourself, understand the abstractions, know your browser’s internals. In time, we hope that the cross- browser tooling for this area improves so that developers can get an accurate picture of rendering performance, regardless of the browser being used.
Conclusion
Performance is important. Not all machines are created equal, and the fast machines that developers work on might not have the performance problems encountered on the devices of real users. Frame rate in particular can have a big impact on engagement and, consequently, on a project’s success. Luckily, a lot of great tools out there can help with that.
Be sure to measure paint performance on both desktop and mobile. If all goes well, your users will end up with snappier, more silky-smooth experiences, regardless of the device they’re using.
Other Resources
- “Performance Profiling With the Timeline,” Chrome DevTools, Google Developers
- Let’s Make the Web Jank-Free (resources)
- ““Don’t Guess It, Test It!” (article and video), Paul Lewis
- “CSS Paint Times and Page Render Weight,” Colt McAnlis, HTML5 Rocks
- “Accelerated Rendering in Chrome,” Tom Wiltzius, HTML5 Rocks
- “Avoiding Unnecessary Paints,” Paul Lewis, HTML5 Rocks
- “Fluid User Interface With Hardware Acceleration” (slidedeck) Ariya Hidayat, W3Conf 2013
About The Authors
Addy Osmani and Paul Lewis are engineers on the Developer Relations team at Chrome, with a focus on tooling and rendering performance, respectively. When they’re not causing trouble, they have a passion for helping developers build snappy, fluid experiences on the Web.
Further Reading
- How To Make Your Websites Faster On Mobile Devices
- GPU Animation: Doing It Right
- What Is The Most Underrated Word In Web Design?
- Improving Smashing Magazine’s Performance: A Case Study
- Front-End Performance Checklist 2017


