Testing Mobile: Emulators, Simulators And Remote Debugging

Email Newsletter
Weekly tips on front-end & UX.
Trusted by 182,000+ folks.


 Celebrating 10 million developers
 Custom Web Forms for Angular, React, & Vue. Your backend.

In the early days of mobile, debugging was quite a challenge. Sure, you could get ahold of a device and perform a quick visual assessment, but what would you do after discovering a bug?
With a distinct lack of debugging tools, developers turned to a variety of hacks. In general, these hacks were an attempt to recreate a given issue in a desktop browser and then debug with Chrome Developer Tools or a similar desktop toolkit. For instance, a developer might shrink the size of the desktop browser’s window to test a responsive website or alter the user agent to spoof a particular mobile device.
To put it bluntly, these hacks don’t work. If you’re recreating issues on the desktop, then you can’t be certain that any of your fixes will work. This means you’ll be constantly bouncing back and forth between the mobile device and the hacks in your desktop browser.
Fast forward to today, when we have a robust suite of debugging tools that provide meaningful debugging information directly from a physical device. Best of all, you can use the same desktop debugging tools that you know and love, all on an actual mobile device.
In this article, we’ll explore a variety of emulators and simulators that you can use for quick and easy testing. Then, we’ll look at remote debugging tools, which enable you to connect a desktop computer to a mobile device and leverage a rich debugging interface.
Emulators And Simulators
Testing on real physical devices always pays off. But that doesn’t mean you shouldn’t also test on emulators and simulators. These virtual environments not only expand your testing coverage to more devices, but also are a quick and easy way to test small changes on the fly.
iOS Simulator
To test iOS devices, such as the iPhone and iPad, you have a number of options, most notably Apple’s official iOS Simulator. Included as part of Xcode, this simulator enables you to test across different software and hardware combinations, but only from a Mac.
First, install and open Xcode. Then, in Xcode, right-click and select “Show Package Contents.” Go to “Contents” → “Applications” → “iPhone Simulator.”
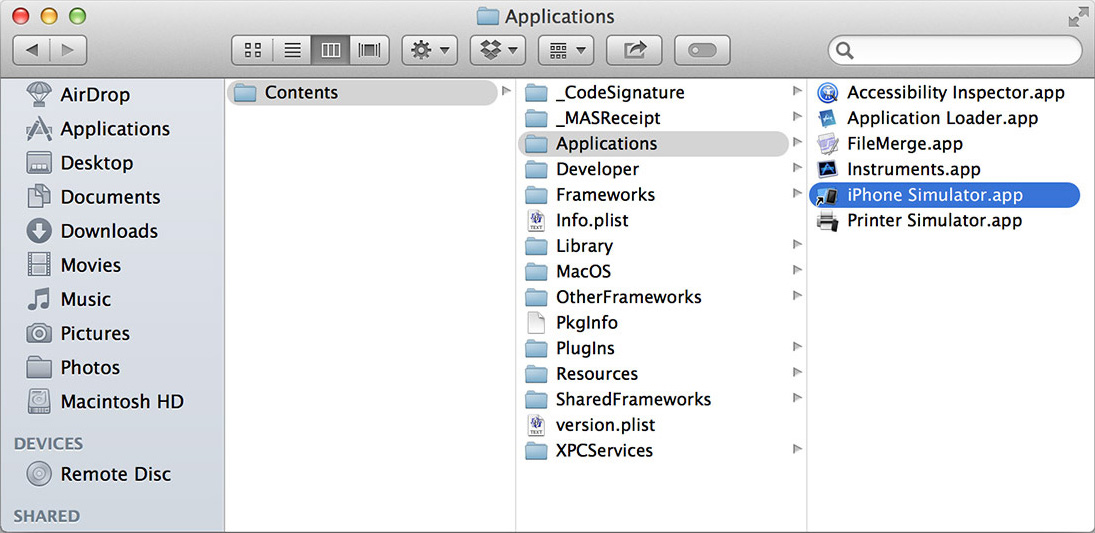
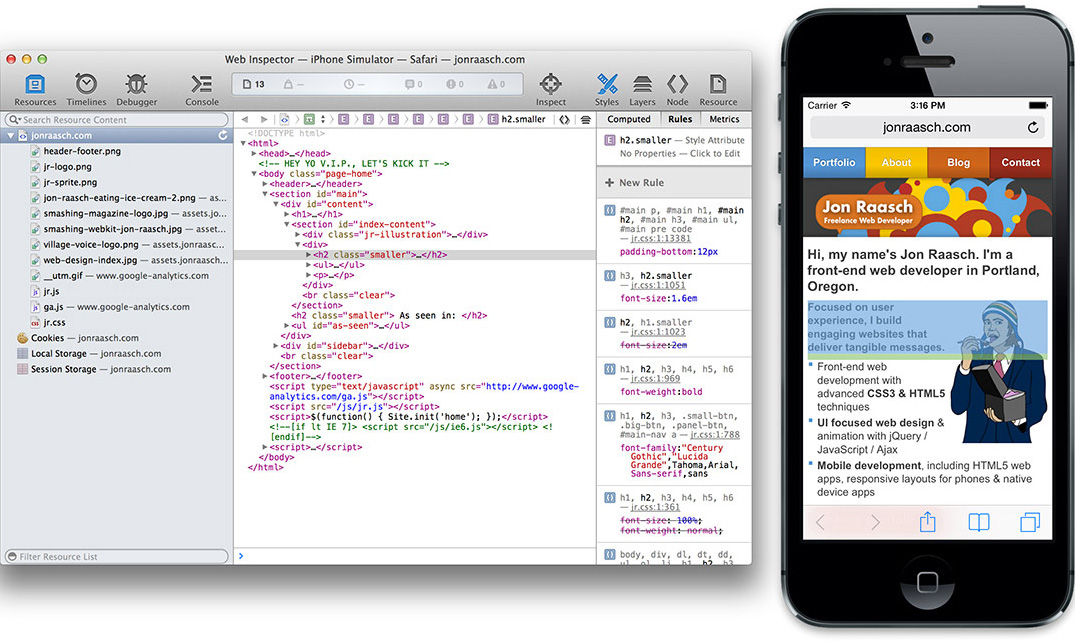
Although iOS Simulator is difficult to find, using it is fortunately easy. Simply open up Safari in the simulator and test your website. You can switch between different iPhone and iPad devices, change the iOS version, rotate the viewport and more.
Note: If you’re not working on a Mac, you’ll have to find another option. You could look to iPadian, a Windows-based iPad simulator. Beyond that, a handful of other simulators exist, including certain web-based offerings. But, to be honest, none of these are very promising.
Android Emulator
Android also provides an emulator. Luckily, this one is cross-platform. Unfortunately, setting it up is a bit of a pain.
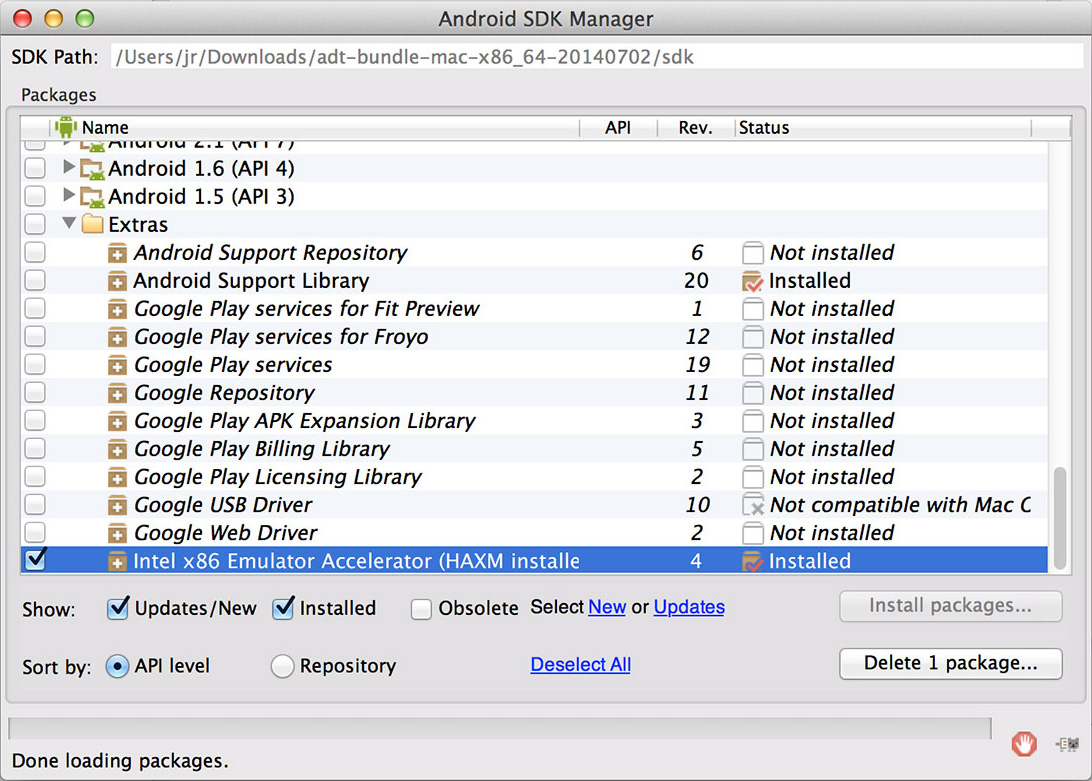
First, download the bundle that includes Android Development Tools (ADT) for Eclipse and the Android software development kit (SDK). Next, follow Google’s instructions to install the SDK packages, making sure to install the default selections as well as the “Intel x86 Emulator Accelerator (HAXM installer)”. You’ll also need to track down HAXM — search your Mac for IntelHaxm.dmg or your PC for IntelHaxm.exe, and run the file to install it.
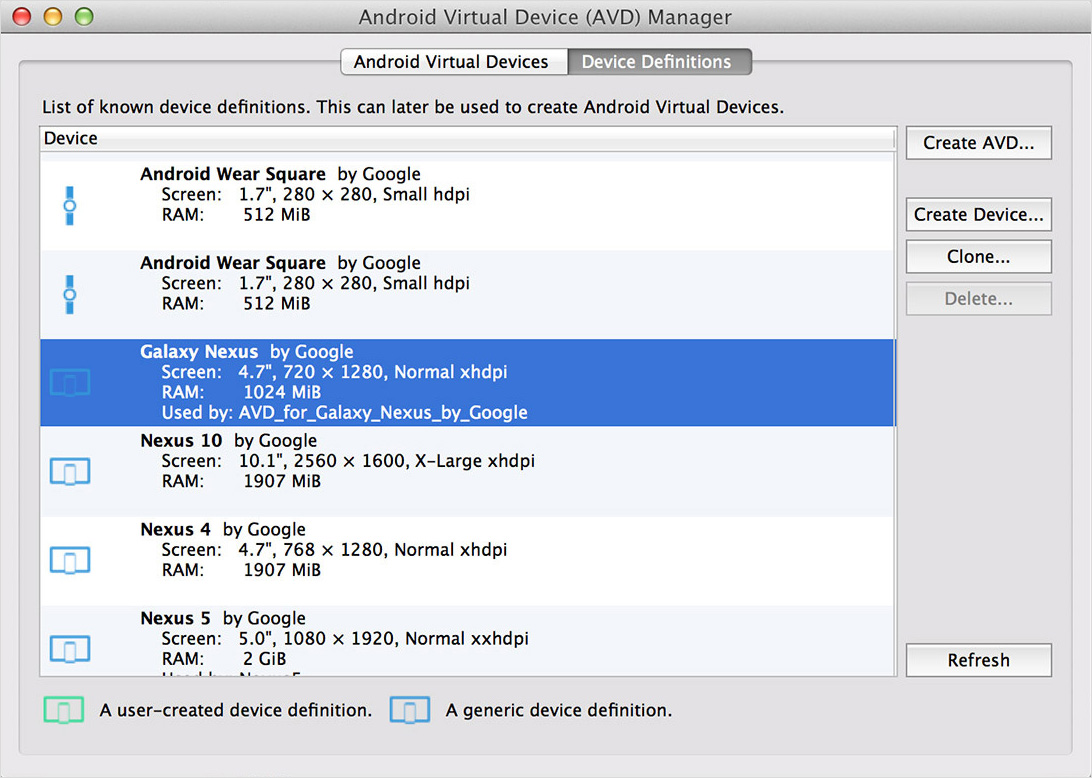
Next, create an Android virtual device (AVD) for whichever device you’re testing. If you go into the AVD manager, you’ll see a list of preset devices in “Device Definitions.” These cover a variety of Google products and some generic devices. To get started, select one of these presets and click “Create AVD.”
Set whatever you like for the CPU, and set “No skin“ and “Use host GPU.” Now you can run the virtual device and use Android’s browser to test your website.

Finally, you’ll probably want to learn some keyboard commands to better interact with the emulator.
Note: Manymo is an alternative, in-browser Android emulator. You can even embed it in a web page, which is pretty darn cool.
Other Simulators And Emulators
- BlackBerry Simulators
- Windows Phone Emulator for Windows 8
- Opera Mini Emulator
Remote Testing
Emulators and simulators are useful, but they’re not 100% accurate. Always test on as many real devices as possible.
That doesn’t mean you need to buy a hundred phones and tablets. You can take advantage of remote testing resources, which provide a web-based interface to interact with real physical devices. You’ll be able to interact with a phone remotely and view any changes in the screencast that is sent back to your machine.
If you want to test a Samsung device, such as the Galaxy S5, you can do so for free using Samsung’s Remote Test Lab, which enables you to test on a wide selection of Samsung devices.
Additionally, you can use the resources in Keynote Mobile Testing. They’re not cheap, but the number of devices offered is pretty astonishing, and you can test a handful of devices for free.
Note: If you’re looking to get your hands on real devices, Open Device Lab can point you to a lab in your area, where you can test on a range of devices for free.
Remote Debugging
Remote debugging addresses a variety of the challenges presented by mobile debugging. Namely, how do you get meaningful debugging information from a small and relatively underpowered device?
Remote debugging tools provide an interface to connect to a mobile device from a desktop computer. Doing this, you can debug for a mobile device using the development tools on a more powerful, easier-to-use desktop machine.
iOS
With the release of iOS 6.0, Apple introduced a tool that enables you to use desktop Safari’s Web Inspector to debug iOS devices.
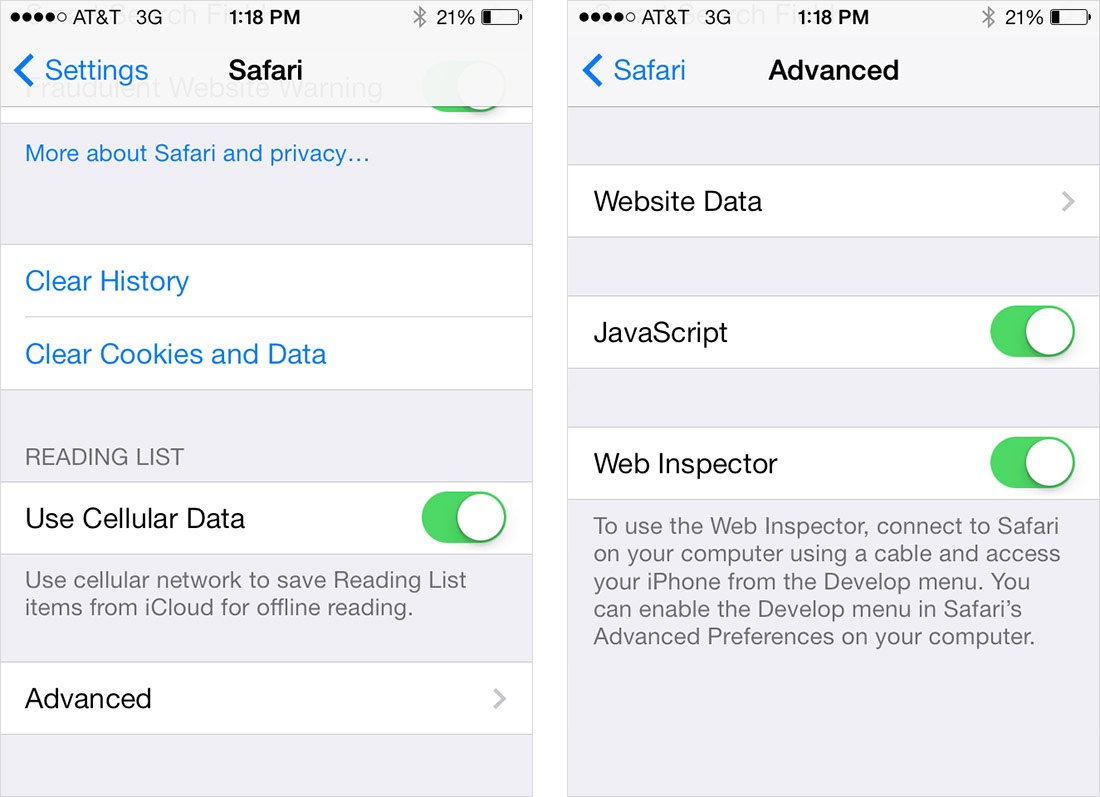
To get started, enable remote debugging on your iOS device by going to “Settings” → “Safari” → “Advanced” and enabling “Web Inspector.”
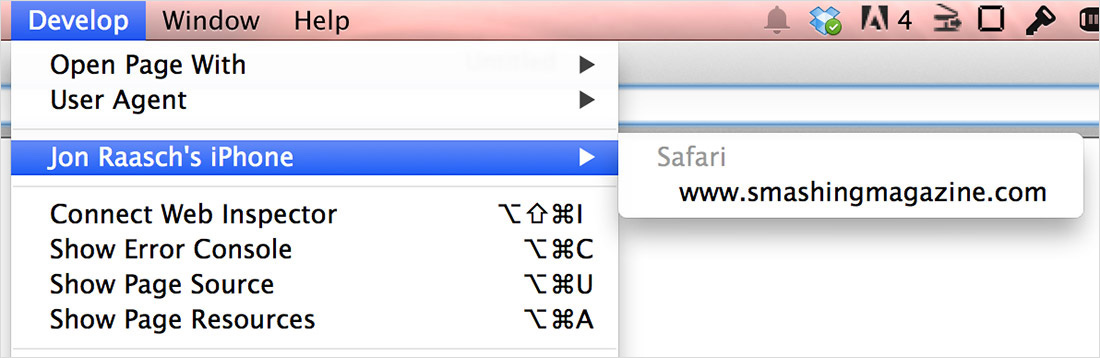
Next, physically connect your phone or tablet to your machine using a USB cable. Then, open Safari (version 6.0 or higher), and in “Preferences” → “Advanced,” select “Show Develop menu in menu bar.”
Now, in the “Develop” menu you should see your iOS device, along with any open pages in mobile Safari.
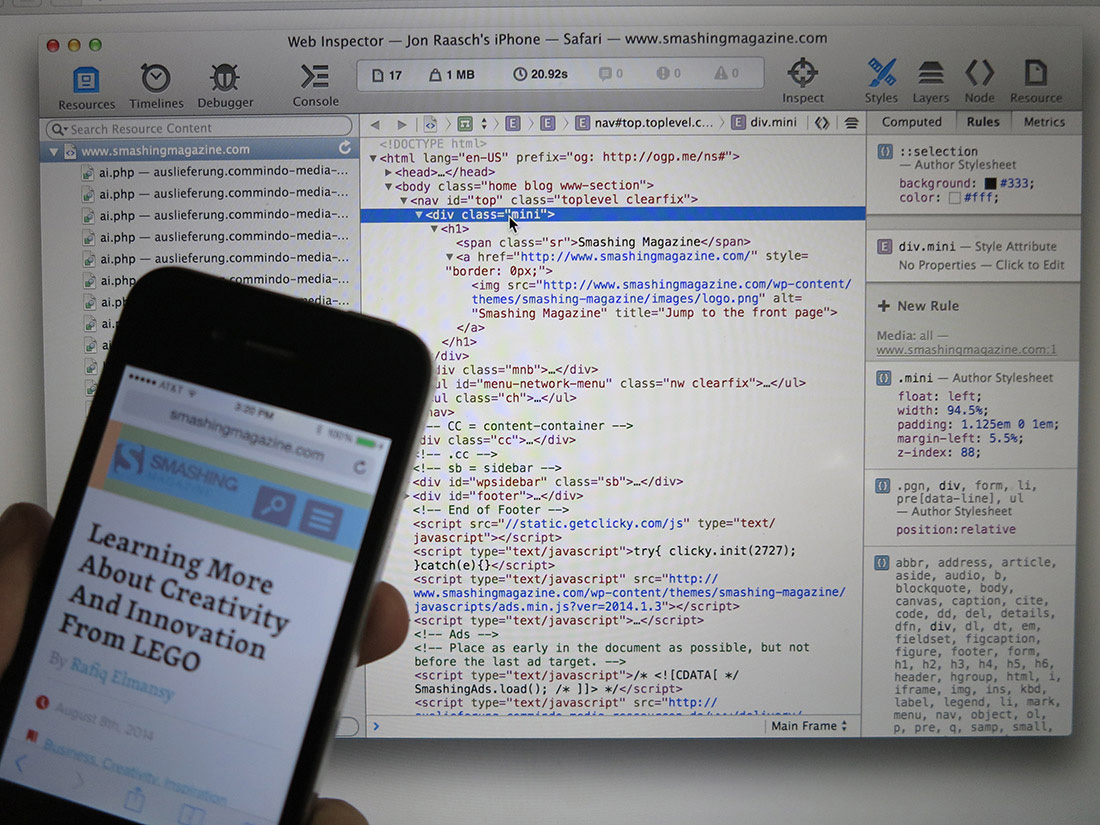
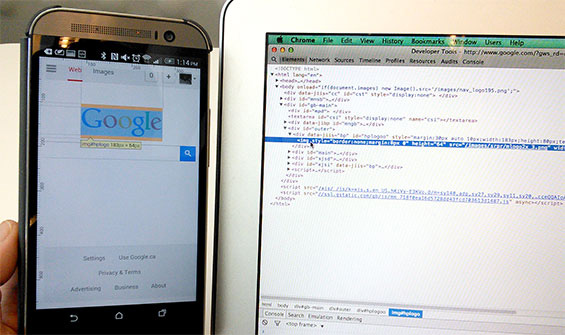
Select one of these pages, and you’ll have a wide range of developer tools at your fingertips. For example, try out the DOM Inspector, which enables you to tap DOM elements on your mobile device and see debugging information on the desktop.
The DOM Inspector is really just the beginning. iOS’ remote developer tools provide a ton of features, such as:
- timelines to track network requests, layout and rendering tasks and JavaScript;
- a debugger to set breakpoints and to profile the JavaScript;
- a JavaScript console.
To learn more about what you can do, read through the documents in the “Safari Web Inspector Guide.”
Note: Much like iOS Simulator, you can only do remote debugging for iOS on Mac OS X.
Android
Similar to iOS, Android has a remote debugging solution. The tools in it enable you to debug an Android device from a desktop machine using Chrome’s Developer Tools. Best of all, Android’s remote debugging is cross-platform.
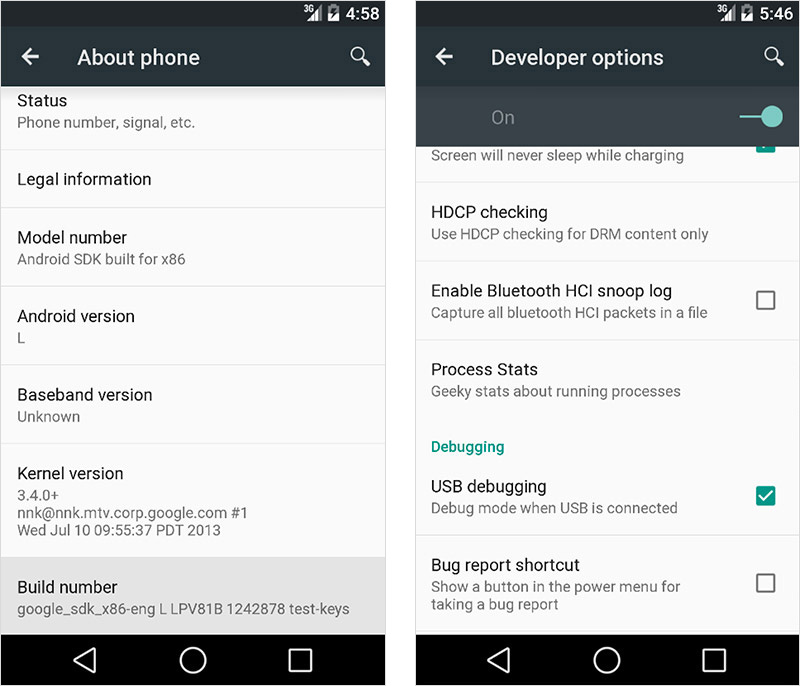
First, go to “Settings” → “About Phone” on your Android 4.4+ phone (or “Settings” → “About Tablet”). Next, tap the “Build Number” seven (7) times. (No, I’m not joking. You’ll see a message about being a developer at the end.) Now, go back to the main settings and into “Developer Options.” Here, enable “USB debugging,” and you’re all set.
Go into your desktop Chrome browser, and type about:inspect in the address bar. Enable “Discover USB devices,” and you’ll see your device in the menu.
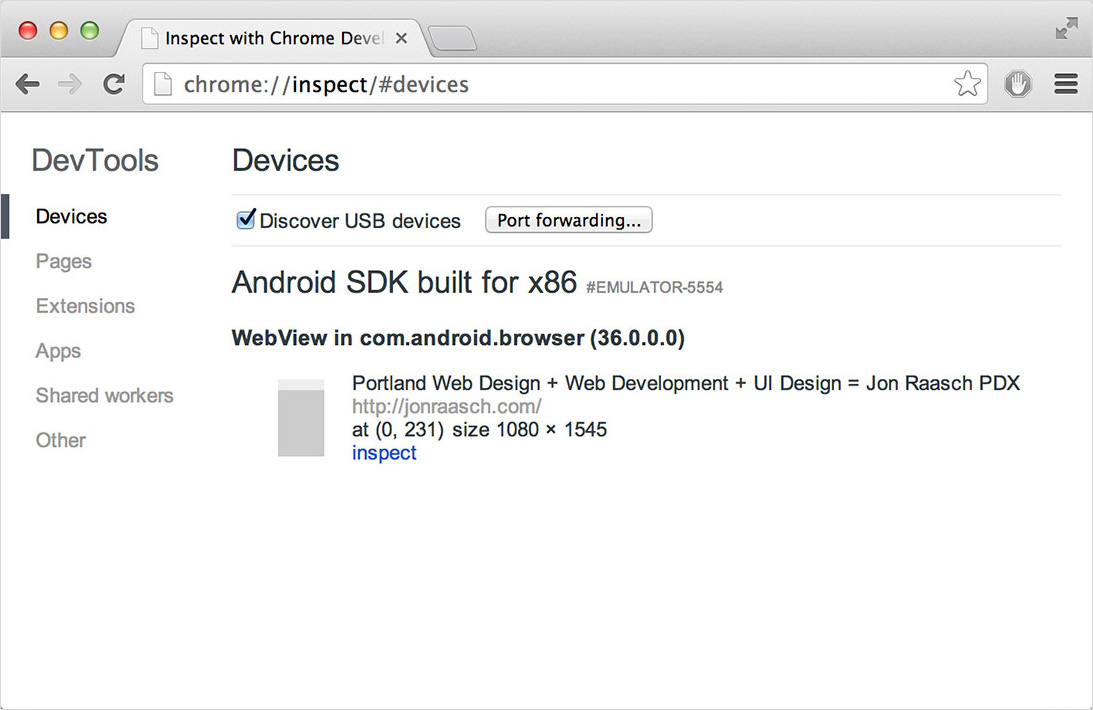
You should also see any open tabs in your mobile browser. Select whichever tab you want to debug, and you’ll be able to leverage a ton of useful tools, such as:
- a DOM Inspector,
- a network panel for external resources,
- a sources panel to watch JavaScript and to set breakpoints,
- a JavaScript console.
To learn more about what’s possible, read HTML5 Rocks’ tutorial “Introduction to Chrome Developer Tools, Part One.”
Note: You can also remotely debug with the Android emulator.
Weinre
You now know how to remotely debug a variety of devices. But if you want to debug iOS on Windows or on Linux or debug other devices, such as Windows Phone or BlackBerry, then try Weinre, which works on any device.
Setting up Weinre is a bit more complicated because you have to install it on both the server and the page. To get started, install Node, and then install the Weinre module with the following command:
npm install –g weinre
Next, run the debugging server using your development machine’s IP:
weinre --boundHost 10.0.0.1
Note: Make sure to insert your own IP in the command above. You can find your IP on a Mac using the command ipconfig getifaddr en0 and on Windows using ipconfig.
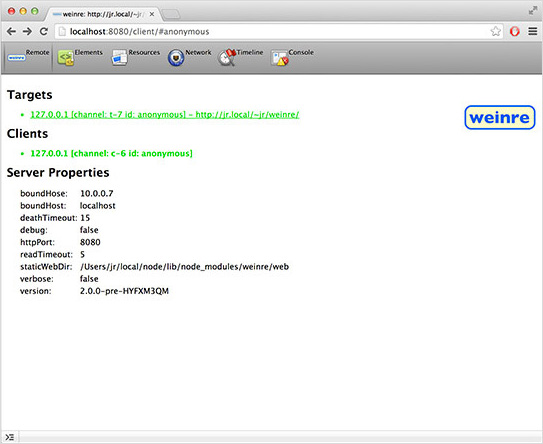
Next, go to the development server that is outputted by Weinre in the console (in my case, it’s localhost:8080). Here, look at the “Target Script” section, and grab the <script> tag. You’ll need to include that on whichever pages you want to debug.
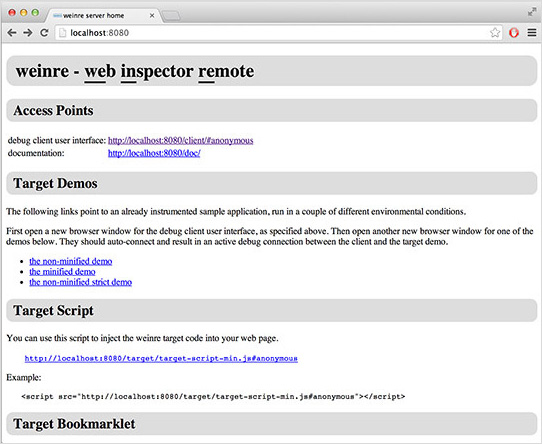
Finally, click on the link at the top of this page for the user interface for debugging clients (in my case, it’s https://localhost:8080/client/#anonymous). Now, once you open the page in your device, you should see it in the list of targets.
Note: If you’re having trouble connecting a device to your localhost, consider setting up a public tunnel with ngrok.
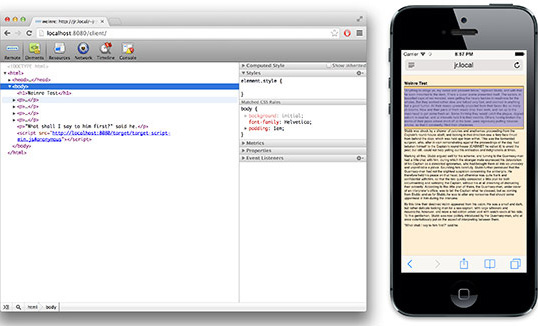
At this point, you can leverage a lot of WebKit Developer Tools to debug the page. You can use handy tools such as the DOM Inspector:
Once you get past the initial installation, Weinre lets you debug any device on any network. However, it’s not as powerful as the native solutions for iOS and Android. For example, you can’t use the “Sources” panel to debug JavaScript or take advantage of the profiler.
Note: Ghostlab is another remote testing option that supports multiple platforms.
Conclusion
In this article, we’ve learned how to set up a robust testing suite using a combination of physical devices, emulators, simulators and remote testing tools. With these tools, you are now able to test a mobile website or app across a wide variety of devices and platforms.
We’ve also explored remote debugging tools, which provide useful information directly from a mobile device. Hopefully, you now realize the benefits of remote debugging for mobile. Without it, we’re really just taking stabs in the dark.
Other Resources
- “Mobile Emulators and Simulators: The Ultimate Guide,” Maximiliano Firtman
- “Introduction to Chrome Developer Tools, Part One,” Seth Ladd, HTML5 Rocks
- “About Safari Web Inspector,” Safari Developer Library, Apple
- “Enable Remote Debugging With Safari Web Inspector in iOS 6,” Dave Ackerman, Modus Create
- “Remote Debugging on Android With Chrome,” Chrome Developer Tools
- “Weinre as Remote Debugger,”
Further Reading
- Prioritizing Devices: Testing And Responsive Web Design
- Where Are The World’s Best Open Device Labs?
- Establishing An Open Device Lab
- Testing The CLI The Way People Use It


