Taking A Closer Look At Tech Conferences: The Nitty Gritty Details (A Study)

Email Newsletter
Weekly tips on front-end & UX.
Trusted by 182,000+ folks.
 Celebrating 10 million developers
 Custom Web Forms for Angular, React, & Vue. Your backend.


As I was flying back from the Smashing Conference in New York, I wondered whether it was a success. This wasn’t an original thought. We are always wondering what makes a conference good and what elements will make industry workers stay away.
Good and bad are such subjective terms, though, with almost as many expectations as there are attendees. We decided that just looking at the numbers instead might be a good idea. This article will not present best practices for planning a conference, but rather will look at how it’s actually done most of the time.
While this is not a guide to putting together the perfect conference, it gives a good overview of what seems to work and which elements are so unpredictable that they do not serve as reliable guidelines.
The Aspects Considered
I analyzed the statistics of about 85 different conferences. I looked all over the world, looking at everything from big well-known events to small non-profit community meetings. I chose conferences that have been around for years and that have features that set them apart from other events.
Some of the data is straightforward, such as dates, number of speakers, tracks and workshops. Other aspects yielded much more varied and specific data (such as themes and technical considerations). So, I’ll present some fairly solid figures about some aspects, and convey just a sense of the variability of others. You can find the results in this PDF.
The Questions
- How many speakers were invited to the conference?
- How many days did the conference last?
- How many tracks were offered?
- How many workshops were linked to the conference?
- How long did individual sessions last?
- How long were the workshops?
- How much did the conference cost?
- How much did the workshops cost?
- How many people attended?
- What were the technical details? (Was there Wi-Fi? Were videos made available?)
- In which month did the conference take place?
- Was the theme a popular one?
- Which country hosted the conference?
- In what kind of venue did it take place?
- How high was the percentage of male/female speakers?
First, a few things regarding the statistics. I will compare both the average and the median, because the discrepancies are at times pronounced. The median lists all values of the data set and picks the middle value. It’s therefore not influenced by extreme values, and gives better information about the real data distribution. The average value is the sum of the sample data divided through the number of values. It’s influenced by extreme values and therefore gives only information about the data distribution in theory. The difference will become clear by directly comparing the figures.
Conference Size
Anyone who is interested in organizing a conference or just attending one will notice that conferences are run in two very different styles. This has a huge impact on scale (number of speakers, choice of tracks, length of conference).
Some conferences, such as TYPO3 Conference 2013, with its 65 speakers and multiple tracks, aim for large audiences and maximum information propagation. Others, such as the Smashing Conference, have only around 18 speakers and a single track and set out to create a community experience. Two styles, two different goals.
The data shows a clear tendency towards smaller conferences, most likely for the simple reason that organizing a big conference is much more costly and restrictive in some ways than a smaller one.
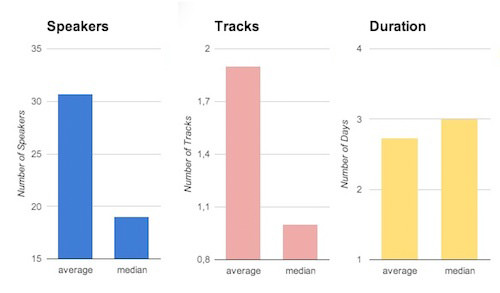
- Median number of speakers per conference: 19 This median indicates that more than half of the conferences analyzed were fairly compact community events.
- Average number of conference speakers: 31 This shows by how much the average is skewed by the few very large events when compared with the median.
- Median number of tracks: 1 This is a fairly logical progression from the median number of speakers. Small conferences tend to stick with single tracks.
- Average number of tracks: 1.9 This average implies that two tracks are the norm. While the difference between one and two tracks seems negligible, it is anything but. A single-track event demands fewer compromises than multi-track events from both attendees and organizers. Attendees don’t have to worry about overlapping topics, speakers and interests, while organizers can set up the event days exactly as they want. On the other hand, multi-track events give attendees much more flexibility and a wider range of networking opportunities.
- Median number of conference days (workshop days included): 3
- Average number of conference days (workshop days included): 2.7 Conferences rarely last longer than four days. The lower average reflects the lower number of conferences that are longer than the median.
Back To School
This indirectly brings us to the topic of workshops. Most events offer a certain number of workshops, usually around the conference days. Only 9% of conferences do not feature any workshops. Combining standard talks and workshops makes a great deal of sense for both organizers and attendees (and their employers!). The combination reduces yearly travel time to training events for attendees, and it spares employers’ pursestrings from the added travel expenses of repeated training excursions.
Conferences that do feature workshops around the event average five full-day workshops; the median, however, drops down to three full-day workshops. This number is not completely arbitrary. Organizers should plan according to the number of attendees expected, keeping in mind that not all of them will attend the workshops. It comes down to the desirability of the workshops, which is a difficult variable to accurately evaluate. The theme, speaker and geography come into play, in ways that are not always easy to discern.
Finally, not to be forgotten are two-hour half-day workshops and “lightning talks.” These are fairly popular, especially at big conferences. Some small conferences also prefer to feature a lot of half-day workshops, instead of highly visible full-day ones. Altogether, 13% of conferences feature short workshops, either next to the full-day ones or exclusively.
The Cost Of Learning
Evaluating conference and workshop prices is quite tricky because the spectrum is quite wide and is determined by different variables, including sponsorship deals and regional standards. A detailed analysis of the motivations behind setting a certain price for an event is beyond the scope of this article. Keep in mind that the numbers below are merely an approximation because I couldn’t find data for all of the conferences that I reviewed. Additionally, several conferences have a one-price-fits-all approach, including workshops in the conference price.
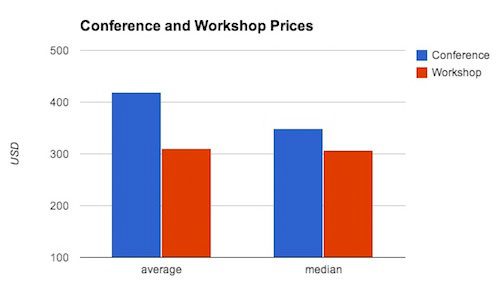
The average and median costs of workshops are very close, at $311 for the former and $307 for the latter (US dollars). This make perfect sense because the costs of workshops vary only according to the duration of the events. A few outliers are worth mentioning because of the regional considerations. Meta Refresh 2014 in India, for example, offers four half-day workshops at the relatively low price of $49 for both days. Reasons to be Creative in the UK comes to $399 per workshop, which is fairly standard for the UK.
Conferences are less predictable. The average and median are quite close, with the former at around $420 and the latter around $349. This, however, is a skewed representation of conference costs. For one, early-bird prices differ significantly from latecomer rates. Also, included in both figures are all conferences prices, without differentiating between one- and multi-day conferences.
Comparing the prices of conferences and workshops to those of other events in the same country might be more telling. This would give a good indication of whether the prices are reasonable.
We The People
Despite our figures here being very spotty, the average (840) and the median (500) number of attendees differ greatly. I would attribute this discrepancy to missing data. However, despite the spotty data, I suspect that the actual average is very close to the median that I calculated, simply because the majority of conferences reviewed here are small single-track events.
The Technical Side
There is insufficient data to make any definitive conclusions about the technical aspects of conferences. Still, several features seem to recur at almost every conference.
On the websites of the 84 conferences in this study, 14 specifically mention that they offer Wi-Fi access to attendees, and 32 promise to release videos of the talks and workshops on their website or on their YouTube or Vimeo channel.
Interestingly, despite many events offering Wi-Fi access, reliability is usually so difficult — or expensive — to guarantee that some conferences (such as Blend) state up front that Wi-Fi access is not provided, even going so far as to prohibit devices entirely. The rationale is that the presence of devices and the cost of Wi-Fi detracts from the quality and enjoyment of the talks; some hand out pen and notebooks instead. This approach does have some merit because it frees organizers to focus on curating their themes and speaker.
The Ephemera
Finally, let’s quickly look at some figures that are relevant but difficult to evaluate: conference themes, supporting events, location and gender. These factors are mostly determined according to either convenience or the subjective perspective of the organizers.
Themes
Themes are plentiful in this industry, ranging from UX design and development tools to marketing and commerce. This chart shows some of the most common themes, but keep in mind that these fluctuate as our industry rapidly evolves.
Events That Round Out The Conference Experience
These are a staple. For more than 50% of conferences, this means parties. And this is the one area where organizers can get as crazy and imaginative as their budget allows. You’ll find everything from mundane and marginally productive networking parties with drinks to enthusiastically creative affairs (such as Build’s). Some employers, the ones footing the bill, might find this to be over the top. A more psychological study might examine the value of associating pleasurable social experiences with work, but that is beyond the scope of this article.
After-parties are where — to paraphrase Pat Allen — organizers often make mistakes. From experience with organizing them, I know how important it is for the background music not to interfere with the conversations. Organizers should know that venues tend to get this wrong; many venues can’t seem to believe that large congregations of people don’t automatically want to “get down and boogie.” At the first Smashing Conference’s after-party, I found myself running to the DJ every half hour to ask him to turn down the volume, which would mysteriously and gradually return to the same deafening level. I insisted repeatedly that just because some of the attendees were swaying to the music while talking did not mean they were eager for a rave, but neither the venue’s manager nor the DJ seemed to grasp this.
While a few conferences focus mostly on the basic content, most offer additional experiences, most likely reflecting the idealism of their organizers. For many conference enthusiasts — including organizers — a key function of conferences is to unite the web design and development community. This is often reflected in the wording of promotional materials (“Let’s get together in the company of a few friends”).
Some discussion lately has focused on reevaluating these traditional events, such as after-parties, which some argue betray some insensitivity. For instance, alcohol is, to put it mildly, not everyone’s cup of tea. As Sara Soueidan explains in an interview for CSSconf EU, that is a reason why some attendees or speakers do not attend certain events. JSConf US 2014 provides bikes for people who want to explore the area, and it even offers a “Significant Other Track” for the families of attendees. There are definitely alternatives to the traditional approaches that generate a different ambience.
Locations
Below are some figures related to location.
- 52% of conferences are in Europe, 38% in the Americas, 6% in Asia, 3% in Australia and New Zealand. None are in Africa!
- 34% are set in the US, more than half in the east (see map).
- 18% take place in the UK.
- 14% are set in Germany.
- Just one is set in Southern Asia (India), and one (not on the list) in Southeast Asia (Philippines).
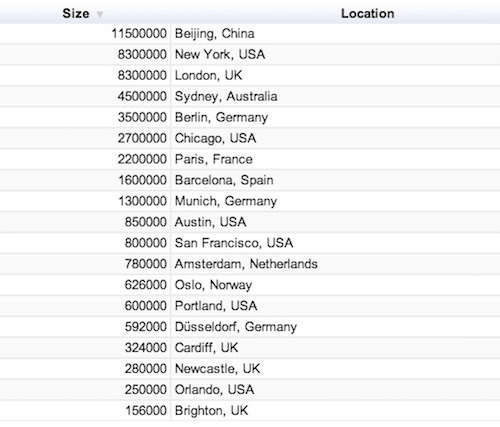
- The five biggest conference cities on the list also host the most conferences for their region.
- Among the five biggest cities are the three cities that host the most conferences (New York, London and Berlin).
- The fourth most-frequented city, however, is also one of the smallest on the list. With only 156,000 inhabitants, Brighton is only more populous than Faenza, Columbia and Osijek.
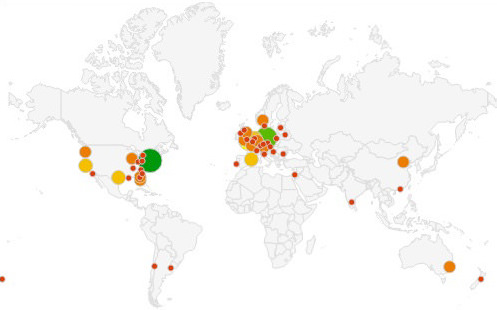
The US and EU are the two hottest spots for web conferences.
Gender
I’ll devote a short space to the statistics for the most debated topic of this study, gender. While a gender count among attendees has proven to be impractical, I was able to count — by hand! (never has a more repetitive endeavor been undertaken since Sisyphus’ boulder roll) — the number of male and female speakers at almost all conferences. I found that 22% of speakers were female. Or, to put in in hard numbers, the median number of speakers at the conferences was 19. Of those, 5 were women.
This subject has been heavily discussed in our community recently, with some of the biggest tech firms disclosing their gender-related statistics. According to John Mindiola in an article from 2010, 82.6% of web designers are male. However, while this is the current reality, the issue has reached popular awareness, leading some organizers to actively try to incorporate an equal number of male and female speakers. Such efforts are not only attributable to small conferences either, which can pick their speakers much more carefully; colossal events such as WebTech Conference 2013 and TYPO3 Conference 2013 are trying to even out the playing field, too (see study PDF).
Gender disparity in the web industry is not a myth. That being said, the percentage of women in content-generating areas is higher than that of men. And while the area of web development boasts a frighteningly antiquated male-dominated environment, many hope that conferences — being the public face of the industry — will lead by example.
Conclusion
To sum up (pardon the pun), the majority of conferences are small, with around 20 speakers. Most are single-track events, except for those that are 10-plus-track affairs. Many offer workshops to round out the experience. The events usually cost around $500 and offer a slew of fun activities to complement the learning experience, following the proud tradition of “work hard, play hard.”
The full range of the web industry’s work is covered, although the latest advances are getting the most attention, such as the mobile web. Most conferences take place in the EU, but the US hosts the most events of any single country. Finally, the web industry still needs to work on the male-female disparity, which is reflected in the ratio of female-to-male speakers at conferences.
Further Reading
- Upcoming Web Design Conferences
- Smashing Conferences and Workshops
- How To Transform Conference Takeaways Into Real-Life Results
- Taking A Closer Look At Tech Conferences
Front page image credits: Marc Thiele.


