Enabling Multiscreen Tracking With Google Analytics

Email Newsletter
Weekly tips on front-end & UX.
Trusted by 182,000+ folks.
 Celebrating 10 million developers


 Custom Web Forms for Angular, React, & Vue. Your backend.
We are increasingly using responsive design, responsive design with server-side components (RESS), adaptive design and combinations thereof to provide great high-performance multiscreen experiences. However, analytics implementations often miss information that is important to understanding how a website is being used on different devices.
For example, a website that varies the navigation layout based on screen size or user preferences might provide different user flows through the website depending on the layout being used. By enhancing Google Analytics, you’ll be able to identify and optimize under-performing layouts and screen sizes to improve performance on any device.
This article outlines common challenges and how to configure Google’s new Universal Analytics to efficiently overcome them, using features such as custom dimensions, enhanced link tracking and server-side data feeds. Information about the user’s layout preferences, the screen’s orientation, which link (of multiple) was used to arrive at a destination, and the physical size of the device’s screen can all be easily added. Universal Analytics enables data to be fed more efficiently from the web server, thus improving performance.
Common Challenges
Screen Size
Google Analytics categorizes devices as desktop, mobile or tablet. Information that is important to designers, such as physical screen size, is lost by such segmentation. Consider a web page that performs well on a modern 4.7-inch smartphone (such as the iPhone 6). Suppose a key message appears in the bottom quarter of the screen when displayed on such a device in portrait orientation. The same page on a 3.5-inch smartphone (such as the iPhone 4) would not show this key message without being scrolled down. The designer might not have been aware that this particular message is key to the success of the page. Different device-orientation preferences complicate the challenge further. Analytics tools provide the insight needed to drive continual understanding and improvement.

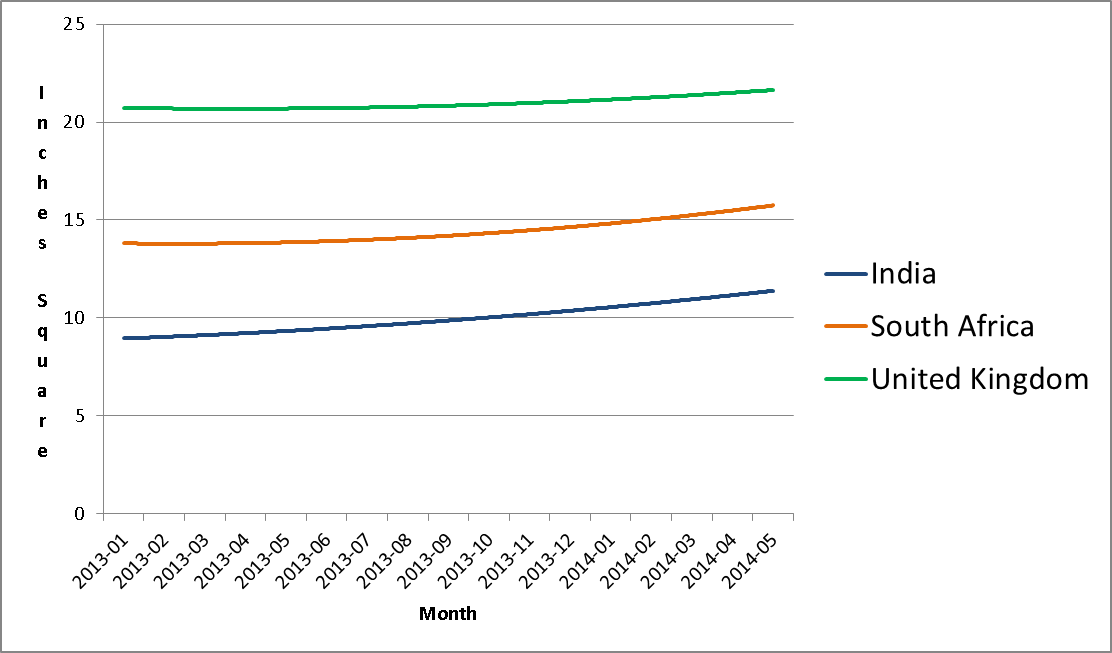
Screen sizes also vary significantly by country. This difference can have a profound effect on a website’s success. The following chart shows average screen sizes of mobile devices in square inches by country, as measured from real web traffic.
Layout
Layout is different from physical screen size, although layout is often driven by screen information measured in pixels and device orientation. Understanding the layout being used when analyzing website activity is essential to continual design improvement.
First, consider advertising. Experience shows that a single persistent advert across the top of the web page that remains permanently in view will perform well on a smartphone. On a tablet, skyscraper and banner adverts might work more effectively because a persistent advert is considered annoying.
A commercially minded website owner would want their analytics solution to be able to tell how different ads perform based on the layout and screen size, so that they can identify over- or under-performing configurations and increase their advertising revenue.
The main content is even more important. Information about the active layout for the page — whether determined by media queries or via the user’s preference for a desktop-, smartphone- or tablet-optimized layout — can improve understanding. Consider a page with five primary action rectangles, which are laid out horizontally on a desktop but appear vertically on a smartphone in portrait orientation. The fifth rectangle at the bottom of the list would be viewed less frequently on smartphones. Understanding the impact of this difference in position and viewing probability could lead you to experiment with different positioning for smartphones.
Performance
Modern websites tend to put greater demand on the client device’s processor. Google Analytics is an example of a tool with small overhead that does not directly enhance the user experience. Additional processing capacity and network resources are needed to execute its functionality, consuming precious battery life. With Universal Analytics, data can now be fed from the server, rather than via JavaScript running in the web browser.
Bring On Universal Analytics
In late 2013, Universal Analytics left beta, and it is now available for all websites. Google now recommends upgrading to Universal Analytics from Classic. Universal Analytics has several advantages:
- The JavaScript snippet and include are more sensitive, improving the quality of the information obtained.
- Interacting with and customizing the snippet is easier.
- More custom dimensions and metrics are available in the free version.
- Options other than JavaScript are available to feed activity information, including from the web server and from Android and iOS applications.
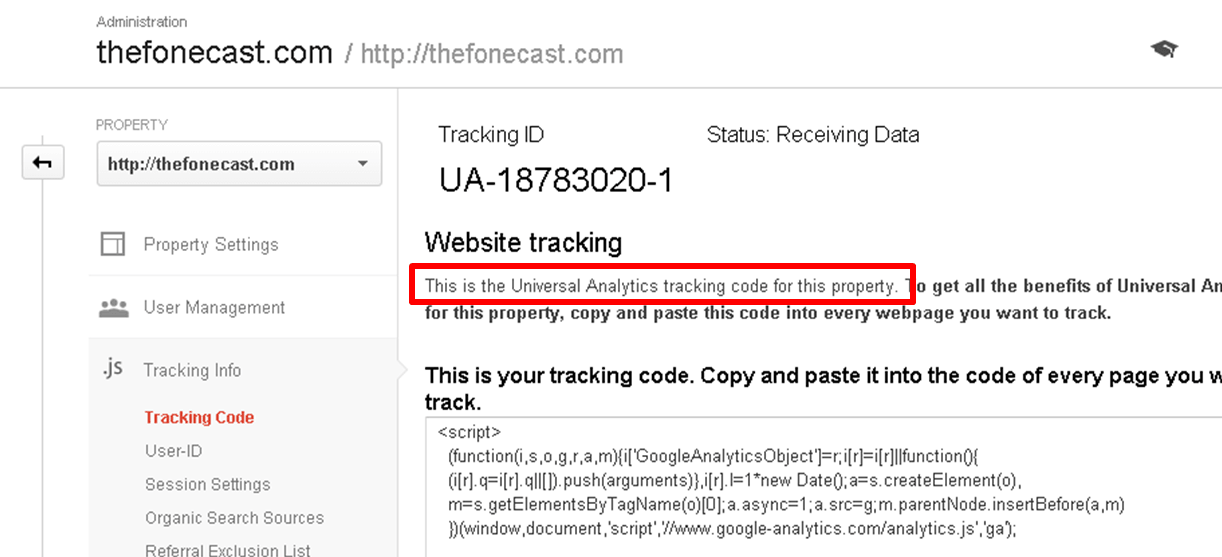
Upgrading to Universal from Classic is a two-step process. First, upgrade the web property via Google Analytics’ administration website. If the property is not already using Universal, then an option will appear under the “Admin” menu advising of the option. However, Google is so keen to upgrade websites that it might have already applied the change for you! If so, then the “Tracking code” page will start with, “This is the Universal Analytics tracking code for this property.”
The second part you’ll have to do yourself: changing the JavaScript snippet on your website. The JavaScript snippet must not be upgraded before the property has been changed to Universal Analytics in the previous step. The simplest implementation is this:
<script> (function(i,s,o,g,r,a,m){i['GoogleAnalyticsObject']=r;i[r]=i[r]||function(){ (i[r].q=i[r].q||[]).push(arguments)},i[r].l=1*new Date();a=s.createElement(o), m=s.getElementsByTagName(o)[0];a.async=1;a.src=g;m.parentNode.insertBefore(a,m) })(window,document,'script','//www.google-analytics.com/analytics.js','ga'); ga('create', '[TRACKING_ID]', 'auto'); ga('send', 'pageview'); </script>
You would replace [TRACKING_ID] with the unique tracking ID code for your web property.
Custom Dimensions
Once the upgrade to Universal is complete, you can add information to Google Analytics via “Custom Dimensions.”
Custom dimensions can be defined under the “Property” menu on the “Administration” screen. The following screenshot shows a property without any dimensions configured.
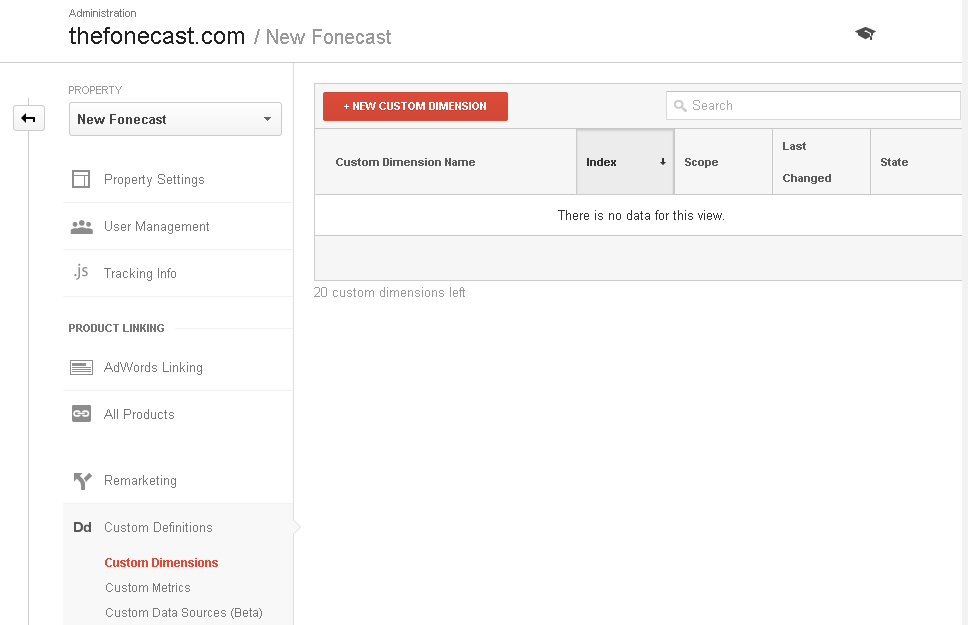
Up to 20 dimensions may be added to a property in the free version of Google Analytics, which is 15 more than in the Classic version. The paid version enables 200.
Device Orientation
Device orientation can easily be calculated in JavaScript by determining the height and width of the window. If the height is larger than the width, then the device is in portrait orientation. If not, then it’s in landscape orientation. The following JavaScript returns an orientation string using this logic:
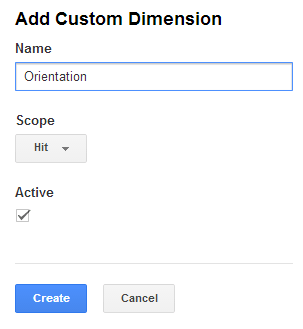
window.innerHeight > window.innerWidth ? 'Portrait' : 'Landscape'By creating a custom dimension and feeding its value from this JavaScript, we can easily add this information about the page request to Google Analytics. The following screenshot shows the simple dialog that is displayed when the “New Custom Dimension” button is pressed. Because the orientation of the device can change during a session, the new custom dimension is added for it, with a scope of “Hit.”
The “Orientation” dimension has been added, with an index starting at “1.” The following screenshot shows the new dimension and its index. At the time of writing, I’m unaware of a way to remove custom dimensions in the free version of Google Analytics, so plan ahead!

Feeding Custom Dimensions
Now that the dimension has been created for analysis, we need to populate it with data. This entails adding the JavaScript that returns the required data to Google Analytics’ data feed.
Setting an index of the dimension on the “Administration” screen that is the same as the dimension used in the code that sends data to Google Analytics is critical. In this case, the index is “1” and the key field, therefore, is dimension1. The following Google Analytics snippet has been enhanced to add the custom dimension data at an index of 1.
<script>

(function(i,s,o,g,r,a,m){i['GoogleAnalyticsObject']=r;i[r]=i[r]||function(){ (i[r].q=i[r].q||[]).push(arguments)},i[r].l=1*new Date();a=s.createElement(o), m=s.getElementsByTagName(o)[0];a.async=1;a.src=g;m.parentNode.insertBefore(a,m) })(window,document,'script','//www.google-analytics.com/analytics.js','ga');
ga('create', '[TRACKING_ID]', 'auto');
ga('set', 'dimension1', window.innerHeight > window.innerWidth ? 'Portrait' : 'Landscape');
ga('send', 'pageview');

</script>
New Field
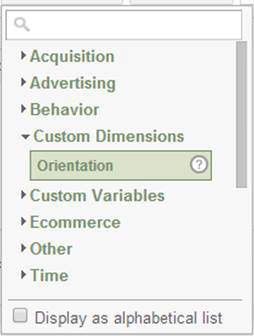
A new custom dimension, named “Orientation,” will now be available for analysis. It will appear in the list of available fields under the main heading “Custom Dimensions,” and it can be accessed from segment conditions, as a secondary dimension, and from any other areas of the Google Analytics reporting interface that lists fields.
Let It Settle
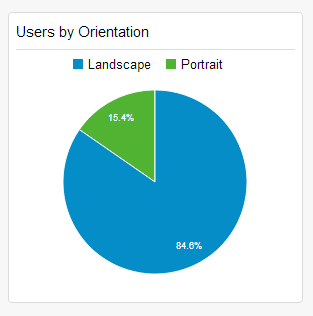
Patience is a virtue, and time is needed to validate the results of changes. The following screenshot shows the percentage of users by orientation over a one-month period.
Screen Size
Third-party data sources can also be used to feed custom dimensions. 51Degrees (the company I founded) can detect information about a screen’s physical size, returning the number of square inches or the diagonal length, rounded to the nearest integer value.
Once enabled, segments can be created based on physical screen size to compare different outcomes, answering questions such as:
- Does the bounce rate vary by physical screen size for particular pages?
- How is goal completion affected by physical screen size?
Unlike the orientation dimension, physical screen size does not change during a session, so it is added with the “Session” scope.
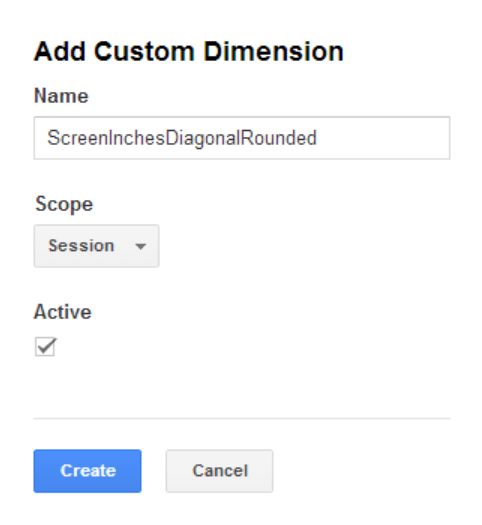
The “ScreenInchesDiagonalRounded” dimension has been added, with an index of “2.”
Now that the dimension has been created for analysis, we need to populate it with data. To make the examples in this article easy to follow, I’ve created a website that is configured to detect devices and provide the necessary JavaScript resources. The following snippet includes a resource that provides access to the “ScreenInchesDiagonalRounded” property.
<script src="https://js.51degrees.com/51Degrees.features.js?ScreenInchesDiagonalRounded" type="text/javascript"></script>With the snippet above added before the Google Analytics snippet, the “ScreenInchesDiagonalRounded” dimension (with an index of “2” in the list of custom dimensions) can be populated with the value returned by the “Fifty One Degrees features” include, exposed via the FODF object.
<script>

(function(i,s,o,g,r,a,m){i['GoogleAnalyticsObject']=r;i[r]=i[r]||function(){ (i[r].q=i[r].q||[]).push(arguments)},i[r].l=1*new Date();a=s.createElement(o), m=s.getElementsByTagName(o)[0];a.async=1;a.src=g;m.parentNode.insertBefore(a,m) })(window,document,'script','//www.google-analytics.com/analytics.js','ga');

ga('create', '[TRACKING_ID]', 'auto');
ga('set', 'dimension1', window.innerHeight > window.innerWidth ? 'Portrait' : 'Landscape');
ga('set', 'dimension2', FODF.ScreenInchesDiagonalRounded);
ga('send', 'pageview');

</script>
The highlighted additional line of code sets the second dimension to a value of FODF.ScreenInchesDiagonalRounded, which is the screen’s diagonal length in inches, rounded to the nearest integer.
Insight
The following screenshot shows the percentage of users by physical screen size, measured in inches and over a one-month period.
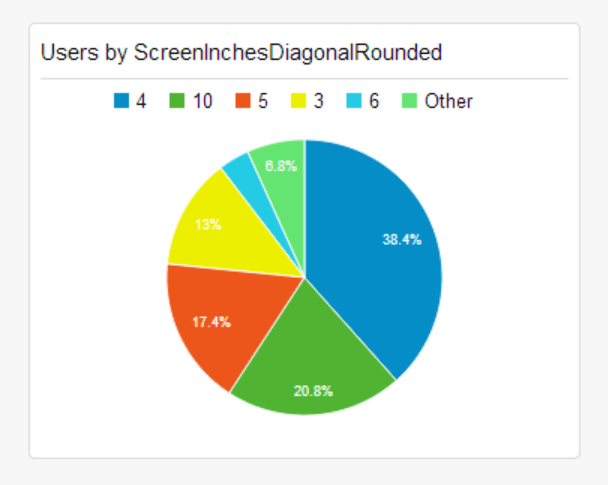
We can now clearly identify usage by 3-, 4-, 5- and 6-inch screens within what Google would classify as the “mobile” device type. We can also see that 10-inch screens dominate the “tablet” device type.
Performance Is King
Measurement should have no impact on the activity being observed. Website analysis performed client-side, as shown earlier, does have a small impact on performance, because the relevant JavaScript needs to be downloaded, parsed and then executed. In both cases,a request is sent to Google Analytics to provide the information associated with the hit or event. While this overhead isn’t noticeable on a fast high-bandwidth data connection, minimize it as much as possible for mobile.
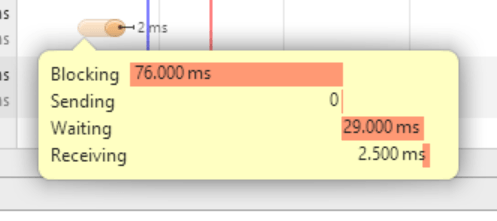
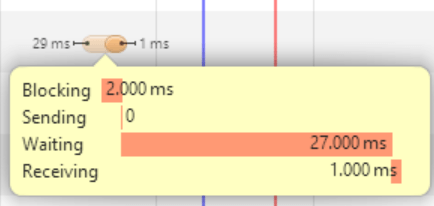
The network resource inspector in modern web browsers such as Chrome clearly shows the problem. The following screenshot shows the 51Degrees.features.js request from the earlier example. We see that 76 milliseconds are wasted while the browser waits to send the request for the resource.
Fortunately, this problem can be eliminated easily in several ways.
Asynchronous JavaScript
One approach is to load both the analytics.js file and the features script asynchronously. The onload event of the features script can be used to load the Google Analytics script and set the custom dimensions needed by Google. The following code snippet would replace those provided earlier, including the 51Degrees.features.js include.
<script type="text/javascript">

(function(d,t,s,a,p){ a = d.createElement(t); a.type = 'text/javascript'; a.async = true; a.src = s; p = d.getElementsByTagName(t)[0]; a.onload = function() { (function(i,s,o,g,r,a,m){i['GoogleAnalyticsObject']=r;i[r]=i[r]||function(){ (i[r].q=i[r].q||[]).push(arguments)},i[r].l=1*new Date();a=s.createElement(o), m=s.getElementsByTagName(o)[0];a.async=1;a.src=g;m.parentNode.insertBefore(a,m) })(window,document,'script','//www.google-analytics.com/analytics.js','ga');

ga('create', '[TRACKING_ID]', 'auto');
ga('set', 'dimension1', window.innerHeight > window.innerWidth ? 'Portrait' : 'Landscape');
ga('set', 'dimension2', FODF.ScreenInchesDiagonalRounded);
ga('send', 'pageview'); };
p.parentNode.insertBefore(a,p); })(document,'script','https://js.51degrees.com/51Degrees.features.js?ScreenInchesDiagonalRounded');

</script>
Using the network inspector, we can see the difference in the screenshot below.
For websites that use downstream caching to reduce the load on the server, this technique is a very efficient way to provide client-specific information to the browser.
Server-Side
The only way to eliminate the impact of processing and sending information from the client to Google Analytics is to perform this activity on the server. This technique only works when the web server can see all of the traffic and when the web pages are not publicly cached (although the content they contain could still be publicly cached or served from a content delivery network). As such, the technique cannot be used on all websites or all pages.
The Google Analytics code snippet makes a GET request that contains usage and tracking information in the query string. The network inspector reveals the output of Google Analytics’ JavaScript. We see a filter for requests to https://www.google-analytics.com/collect and a request similar to the following:
https://www.google-analytics.com/collect?v=1&_v=j23&a=123456789&t=pageview&_s=1&dl=https%3A%2F%2Fexample.com%2FPage&ul=en-us&de=UTF-8&dt=Page&sd=24-bit&sr=1280x720&vp=1263x622&je=1&fl=14.0%20r0&_u=eDCAgEQi~&jid=&cid=123456789.123456789&tid=UA-123456789-1&cd1=6&z=459486931Universal Analytics no longer requires that this information be sent from the web browser. It may be sent from anywhere, including the web server or a native application. Google refer to sending data in this way as the “measurement protocol.” Sending usage data from the server has the immediate benefit of reducing the amount of processing and the number of web connections taken up by the browser.
At least two HTTP requests are eliminated for each page request because Google’s analytics.js script does not need to load and the resulting request to /collect is also avoided. You could argue that another benefit is that the user can no longer avoid being tracked by turning off requests sent to Google Analytics. Of course, consider the non-technical implications of this, too — namely, as it relates to your terms and conditions and your privacy policy.
The following C# snippet could be added to a .NET web page to send most information to Google Analytics.
var parameters = new Dictionary<string, string>();

// Add the basic header parameters.
parameters.Add("v", "1");
parameters.Add("t", "pageview");
parameters.Add("tid", "INSERT TRACKING ID");
parameters.Add("z", Convert.ToBase64String(Guid.NewGuid().ToByteArray()));

// Add client information.
if (Request.Cookies[CLIENT_ID_COOKIE_NAME] != null)
{
// Cookie already exists so use that one.
parameters.Add("cid",
Request.Cookies[CLIENT_ID_COOKIE_NAME].Value);
}
else
{
// This is a new request so set the client ID.
var buffer = new List<byte>>();

// Use the IP address of the client as the first part of the CID.
IPAddress clientIP;
if (IPAddress.TryParse(Request.UserHostAddress, out clientIP)) buffer.AddRange(clientIP.GetAddressBytes());
else
buffer.AddRange(Encoding.ASCII.GetBytes(Request.UserHostAddress));

// Use the date as the second part.
buffer.AddRange(BitConverter.GetBytes((short)DateTime.UtcNow.Year));
buffer.AddRange(BitConverter.GetBytes((byte)DateTime.UtcNow.Month));
buffer.AddRange(BitConverter.GetBytes((byte)DateTime.UtcNow.Day));
buffer.AddRange(BitConverter.GetBytes((short)DateTime.UtcNow.TimeOfDay.TotalMinutes));

// Use a hash code of the user agent for the final part.
buffer.AddRange(BitConverter.GetBytes(Request.UserAgent.GetHashCode()));

var clientIdCookie = new HttpCookie(
CLIENT_ID_COOKIE_NAME,
Convert.ToBase64String(buffer.ToArray()));

clientIdCookie.HttpOnly = true;
clientIdCookie.Expires = DateTime.UtcNow.AddYears(2);
Response.Cookies.Add(clientIdCookie);
parameters.Add("cid", clientIdCookie.Value);
}
parameters.Add("uip", Request.UserHostAddress);

// If the session is new, indicate this to Google. if (Session != null &&
Session.IsNewSession)
{
parameters.Add("sc", "start");
}

// Add user agent and device information.
parameters.Add("ua", Request.UserAgent);
parameters.Add("je", Request.Browser.JavaScript ? "1" : "0");
if (Request.Browser.IsMobileDevice)
{
var screenSize = String.Format(
"{0}x{1}",
Request.Browser.ScreenPixelsWidth,
Request.Browser.ScreenPixelsHeight);
parameters.Add("sr", screenSize);
parameters.Add("vp", screenSize);
}

// Add language information.
if (Request.UserLanguages != null &&
Request.UserLanguages.Length > 0)
parameters.Add("ul", Request.UserLanguages[0]);

// Add page information.
Uri page;
if (Uri.TryCreate(Request.Url, Request.RawUrl, out page) == false)
page = Request.Url;
parameters.Add("dp", page.AbsolutePath);
if (String.IsNullOrEmpty(Page.Title) == false)
parameters.Add("dt", Page.Title);
parameters.Add("dh", page.Host);
parameters.Add("dl", page.ToString());
parameters.Add("de",
Response.ContentEncoding.WebName.ToUpperInvariant());

// Add referrer information.
if (Request.UrlReferrer != null)
parameters.Add("dr", Request.UrlReferrer.ToString());

// Add campaign parameters.
if (Request.QueryString["utm_campaign"] != null)
parameters.Add("cn", Request.QueryString["utm_campaign"]);
if (Request.QueryString["utm_content"] != null)
parameters.Add("cc", Request.QueryString["utm_content"]);
if (Request.QueryString["utm_term"] != null)
parameters.Add("ck", Request.QueryString["utm_term"]);
if (Request.QueryString["utm_medium"] != null)
parameters.Add("cm", Request.QueryString["utm_medium"]);
if (Request.QueryString["utm_source"] != null)
parameters.Add("cs", Request.QueryString["utm_term"]);

// Add user ID information, if known.
if (Page.User != null &&
String.IsNullOrEmpty(Page.User.Identity.Name) == false)
{
parameters.Add("uid", Page.User.Identity.Name);
}

// Finally, add our custom dimension!
parameters.Add("dimension2",
Request.Browser["ScreenInchesDiagonalRounded"]);

// Build the URL for Google.
var url = String.Concat(
"https://ssl.google-analytics.com/collect?",
String.Join("&", parameters.Select(p =>
String.Format("{0}={1}",
p.Key,
HttpUtility.UrlEncode(p.Value, Encoding.UTF8))).ToArray()));

// Send the request asynchronously.
var request = HttpWebRequest.Create(url);
request.CachePolicy = new
RequestCachePolicy(RequestCacheLevel.NoCacheNoStore);
request.Method = "GET";
request.Timeout = 20000;
request.BeginGetResponse(YourCallBackFunction, request);
That’s a lot of code because we need to do all of the things that the analytics.js snippet does client-side in JavaScript but on the server. At the time of writing, Google does not offer any official code for any platforms.
In the .NET snippet, a collection named parameters is populated with the key-value pairs that will form the query string (often called the “payload”) to be sent to Google Analytics. The following parameters are mandatory in every request:
vThis is the protocol’s version and will always be1.tidThis is the tracking ID, which is the same as the one used in the JavaScript earlier.cidThe client ID is used to anonymously identify a device, browser or user.tThis is the type of hit being recorded and will usually be a page view.
Also setting the dp parameter is a good idea because it identifies the page being viewed and is essential to any practical analysis. A full list of the measurement protocol’s parameters is available on Google.
The important line for adding custom dimensions is towards the end, where the dimension2 parameter is set. For this line to work, 51Degrees’ device-detection solution must be available on the server. In .NET, the simplest way to add the library is via NuGet. Using PHP device-detection, you can add 51Degrees’ library by unzipping the necessary files and including the scripts in the PHP page. Other languages are supported, including Java, Python, Perl and C.
Another modification to make is to check that the device that is requesting the page is not a crawler. Google Analytics does a reasonable job of removing crawler traffic, but we could help it by checking whether a device is a crawler, spider or bot and, if so, not sending any data.
Tracking Multiple Links
So far, we’ve explored techniques to track page views. Another useful feature in Google Analytics is the capability to track precisely which link is used to navigate to a destination, to track elements that could have more than one destination (such as a search button) or to track actions that are managed in JavaScript. Google calls this feature “enhanced link attribution.”
Consider a web page that contains three links to the same destination: one in the main navigation menu, one as part of a featured section and the last in the page’s footer. Knowing which of these three links was used to navigate to a destination could help you to improve the design of the page. When combined with data on screen size and (if relevant) the current layout, this information could improve our understanding of how users navigate the website.
Enhanced link tracking can be easily enabled in Universal Analytics via the “Property Settings” menu in the “In-Page Analytics” section, where a form similar to the following screenshot appears:
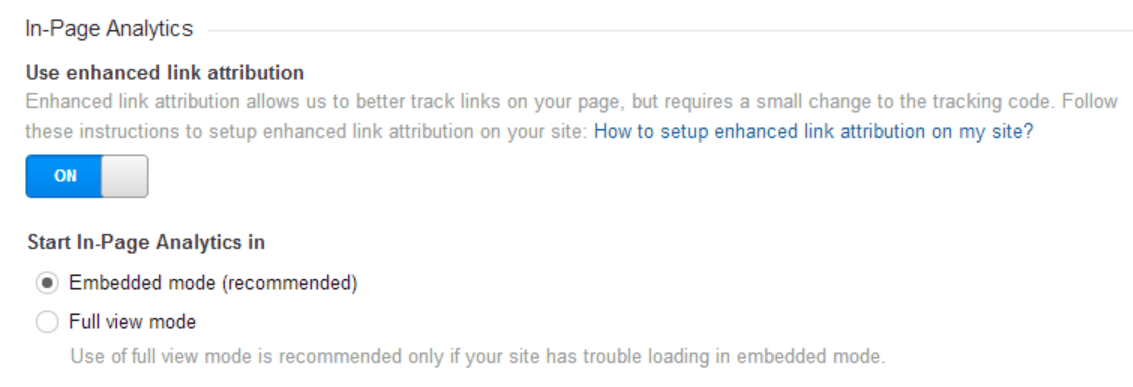
Simply turn the “Use enhanced link attribution” feature on, and add the following JavaScript line after the create parameter, which includes the tracking ID:
ga('require', 'linkid', 'linkid.js');Enhanced link attribution works best when every navigation element on the page has a unique ID attribute, like the one in the following line of code:
<a href='NewPage.html' id='NewPageLink1'>Goto another page</a>If the ID attribute isn’t present, then Google Analytics will try to identify the element based on the position of the element in the DOM. However, this is not as reliable.
Multiple Views
Google’s analytics.js script automatically tracks the size of the screen and the active viewport via JavaScript detection. You can use this information to analyze how responsive web pages perform at different breakpoints without additional modification.
For websites that enhance responsive design with RESS or adaptive techniques (varying the page’s content or navigation based on the user’s preference for a particular view type), then this information should be provided to Google Analytics for subsequent analysis. When this preference is a part of the page’s URL structure (for example, prefixing the domain name with an m. for the mobile-optimized section), then the information will automatically be made available to Google Analytics.
Different Techniques
The main problem with URLs that vary based on characteristics such as device type is that they don’t work very well when shared. For example, someone on a phone who wants to tweet the URL of an interesting page might share the m. version of the URL. Followers who open the link would be presented with the m. variant of the page, which will be suboptimal if they’re on a tablet or desktop.
A far better technique is to vary the response of a URL according to the device type and the user’s preference for a particular view. All of Microsoft’s new web technologies now favour model-view-controller (MVC) design. RESS and adaptive design are particularly easy to implement in MVC because the view is designed to be altered based on knowledge of the client device or user preferences, thus improving performance and the user experience. For example, someone on a 4.5-inch phone might prefer to pinch and zoom on the desktop interface of a website if they’re more familiar with it or if it contains more information.
By default, Google Analytics does not provide this insight. It categorizes devices as desktop, mobile or tablet only. When a page’s layout changes, an enhancement is needed to provide information associated with the active view.
The following screenshots are of the same URL, featuring a table that compares device-detection options. The layouts for small-screen devices and for big-screen web browsers are obviously different.
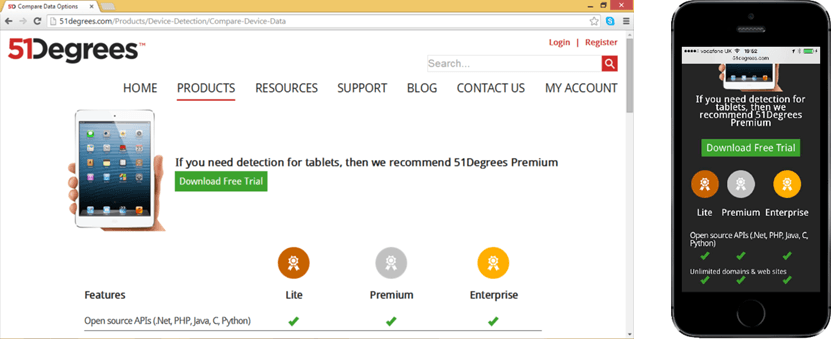
If the user has not expressed a preference for a view type, then the URL will default to serving content that is optimized for the device type. The user may change the view at any time should they not be happy with the default. They might prefer the big-screen version and be content to pinch and zoom around the page. We need to track this information in Google Analytics because it provides important insight into the viewing preferences of users.
Custom Dimensions
Custom dimensions can be used to record this information. The following screen shows a “ViewType” custom dimension being added, with a scope of “Hit.”
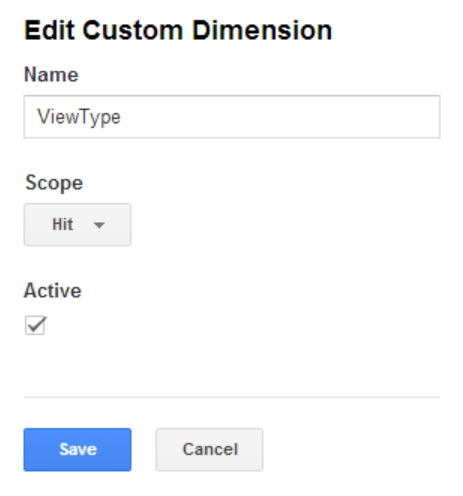
Assuming that “ViewType” is given an index of “3,” the following lines of JavaScript could be added to determine the active view based on the presence of different menu element IDs on the page.
var activeView = 'Desktop';
if (document.getElementById('mobileHeader') != undefined) { activeView = 'SmartPhone';
} else if (document.getElementById('tabletHeader') != undefined) { activeView = 'Tablet';
}
ga('set', 'dimension3', activeView);
Once sufficient information is stored in Google Analytics, the activity can be segmented by different view types. The following screenshot shows an example of such a report.
Two view type segments compared
Conclusion
It has been only three years since Ethan Marcotte published Response Web Design and web designers started thinking “mobile first.” The techniques used to analyze website activity haven’t kept pace with the different approaches to creating user interfaces. By tracking user preferences, combining complementary data sources and making simple configuration changes, we can narrow the gap. We can use server-side techniques to improve efficiency, and we can use hard facts to make design decisions, rather than our perception alone.
Universal Analytics is a powerful tool, and it is prepared for a world in which designers get a single report of all interactions, including for websites, native applications and real-world events (such as visits to a physical store or interactions with a call center). We’ve explored the possibilities a bit in this article. Here are some features to consider exploring further:
- See how users interact across multiple sessions. If unique and anonymous user IDs are available in your web application, then use the “User ID” feature of Google Analytics to track users across multiple sessions. Be aware that your privacy policy must allow for this and must adhere to Google’s requirements for anonymity.
- Track activity beyond the web. Integrate Google Analytics in native applications alongside websites for a complete view of digital user behavior.
- Track JavaScript events that don’t result in a full page refresh. Use events to track activity on a web page that does not result in a new page being loaded.
Whatever you do next, a bit of simple customization and configuration can make a big difference to the insights you get from Google Analytics. Happy analyzing!
Further Reading
- Is Your Responsive Design Working? Google Analytics Will Tell You
- A Guide To Google Analytics And Useful Tools
- Keep Your Analytics Data Safe And Clean
- How To Use Analytics To Build A Smarter Mobile Website


