Generating SVG With React

Email Newsletter
Weekly tips on front-end & UX.
Trusted by 182,000+ folks.


 Custom Web Forms for Angular, React, & Vue. Your backend.
 Celebrating 10 million developers

React is one of today’s most popular ways to create a component-based UI. It helps to organize an application into small, human-digestible chunks. With its “re-render the whole world” approach, you can avoid any complex internal interactions between small components, while your application continues to be blazingly fast due to the DOM-diffing that React does under the hood (i.e. updating only the parts of the DOM that need to be updated). But can we apply the same techniques to web graphics — SVG in particular? Yes!
I don’t know about you, but for me SVG code becomes messy pretty fast. Trying to grasp what’s wrong with a graph or visualization just by looking at SVG generator templates (or the SVG source itself) is often overwhelming, and attempts to maintain internal structure or separation of concerns are often complex and tedious.
Thanks to Facebook, we have React to do the work for us.
First, React works with the DOM (and the DOM is not only HTML). So, you can work with SVG exactly in the way you normally do with HTML. For example, here is a circle:
import React from 'react';

export default class App extends React.Component {
  render() {
    return (
      <svg>
        <circle cx={50} cy={50} r={10} fill="red" />
      </svg>
    )
  }
}
As I said, from React’s perspective, there is no difference between working with HTML or working with SVG (or, as you may heard lately, mobile views or canvas).
But let’s try to create something a little more complex, so that we can see how React helps to structure SVG in a human-understandable way.
Imagine we need to build a dashboard to visualize the most complex data set ever:
[
  [1, 3],
  [2, 5],
  [3, 2],
  [4, 16],
  [18, 5]
]
This is just an array of x and y coordinate pairs, nothing more.
I will use React Hot Boilerplate as a starting point to save time configuring our development essentials, including the following:
- webpack This very powerful module bundler will process and manage all dependencies for us.
- babel This code transpiler allows us to use ECMAScript 6 (ES6) in browsers that don’t yet support it.
- react-hot-loader This great tool will update our React components in the browser without reloading the whole page.
We will start by changing script/index.js to bootstrap our dashboard:
import React from 'react';
import ReactDOM from 'react-dom';
import App from './app';
import data from './data';

ReactDOM.render(<App data={data} />, document.getElementById('root'));
Here, script/data.js is just our data array that was mentioned previously:
export default [
   [1, 3],
   [2, 5],
   [3, 2],
   [4, 16],
   [18, 5]
 ];
Now, we will prepare our script/app.js to render our future graph:
import React from 'react';
import Graph from './components/graph';

export default class App extends React.Component {
  render() {
    return (
      <Graph data={this.props.data} />
    )
  }
}
This is the most interesting part: the opportunity to stop and think about what our graph consists of. This is one of the best processes when developing with React: We can think about high-level components first and split them into more granular ones later.
For example, scripts/components/graph.js:
import React from 'react';
import Axis from './axis';
import GraphBody from './graph_body';

export default class Graph extends React.Component {
  render() {
    return (
      <svg>
        <Axis
          length={width}
          horizontal={true}
        />
        <Axis
          length={height}
          horizontal={false}
        />
        <GraphBody
          data={this.props.data}
        />
      </svg>
    )
  }
}
Two axes and a graph body — looks logical to me. Of course, the code will not work. This is just an attempt to shape an initial API of our graph: We haven’t implemented child components yet, and we have some undefined variables such as width and height. Let’s finish this step by step.
We need to set some dimensions for our graph. We could hardcode them, but better to use defaultProps:
export default class Graph extends React.Component {
  static defaultProps = { width: 800, height: 600 };
Now, if we pass no width or height to the Graph component as props, then default values will be used.
We could transfer these values to the svg itself:
<svg width={this.props.width} height={this.props.height}>And then we could extend the declarations of the axes and graph body by giving them some initial positions:
import React from 'react';
import Axis from './axis';
import GraphBody from './graph_body';

export default class Graph extends React.Component {
  static defaultProps = { width: 800, height: 600 };

  render() {
    return (
      <svg width={this.props.width} height={this.props.height}>
        <Axis
          x={20}
          y={this.props.height - 100}
          length={this.props.width}
          horizontal={true}
        />
        <Axis
          x={20}
          y={0}
          length={this.props.height - 100}
          horizontal={false}
        />
        <GraphBody
          x={20}
          y={this.props.height - 100}
          data={this.props.data}
        />
      </svg>
    )
  }
}
Just look: We can read that like plain English. Anyone should be able to understand what is happening here. Now, when our parent component looks ready, it’s time to switch focus to the children.
Axes should just return lines, nothing complex there. According to the SVG specification, to create a line, we need to pass four coordinates: x1, y1, x2, y2. And keep in mind that axes may be vertical or horizontal and should respect the initial position passed through props:
Here is scripts/components/axis.js:
import React from 'react';

export default class Axis extends React.Component {
  prepareCords() {
    let coords = {
      x1: this.props.x,
      y1: this.props.y
    }

    if(this.props.horizontal) {
      coords.x2 = coords.x1 + this.props.length;
      coords.y2 = coords.y1;
    } else {
      coords.x2 = coords.x1;
      coords.y2 = coords.y1 + this.props.length;
    }

    return coords;
  }

  render() {
    let coords = this.prepareCords();
    return (
      <line {...coords} stroke="green" strokeWidth={2} />
    )
  }
}
Here, {…coords} is just a fancy new ES6 way to write x1={coords.x1} x2={coords.x2} y1={coords.y1} y2={coords.y2}. Thanks to Babel, we can use it without waiting for browsers to implement it.
Just to test that the axis works, let’s stub a graph body implementation:
import React from 'react';

export default class GraphBody extends React.Component {
  render() {
    return null;
  }
}
Returning null in this case will force React to render a noscript tag. We can achieve the same “empty” result by using return <g />, which will return an empty SVG group.
Groups in SVG are something like div elements in HTML, very useful when your component should return more than one node. By default, this will not work in JSX (only the last node will be returned), so we’ll wrap everything in a <g> element to avoid this.
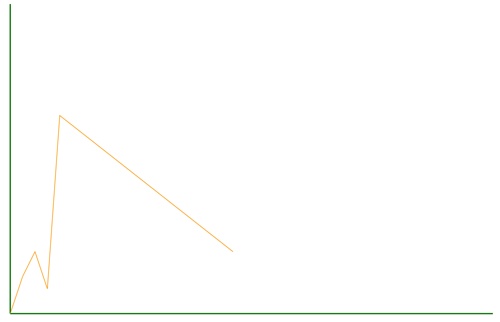
At this time in our browser, we should see two axes:

The next step is to remove the stub and create a fully functional graph body. To draw a graph line, we will use a path. This requires us to pass a specially crafted string as a d parameter. Crafting this string is easy; it consists of two parts: an initial Moveto command and a bunch of Lineto commands to draw the graph itself:
Moveto will be our starting point: M ${this.props.x} ${this.props.y}. This will move our brush to the initial coordinates. Then, we will connect each data point together with the L x y command.
However, we can’t pass x and y just as we get them from the data set. We need to sum them with a starting point for x and subtract from the starting point for y, because the y axis in SVG goes from top to bottom.
The resulting code looks like this:
import React from 'react';

export default class GraphBody extends React.Component {
  static defaultProps = { multiplier: 20 };

  prepareData() {
    let d = [`M ${this.props.x} ${this.props.y}`];

    let collector = this.props.data.map(chunk => {
      let xNext = this.props.x + chunk[0] * this.props.multiplier;
      let yNext = this.props.y - chunk[1] * this.props.multiplier;
      return `L ${xNext} ${yNext}`;
    });

    return d.concat(collector).join(' ');
  }

  render() {
    let d = this.prepareData();
    return(
      <path d={d}
        stroke="orange"
        strokeWidth={1}
        fill="none"
      />
    )
  }
}
I’ve also multiplied the coordinates by a constant just to make the graph prettier.
So, we’re ready to ship! But let’s say that just before that, our data changes. Suppose the data science department extends our data set by another array and asks us to create a way to switch data on the fly.
Our new data.js looks like this:
export default [
 [
   [1, 3],
   [2, 5],
   [3, 2],
   [4, 16],
   [18, 5]
 ],
 [
   [1, 16],
   [2, 23],
   [3, 5],
   [4, 3],
   [5, 1]
 ]
];
Adding support for multiple data sets is an easy task for us, thanks to React’s top-to-bottom data flow approach. We just need to change the data that we are passing to the Graph component dynamically; React will do the re-rendering for us.
So, the new index.js is this:
import React from 'react';
import ReactDOM from 'react-dom';
import App from './app';
import data from './data';

ReactDOM.render(<App datasets={data} />, document.getElementById('root'));
And here is scripts/app.js:
import React from 'react';
import Graph from './components/graph';

export default class App extends React.Component {
  render() {
    return (
      <Graph data={this.props.datasets[0]} /> # or this.props.datasets[1] just to check that everything is working
    )
  }
}
However, changing the data set in the code is not user-friendly at all (even if we have React Hot Load to magically update the page for us). So, let’s add an option to change the data set.
Here is scripts/app.js:
import React from 'react';
import Graph from './components/graph'

export default class App extends React.Component {
  state = { dataSetIndex: 0 }

  selectDataset(event) {
    this.setState({dataSetIndex: event.target.value});
  }

  render() {
    let options = this.props.datasets.map((_, index) => {
      return <option key={index} value={index}>Dataset {index + 1}</option>
    });

    return (
      <div>
        <select
          value={this.state.dataSetIndex}
          onChange={this.selectDataset.bind(this)} >
          {options}
        </select>
        <Graph data={this.props.datasets[this.state.dataSetIndex]} />
      </div>
    )
  }
}
Now our data miners are happy; they can play with data sets on the fly!
But tomorrow comes, and now they want to be able to download rendered graphs to work with offline. Previously, that would mean a lot of work, but React has no real DOM dependency, so you can render it on a server easily.
We start by creating a simple Express app that handles incoming requests for SVG graphs (svg_server.js):
require("babel-register");
var express = require('express');
var app = express();
var data = require('./scripts/data').default;
var svgRenderer = require('./scripts/svg_renderer').default;

app.get('/svg', function (req, res) {
  var svg = svgRenderer(data[0]);
  res.send(svg);
});

var server = app.listen(3000, function () {
  var host = server.address().address;
  var port = server.address().port;
  console.log('Example app listening at https://%s:%s', host, port);
});
As you can see, only three lines are really from our application:
var data = require('./scripts/data');
var svgRenderer = require('./scripts/svg_renderer');
var svg = svgRenderer(data[0]);
All of the other lines are just the Express boilerplate and hooks.
And scripts/svg_renderer.js will look a lot like our old version of the main App:
import React from 'react';
import ReactDOMServer from 'react-dom/server';
import Graph from './components/graph'

export default function(data) {
  return ReactDOMServer.renderToStaticMarkup(<Graph data={data}/>);
}
To test it, we would:
- run
node svg_server.js, - open
localhost:3000/svg, - and, to be fully sure, run
curl localhost:3000/svg, and receive.
<svg width="800" height="600"><line x1="20" y1="500" x2="820" y2="500" stroke="green" stroke-width="2"></line><line x1="20" y1="0" x2="20" y2="500" stroke="green" stroke-width="2"></line><path d="M 20 500 L 40 440 L 60 400 L 80 460 L 100 180 L 380 400" stroke="orange" stroke-width="1" fill="none"></path></svg>Server-side rendering!
Now, our data science department fully loves us and we can finally go home. If you missed anything, you can find the whole example in the repository.
I hope this tutorial shows you that, from React’s perspective, there is no difference at all in what to render. You can leverage all of the ideas that shape your HTML in SVG, and have small, understandable components that anyone can easily change without breaking any external dependencies.
But should you create your own graph systems from scratch? No, plenty of great solutions can be extended easily to work with React (and even completed integrations — react-d3, for example). My hope is that, in making this graph, you’ve come to understand how these integrations work under the hood.
A small warning before wrapping up. Keep in mind that React does not support all SVG elements right now (there are some limitations and missing pieces), but you’ll probably find that it has what you need for the most common scenarios. For the less common ones, React provides a way to set the innerHTML of an element via dangerouslySetInnerHTML, which can help you work around any missing SVG elements you might require. Also, looks like many of these issues will be fixed in the next React version.
Happy vectorizing!
Further Reading
- Server-Side Rendering With React, Node And Express
- Why You Should Consider React Native For Your Mobile App
- Rethinking Responsive SVG
- How To Scale React Applications
- A Glimpse Into The Future With React Native For Web


