Visual Studio Code Can Do That?

Email Newsletter
Weekly tips on front-end & UX.
Trusted by 182,000+ folks.

 Celebrating 10 million developers
 Custom Web Forms for Angular, React, & Vue. Your backend.


About two years ago, I begrudgingly opened Visual Studio Code (VS Code) for the first time. The only reason I even did so is that I was working on a TypeScript project (also quite begrudgingly) and I was tired of fighting with the editor and the compiler and all of the settings that I needed to make a TypeScript project work. Someone mentioned to me that TypeScript “just works” in VS Code and I was pleasantly surprised to find that they were right.
I expected that though. VS Code is from Microsoft, so it’s entirely expected that TypeScript would just work. What I did not expect was that virtually anything that I needed to do in VS Code “just worked” too. And I do mean anything. While this article focuses primarily on features for the web as well as JavaScript developers, VS Code has integrations with Go, Python, Java, and Ruby — just to name a few.
Over the next few months, I began to discover things in VS Code that I found remarkable. I made the official switch to VS Code, and I haven’t looked back since. Over the months I’ve been compiling a list of my favorite tips, tricks, and extensions for VS Code that might leave you with the same reaction that I had and continue to have: “VS Code can do that?!” 😲
From Web Apps To Desktop Apps
Did you know that you can add “desktop app developer” to your resumé with just a little more effort? All you need to do is look over some API documentation and create your first modern desktop app. Read a related article →
Interactive Playground
One of the best ways to learn the ins and outs of VS Code is by going through the Interactive Playground.
This is a special page that goes through common keyboard shortcuts and concepts like multiple cursors, split panes, and keyboard shortcuts. Each of the examples are interactive so that you can practice the tutorials right inside the tutorials themselves.
The Interactive Tutorial is right on the “Welcome” page when the editor is first opened:
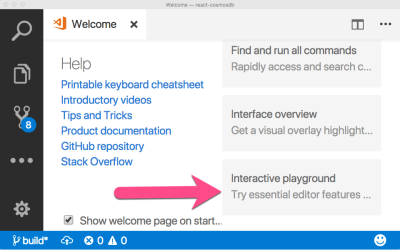
Many people (including myself) miss it entirely because it’s below the “fold” and towards the bottom of the page. Besides, who reads welcome screens?
Note: You can get back to the Interactive Tutorial at any time by opening the VS Code command palette Ctrl/Cmd + Shift + P and selecting “Interactive Playground.”
Now that you’ve mastered the basics, you’re going to need a font that is as beautiful as the code you are about to write. For that, look no further than FiraCode and Font Ligatures.
Font Ligatures
Font Ligatures are fonts that contain special characters which are used to represent symbols that consist of more than one character. We have a lot of these in programming. These would be characters like <=, >=, == and ===.
FiraCode is a lovely font ligature for VS Code. First, download the FiraCode font from GitHub and add it to your machine fonts. Then add the following lines to your User Preferences file Ctrl/Cmd + ,.
"editor.fontFamily": "Fira Code",
        "editor.fontLigatures": true
Try out a few of the special characters I listed above to see the difference. Font Ligatures show up in places you wouldn’t normally expect. Places like www and &&. Go ahead, give it a try and see what you discover!
Now that you have a nice font ligature and some delightful new symbols, it’s time to leverage that muscle memory that you’ve built up over the years in previous editors by installing a Keyboard Mapping.
Keyboard Mappings
Part of my hesitation in switching to VS Code was that I had invested some amount of frustration and effort to learn Sublime Text’s keyboard shortcuts. I was also a little bit proud of my keyboard prowess and not at all ready to give that up.
Fortunately, I didn’t have to.
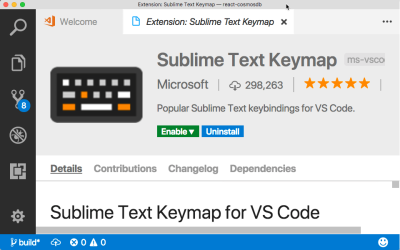
VS Code has something called Keymaps. These are extensions that map all of its shortcuts (well, almost all) to other editors. There are keymaps for all of the popular editors including Sublime, Atom, Emacs and even Eclipse!
To install a Keymap, open the extensions search bar by pressing Ctrl/Cmd + K → Ctrl/ Cmd + X. Then search for “keymap”.
I should note that I have since removed the Sublime Keymap. After enough use, I was able to re-wire my brain to go with VS Code shortcuts as they come out of the box. Think of the keymaps as training wheels: they are a good idea when you are just getting started, but at some point, you probably want to take them off.
Now if you’re like me, you have multiple computers, and you may edit in different places depending on the project and day. We’ve already made a bunch of changes to our VS Code setup, and we’re going to be making a bunch more. We don’t want to repeat this configuration everywhere we use VS Code. That’s where the Settings Sync extension comes in.
Settings Sync
With the Settings Sync extension, you can export all of your VS Code settings to a Gist, and then pull them all down from another VS Code installation and have them immediately applied.
This is also a good way to share your configuration with colleagues. Just send them the ID to your Gist, and they can synchronize all of your settings to their install. Some shops keep a central gist, and all new developers to the team can get the exact configuration with one simple command. That’s productivity!
And speaking of productivity, let’s get right into one of my favorite productivity tools for web developers: Emmet.
Emmet
Emmet is a popular expansion tool for markup and CSS that has been around for quite some time. However, I meet people almost every day who have either not heard of it, or they are new to development and are just learning about it. That’s ok! We’re all learning different things at different times.
Emmet is baked into VS Code, so there is no extra effort required to get it running. Simply start typing your Emmet syntax in an HTML or CSS file and let the editor do the rest. By default VS Code will even show you a preview of the upcoming Emmet expansion.

A neat trick to use with Emmet is to map a keyboard shortcut ( Ctrl/Cmd + K → Ctr/Cmd + S opens keyboard mappings) to the “Wrap Individual Lines With Abbreviation” command. This is akin to the old “Wrap Selection As Link” from Textmate, but with the added benefit of being able to wrap multiple lines at once with a more complex expansion.
Emmet can also be used in markdown, JSX and .vue files. To enable those, add the correct language mapping to your User Preferences file Ctrl/Cmd + ,.
"emmet.includeLanguages": {
        "javascript": "javascriptreact",
        "markdown": "html"
    },
In the case of JSX, Emmet is smart enough to use className instead of class inside the expansion.
Another neat feature of Emmet that was new to me is the ability for Emmet to automatically provide image width and height just by looking at the image file linked in the src. This works in HTML and CSS. It also works with both images hosted locally in the project and images on other URLs. To use this feature, put your cursor in your image tag, open the command palette Ctrl/Cmd + Shift + P and select “Update Image Size.” Magic! 🎩
For a deeper dive into what Emmet is and all of the different ways to use it in VS Code, check out this CSS Tricks article.
While Emmet takes care of productivity in markup and CSS, VS Code itself provides code completion in the form of intellisense; and it works in places that you might not expect.
Intellisense In JSON Files
Intellisense is a rather well-known editor feature but is primarily thought of only inside of code files. VS Code extends the classical definition of intellisense and adds it to JSON files as well. You will see this if you add any settings to your User Preferences file. VS Code provides intellisense for package.json files as well. What’s even more impressive is that it provides intellisense to npm packages inside of the package.json. Need a specific package and don’t remember the version? No problem! VS Code will look at npm and return the most recent version in the intellisense.
Some people have remarked that they don’t hand edit their package.json file. However, I find myself doing it from time to time for some odd reason or another, and having to look up the package version was always a giant pain for me. Now it’s just provided to me by VS Code. One less thing I have to guess at.
Even with Intellisense, this is JavaScript, so unless we’re super brave (or addicted to suffering), we’re going to need a linter. VS Code has great ESLint integration via the ESLint extension, but there are another options, and it involves type checking your untyped JavaScript.
Type Check Your JavaScript
Remember that great TypeScript integration I told you about earlier? One of the little-known tricks is that you can use the TypeScript compiler to check plain JavaScript files as well. You do this by adding a //@ts-check to the top of any JavaScript file, and you will immediately get TypeScript error checking on the file.
You wouldn’t want to add that line to each and every file, so you can use TypeScript to check every single JavaScript file in your project by adding the following line to your User Preferences file Ctrl/Cmd + ,.
"javascript.implicitProjectConfig.checkJs": true
If you want to control specific checking features of TypeScript, just drop a .tsconfig file in your project. When I say TypeScript “just works” in VS Code, I mean it works so well that it’s almost seamless to the developer.
Now that you have code linting and even type checking when you need it, it’s time to let VS Code handle those pesky formatting issues using Prettier.
Prettier
Prettier is a wonderful open-source code formatting tool. It is widely used by teams (and individuals) to make sure that coding styles are universal across projects and developers. It automatically reformats your code to match some defined standards, such as which column to wrap code on, how to format promises and whether to use single or double quotes.
Prettier is enabled in VS Code with the Prettier Extension. To install it, open the Extensions panel Ctrl/Cmd + K → Ctrl/Cmd + X and search for “prettier”.
Once installed, you will see Prettier in the taskbar for any file that Prettier knows how to format. You can invoke Prettier on the file by using the “Format Document” command: Alt/Option + Shift + F.
A neat trick here (and shown in the above video) is to set VS Code to auto-format on save. This will invoke Prettier whenever the file is saved. To get this functionality, add the following settings to your User Preferences file (Ctrl/Cmd).
"editor.formatOnSave": true
Prettier settings can also be tweaked from the User Preferences file. If you would like Prettier to use your ESLint config for settings, just specify the “eslintIntegration” setting.
"prettier.singleQuote": true,
    "prettier.eslintIntegration": true,
    "prettier.tabWidth": 2
Look at how pretty your code is now! Beautiful. You’ll never want to leave your editor again. Thanks to the terminal options in VS Code, you might not ever have to!
Terminal Access
You may have noticed from the video above that VS Code has an integrated terminal. You can launch it by pressing Ctrl + , . Multiple terminal sessions can be opened and will appear in the dropdown list at the top right of the terminal window.
I have had a hard time breaking my habit on the built-in terminal on Mac. You can open the external terminal at any time from VS Code in the exact location of the file you are currently viewing by using the keyboard shortcut Ctrl/Cmd + Shift + C.
Silly terminal tricks aside, one of the most important things that a developer can do to increase their productivity is to simply collaborate with other developers. We do this all the time. Some of us are lucky enough to sit next to each other. Some of us do it via Skype. No matter how you pair program, VS Code has just added a feature that is likely going to change the way you think about how you collaborate.
Live Share
VS Code Live Share was just announced this past week at Microsoft Connect. It allows multiple developers to pair on a project instantly. It’s not necessary to check code into a repo or fire up a screen sharing tool. Other developers can load up your project in their editor immediately and see your cursor in real time without having to configure anything on their end.
This also works for debugging. If you start a debug session, the other person gets the same full debug experience right inside of their editor. They can even control the debug process by stepping in, out and over the code. If the other person changes your code, it changes in your editor as well. This is really hard to wrap your head around until you see it in action. I highly recommend watching this short demo. I’m still not sure how we’ve made it this long as developers without a feature like this.
At the time of this writing, VS Code Live share is in preview, but will likely be generally available by the time you read this. In fact, you might already be using it!
Now that your co-workers have successfully fixed all your bugs (hooray for collaboration!), it’s time to check all of it into GitHub. One of my favorite features of VS Code is that the Git integration is so good, that even I can use Github.
Git Integration
I also have a hard time with Git on the terminal because it is a black box. You’re flying blind outside of your editor with only your terminal skills and knowledge of the Git CLI to get you through. That may be enough of some folks, but I have come to rely heavily on the visual Git integration that is provided with VS Code.
VS Code automatically picks up any Git configuration in your project. There is an entire tab dedicated just to Git options. Out of the box, VS Code supports adding, committing and pushing, branching, stashing and popping, amongst a host of other options. When viewing files in the Git tab, you get a side-by-side comparison between the original and the diff. You can also now view diff’s directly inline in a code file and can even revert from there as well.
So far we’ve focused heavily on text editing itself, but VS Code is remarkably suited to some much heavier lifting; the kind of things that we normally expect from an Integrated Development Environment (IDE), not a text editor. Here are some of my favorites.
Zero Configuration Node.js Run And Debug
VS Code will run and attach a debugger to any JavaScript code without any extensions or configuration whatsoever. Simply press the F5 key and select “Node” from the dropdown list. You can also switch to the debug tab Ctrl/Cmd + Shift + D and click the green arrow button up top. This will launch your application and attach the debugger providing a full-featured debug experience.
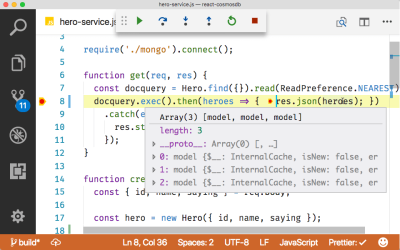
Column Breakpoints
VS Code also supports inline or column breakpoints. This is when you set a breakpoint in the middle of a line of code. This is particularly useful for debugging promise chains, and any other places where you multiple functions on one line.
Just right-click during a debug session and choose “Add Column Breakpoint.”
Build, Run, Debug and Deploy Docker
Microsoft provides a Docker extension for VS Code that will allow you to perform virtually all of your Docker actions in VS Code. In fact, VS Code will automatically create the requisite Docker files for your project (as best it can) based on which runtime you pick and your project structure. For straightforward Node.js apps, this means a zero-configuration Docker setup.
In this example, I take an Express application and use VS Code to create all of the Docker and Docker compose files. VS Code also creates the proper debug configuration so after I run the image I can attach the VS Code debugger and everything simply works. The extension also enables publishing of your image to either Docker Hub or Azure Container Registry.
Compound Launch Configurations
While build tools such as Webpack have entirely changed the way we build applications, they have also introduced new development challenges that didn’t exist before. Webpack uses its own in-memory development server to provide “hot reloads,” but when you move to production, Webpack is out of the equation, and your server takes over.
Basically, it’s now necessary to run as two separate projects in development and one project in production. This means that we typically debug front-end applications in the browser with the Chrome DevTools and the server portion in our text editor.
VS Code has the ability to launch multiple processes and attach debuggers to both of them from a single launch command. This means that it’s possible to debug front-end JavaScript code and server-side Node.js code right from within VS Code.
This is called a “Compound Launch Configuration.” In the video above, I use the following code to debug an application that uses Express/Cosmos DB for the backend and React for the front end.
{
        "compounds": [
            {
                "name": "Launch Browser/Server",
                "configurations": ["Launch Browser", "Launch Server"]
            }
        ],
        "configurations": [
            {
                "type": "chrome",
                "request": "launch",
                "name": "Launch Browser",
                "url": "https://localhost:3000",
                "webRoot": "${workspaceRoot}/src"
            },
            {
                "type": "node",
                "request": "launch",
                "name": "Launch Server",
                "program": "${workspaceRoot}/server/server.js"
            }
        ]
    }
Note that this requires the Chrome Debugger Extension to be installed. MongoDB Administration
MongoDB Administration
VS Code can help you visually administer and query any MongoDB or Cosmos DB database (local or remote) using the Cosmos DB Extension.
The Cosmos DB extension will connect to any existing Cosmos DB instances in Azure, but it will also connect to any MongoDB instance that is accessible with a mongodb:// URL.
You can create and drop databases and collections in the sidebar, as well as create and work with MongoDB Scrapbooks to test your queries. VS Code provides full intellisense to collections and the MongoDB API in Mongo Scrapbooks. You can even change the result of your query in the results pane and the changes will be persisted back to the database.
Deploying Apps
Another neat extension for VS Code is the Azure AppService extension. If you want to deploy your apps to the cloud, you can do that without ever leaving the editor.
Microsoft provides an extension called AppService Tools for VS Code that will let you create new sites, manage existing ones and deploy your code either with a right-click or a pre-built shell script which automates the process of checking your code into the right Git endpoint to setup continuous delivery.
Yes, VS Code Can Do That
By now you have probably caught on to the theme that there is really nothing that VS Code cannot do. If you want a certain piece of functionality, it’s highly likely that either the editor already supports it (we didn’t even touch on the Git integration) or someone has created an extension for whatever your specific use case might be. Even if that’s turning Markdown into Reveal.js presentations!
Additional Resources
- “VS Code Insiders Build,” Visual Studio Code, Microsoft
- “VS Code Awesome List,” Valerii Iatsko, GitHub
- “VS Code Tips And Tricks,” Valerii Iatsko, GitHub


