Taking A Look At The State Of Progressive Images And User Perception

Email Newsletter
Weekly tips on front-end & UX.
Trusted by 182,000+ folks.

 Custom Web Forms for Angular, React, & Vue. Your backend.
 Celebrating 10 million developers

“Progressive Images” is a hot topic these days. We often come across articles explaining techniques on how to avoid showing an empty space where an image will load. Medium and Facebook are examples of websites and mobile apps that apply this pattern.
I recently wrote about different ways to use SVG as placeholders, and this year’s PerfPlanet’s Performance Calendar included two posts that further describe SQIP, a technique based on blurred SVGs: Progressive Image Loading using Intersection Observer and SQIP and SQIP — Vague Vectors for Performant Previews.
When I first documented Medium’s image loading technique, I was mostly interested in reverse-engineering their technique. I had seen the effect browsing Medium on a slow inflight connection. I thought that rendering a small image early, lazy-load and transition to the final version was a good idea.
We assume these techniques improve a user’s perceived performance. Fast rendering beats slow rendering. Putting something on the user’s screen early, even if it’s not the final content.
Are we sure about this?
Going through some comments on Reddit, I found lots of insightful (and negative) opinions. Here are two of them:
“I hate websites that show a blurry version of an image before the final one loads. It plays with my eyes. I have to look away and peek to see if it’s done before I can read on. I wish there was a way to disable this functionality."
— rocky1138, Hacker News
“How have people come to the conclusion that displaying a low-information version of the image to be loaded as a placeholder results in a quicker perceived load? To me all these effects just look rubbish and distracting, with no benefit at all — certainly not the perception of speed. It’s not like I can ever understand what the image really is before it’s fully loaded anyway, with our without fancy placeholder."
— dwb, Hacker News
Trying To Find Studies About Users’ Perception
I wanted to find some scientific research that could support that these techniques to load images were (or not) beneficial. This proved to be a challenge. I couldn’t find any study proving that showing something like a blurry thumbnail before the image loads improves a user’s perception. Then I thought of progressive JPEGs.
Back To Basis: Progressive JPEGs
In a certain way, we have had a similar “progressive image loading technique” backed into images for a long time. Progressive JPEG is a good example.
Progressive JPEGs have been proposed as a good practice for images, especially for sites used in slow networks. Ann Robson wrote a post encouraging Progressive JPEGs, now five years ago, where she summarized why they were superior:
“Progressive JPEGs are better because they are faster. Appearing faster is being faster, and perceived speed is more important that actual speed. Even if we are being greedy about what we are trying to deliver, progressive JPEGs give us as much as possible as soon as possible."
A progressive JPEG encodes the image into several scans. The first scan renders the full image in low quality, and it is refined as more scans are rendered. An alternative is JPEG’s baseline mode in which the image is decoded top to bottom.


As a side note, JPEG encoding can be customized using different scan scripts. This can be used to create images that are encoded in a hybrid mode between baseline and progressive.
Progressive techniques like Blur-up, SQIP resemble progressive JPEGs from user’s perception point of view. The browser renders a low-quality image first and replaces it with the final image when it loads.
Interestingly the vast majority of JPEG images use the baseline mode. According to some sources, progressive JPEGs represent at most 7% of all JPEGs. If we seem to agree that these techniques improve user’s perceived performance, why aren’t progressive JPEGs used more widely than baseline JPEGs?
The Study
I could only find a study called “Progressive Image Rendering - Good or Evil?”, that tried to shed some light on this topic.
“When, as with the Progressive JPEG method, image rendition is a two-stage process in which an initially coarse image snaps into sharp focus, cognitive fluency is inhibited, and the brain has to work slightly harder to make sense of what is being displayed.”
According to the study, users find it more difficult to process progressive JPEGs, even though at first sight we would think the experience is better.
I recently mentioned the study in a conversation about LQIP (Low-Quality Image Placeholders). Soon, I got some replies questioning the rigour of the study:
"Many people have questioned the validity of that study, though. It is contrary to everything we assume about the benefits of progressive rendering and nobody has come forth yet with a 2nd study with similar findings. We need more data."
— Tobias Baldauf 🥠 (@tbaldauf) December 9, 2017
"The study was very limited and contentious. Large scale data to prove or disprove it is essential to draw any conclusions"
— Yoav Weiss (@yoavweiss) December 9, 2017
So far, we have a single study which is received with skepticism. What else do we have? Can we use the existing tools to measure perceived performance as a proxy?
Measuring Perceived Load Time
Imagine these two hypothetical filmstrips recorded from a site:
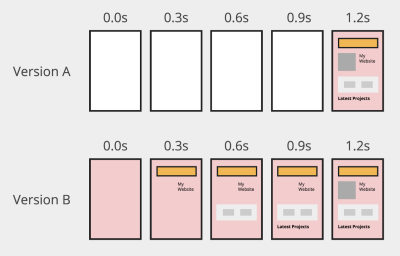
The general agreement is that the user will perceive that Version B loads faster than Version A. This is because parts of the page as rendered earlier than in Version A.
In some way, the situation is similar to that of progressive images, but at a larger scale. Partial content as early as possible, even though it’s not the final one.
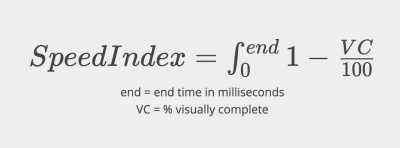
A page load time of 1.2 seconds tells us part of the story, but doesn’t describe what the user sees during that time. These days we use metrics like Speed Index to evaluate how fast a page loads. Speed Index measures the area of the page that is not visually completed. This is done on several screenshots taken at intervals. The lower the number, the better.
If we think about progressive image loading techniques, how will Speed Index vary as the image loads? Will that area be considered “visually completed” if we use a low-quality placeholder?
Initially, Speed Index measured the progress comparing the distance of histograms, one per each primary color (red, green, blue). This is called Mean Histogram Difference. The goal is to prevent changes like reflows, where all elements on the page are shifted by a few pixels, from having a large impact on the calculation. For more information about the algorithm, read the Measuring Visual Progress section of the Speed Index doc.
I decided to try Webpagetest against a page that displays low-quality placeholders (see report on WebPageTest):

We can notice that between second 8 and 10 the image loads. The blurry placeholder increases the visual completeness percentage from 75% to 83%. Loading the final image takes it from 83% to 93%.
We see that a placeholder contributes to the visual completeness of the page as measured by Speed Index. We can also observe that the placeholder doesn’t count as a fully visually complete area.
Speed Index is not the only metric that we can use to get a measure of how fast our page renders. Chrome Developer Tools includes an option to do a Performance audit. Go to Audits → Perform an audit → Check 'Performance' → Run audit.
Running an audit generates a report like this:
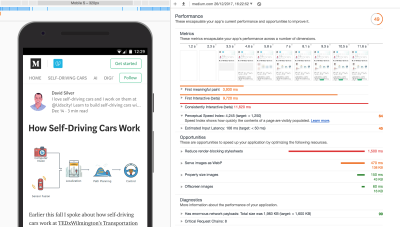
One of the metrics reported is “Perceptual Speed Index.” In this run the value is 4,245. But what exactly does this term mean? Is it the same as Webpagetest’s “Speed Index”?
Speed Index’s approach to measure pixel-wise similarity, also called “Mean Histogram Difference”, has some drawbacks. The MHD doesn’t capture visual perception of shape, color or object similarity.
In most cases, this won’t make a big difference when running a visual completeness evaluation. In practice, the Speed Index as well as the Perceptual Speed Index have a high correlation:
“In large-scale empirical studies that we conducted (using 500+ Alexa top mobile webpage videos collected via WebPagetest), we find that SI and PSI are linearly correlated (at 0.91, to be precise).” — Perceptual Speed Index (PSI) for Measuring Above-the-Fold Web Performance
Perceptual Speed Index
According to Google’s Lighthouse documentation, the Perceptual Speed Index is calculated using a node module called Speedline. This package calculates the perceptual speed index, based on the same principal as the original speed index, but it computes the visual progression between frames using the SSIM instead of the histogram distance.
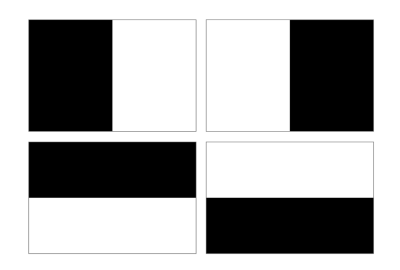
SSIM (Structural Similarity) is used for measuring the similarity between two images. This method tries to model how human beings perceive images, and does capture shape, color and object similarity. SSIM has other interesting applications: One of them is optimizing image compression settings, such as cjpeg-dssim which chooses the highest JPEG compression level and generates an image with a close enough SSIM.
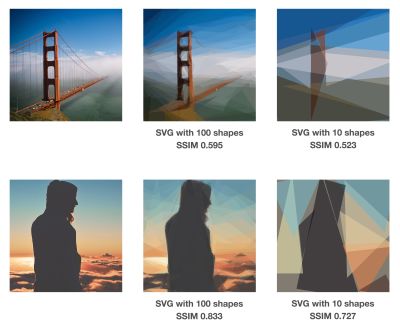
Below you can see the Image SSIM JS scores for SVG images created using Primitive. The more shapes we use, the closer it is to the original image (SSIM = 1).
More recent alternatives to SSIM are butteraugli (used by Guetzli, Google’s Perceptually Guided JPEG Encoder) and SSIMULACRA (used by Cloudinary).
Conclusion
There is no simple way to synthesize a user’s perception of an image loading over time. We are driven by the gut feeling that showing earlier is better, even if it’s not the final content, though some users will disagree.
As developers, we need to measure performance. It’s the only way we can set targets to improve it, and know when we don’t meet a performance budget. The advantage of betting on progressive image loading is that we can measure it with tools that are based on user’s perception. They give us a score, they are reproducible and scalable. They fit in our workflow and tools, and are here to stay.
As web developers, we should care more about the loading experience of the websites we build. It’s great that we now have tools such as WebPageTest and Lighthouse that can help us easily measure the effect of using progressive image loading techniques. No more excuses!
Further Reading
- How We Optimized Performance To Serve A Global Audience
- Gatsby Headaches: Working With Media (Part 1)
- Optimizing The Image Element LCP
- Movie Poster Designs To Inspire Your PWA Hero Images


