Measuring Websites With Mobile-First Optimization Tools

Email Newsletter
Weekly tips on front-end & UX.
Trusted by 182,000+ folks.
 Custom Web Forms for Angular, React, & Vue. Your backend.


 Celebrating 10 million developers
Performance on mobile can be particularly challenging: underpowered devices, slow networks, and poor connections are some of those challenges. With more and more users migrating to mobile, the rewards for mobile optimization are great. Most workflows have already adopted mobile-first design and development strategies, and it’s time to apply a similar mindset to performance.
In this article, we’ll take a look at studies linking page speed to real-world metrics, and discuss the specific ways mobile performance impacts your site. Then we’ll explore benchmarking tools you can use to measure your website’s mobile performance. Finally, we’ll work with tools to help identify and remove the code debt that bloats and weighs down your site.
Responsive Configurators
How would you design a responsive car configurator? How would you deal with accessibility, navigation, real-time previews, interaction and performance? Let’s figure it out. Read a related article →
Why Performance Matters
The benefits of performance optimization are well-documented. In short, performance matters because users prefer faster websites. But it’s more than a qualitative assumption about user experience. There are a variety of studies that directly link reduced load times to increased conversion and revenue, such as the now decade-old Amazon study that showed each 100ms of latency led to a 1% drop in sales.
Page Speed, Bounce Rate & Conversion
In the data world, poor performance leads to an increased bounce rate. And in the mobile world that bounce rate may occur sooner than you think. A recent study shows that 53% of mobile users abandon a site that takes more than 3 seconds to load.
That means if your site loads in 3.5 seconds, over half of your potential users are leaving (and most likely visiting a competitor). That may be tough to swallow, but it is as much a problem as it is an opportunity. If you can get your site to load more quickly, you are potentially doubling your conversion. And if your conversion is even indirectly linked to profits, you’re doubling your revenue.
SEO And Social Media
Beyond reduced conversion, slow load times create secondary effects that diminish your inbound traffic. Search engines already use page speed in their ranking algorithms, bubbling faster sites to the top. Additionally, Google is specifically factoring mobile speed for mobile searches as of July 2018.
Social media outlets have begun factoring page speed in their algorithms as well. In August 2017, Facebook announced that it would roll out specific changes to the newsfeed algorithm for mobile devices. These changes include page speed as a factor, which means that slow websites will see a decline in Facebook impressions, and in turn a decline in visitors from that source.
Search engines and social media companies aren’t punishing slow websites on a whim, they’ve made a calculated decision to improve the experience for their users. If two websites have effectively the same content, wouldn’t you rather visit one that loads faster?
Many websites depend on search engines and social media for a large portion of their traffic. The slowest of these will have an exacerbated problem, with a reduced number of visitors coming to their site, and over half of those visitors subsequently abandoning.
If the prognosis sounds alarming, that’s because it is! But the good news is that there are a few concrete steps you can take to improve your page speeds. Even the slowest sites can get “sub three seconds” with a good strategy and some work.
Profiling And Benchmarking Tools
Before you begin optimizing, it’s a good idea to take a snapshot of your website’s performance. With profiling, you can determine how much progress you will need to make. Later, you can compare against this benchmark to quantify the speed improvements you make.
There are a number of tools that assess a website’s performance. But before you get started, it’s important to understand that no tool provides a perfect measurement of client-side performance. Devices, connection speeds, and web browsers all impact performance, and it is impossible to analyze all combinations. Additionally, any tool that runs on your personal device can only approximate the experience on a different device or connection.
In one sense, whichever tool you use can provide meaningful insights. As long as you use the same tool before and after, the comparison of each should provide a decent snapshot of performance changes. But certain tools are better than others.
In this section, we’ll walk through two tools that provide a profile of how well your website performs in a mobile environment.
Note: If can be difficult to benchmark an entire site, so I recommend that you choose one or two of your most important pages for benchmarking.
Lighthouse
One of the more useful tools for profiling mobile performance is Google’s Lighthouse. It’s a nice starting point for optimization since it not only analyzes page performance but also provides insights into specific performance issues. Additionally, Lighthouse provides high-level suggestions for speed improvements.
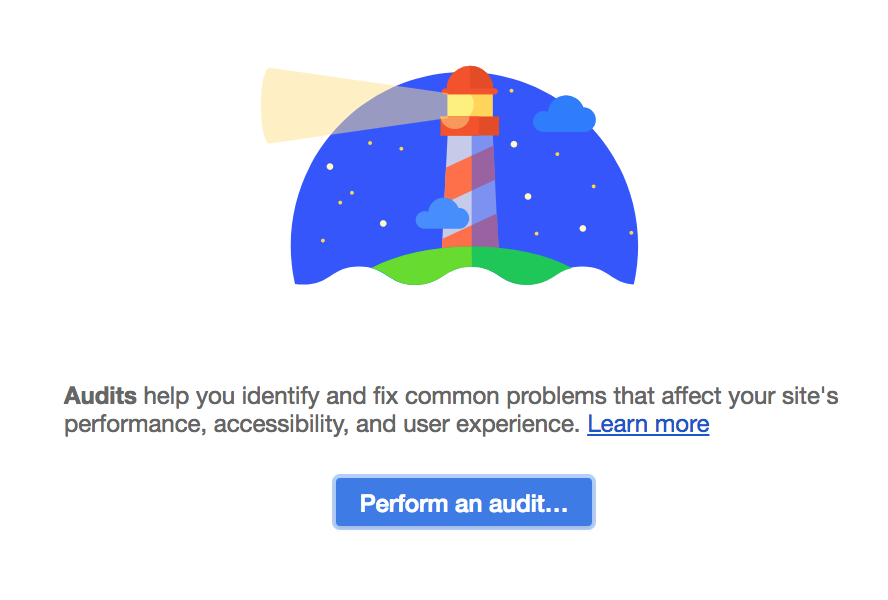
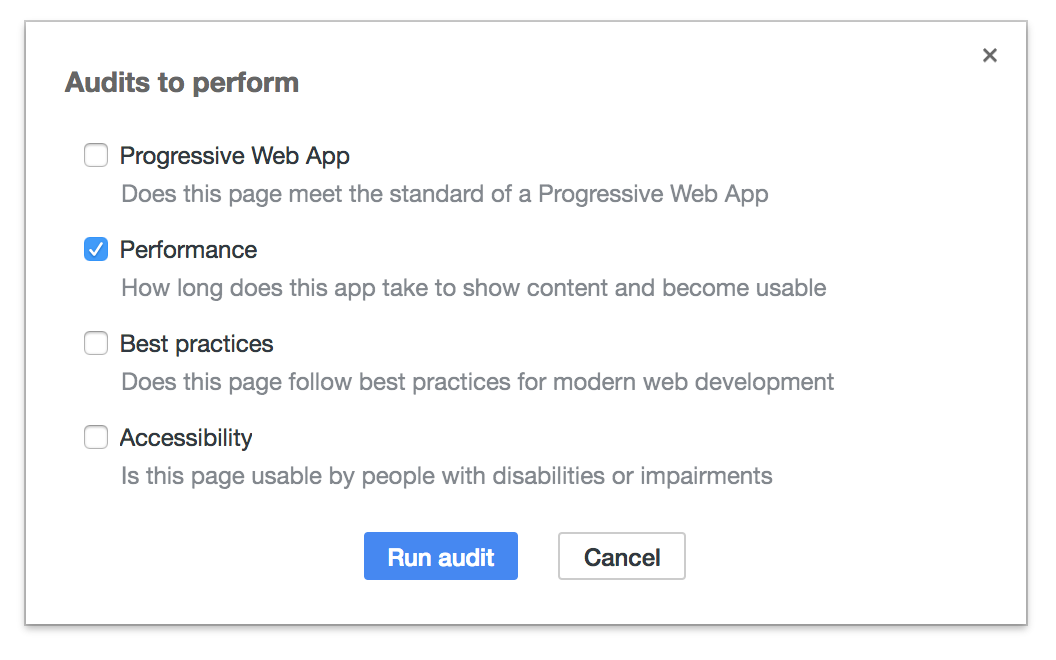
Lighthouse is available in the Audits tab of the Chrome Developer Tools. To get started, open the page you want to optimize in Chrome Dev Tools and perform an audit. I typically perform all the audits, but for our purposes, you only need to check the ‘Performance’ checkbox:
Lighthouse focuses on mobile, so when you run the audit, Lighthouse will pop your page into the inspector’s responsive viewer and throttle the connection to simulate a mobile experience.
Lighthouse Reports
When the audit finishes, you’ll see an overall performance score, a timeline view of how the page rendered over time, as well as a variety of metrics:
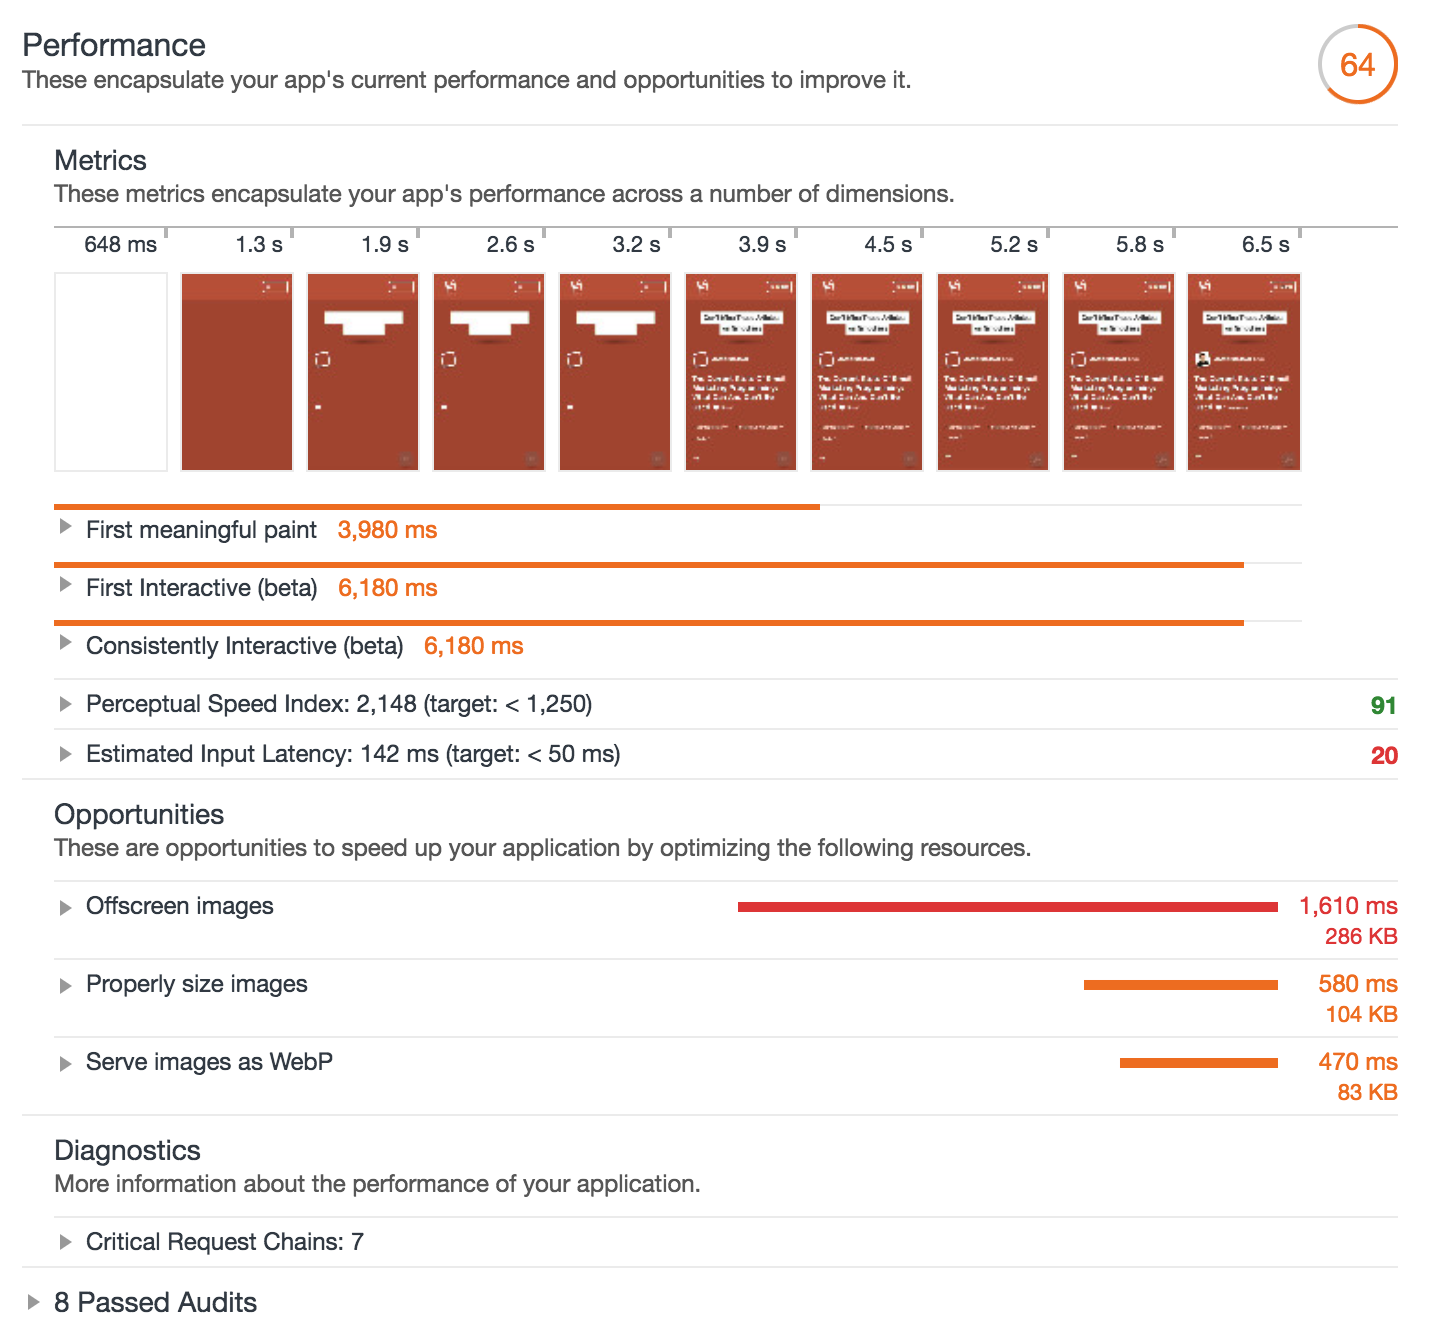
It’s a lot of information, but one report to emphasize is the first meaningful paint, since that directly influences user bounce rates. You may notice that the tool doesn’t even list the total load time, and that’s because it rarely matters for user experience.
Mobile users expect a first view of the page very quickly, and it may be some time before they scroll to the lower content. In the timeline above, the first paint occurs quickly at 1.3 seconds, then a full above-the-fold content paint occurs at 3.9 seconds. The user can now engage with the above-the-fold content, and anything below-the-fold can take a few seconds longer to load.
Lighthouse’s first meaningful paint is a great metric for benchmarking, but also take a look at the opportunities section. This list helps to identify the key problem areas of your site. Keep these recommendations on your radar, since they may provide your biggest improvements.
Lighthouse Caveats
While Lighthouse provides great insights, it is important to bear in mind that it only simulates a mobile experience. The device is simulated in Chrome, and a mobile connection is simulated with throttling. Actual experiences will vary.
Additionally, you may notice that if you run the audit multiple times, you will get different reports. That’s again because it is simulating the experience, and variances in your device, connection, and the server will impact the results. That said, you can still use Lighthouse for benchmarking, but it is important that you run it several times. It is more relevant as a range of values than a single report.
WebPageTest
In order to get an idea of how quickly your page loads in an actual mobile device, use WebPageTest. One of the nice things about WebPageTest is that it tests on a variety of real devices. Additionally, it will perform the test a number of times and take the average to provide a more accurate benchmark.
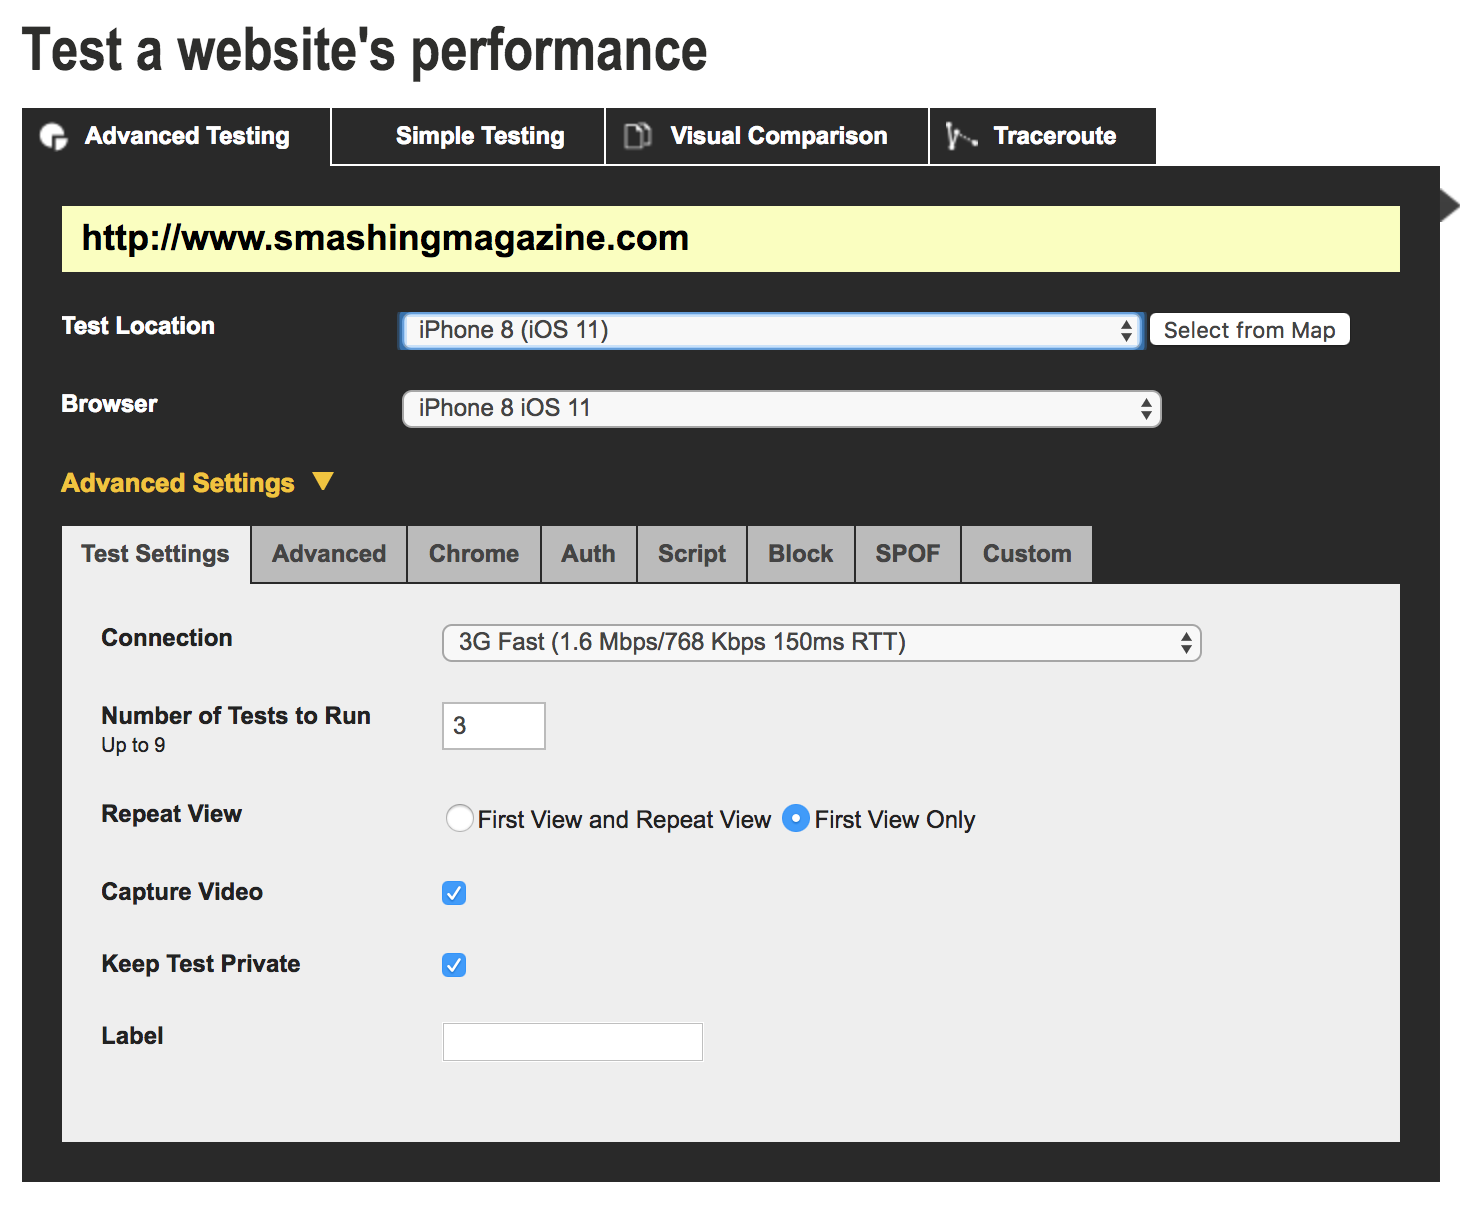
To get started, navigate to WebPageTest.org, enter the URL for the page you want to test and then select the mobile device you’d like to use for testing. Also, open up the advanced settings and change the connection speed. I like testing at Fast 3G, because even when users are connected to LTE the connection speed is rarely LTE (#sad):
After submitting the test (and waiting for any queue), you’ll get a report on the speed of the page:
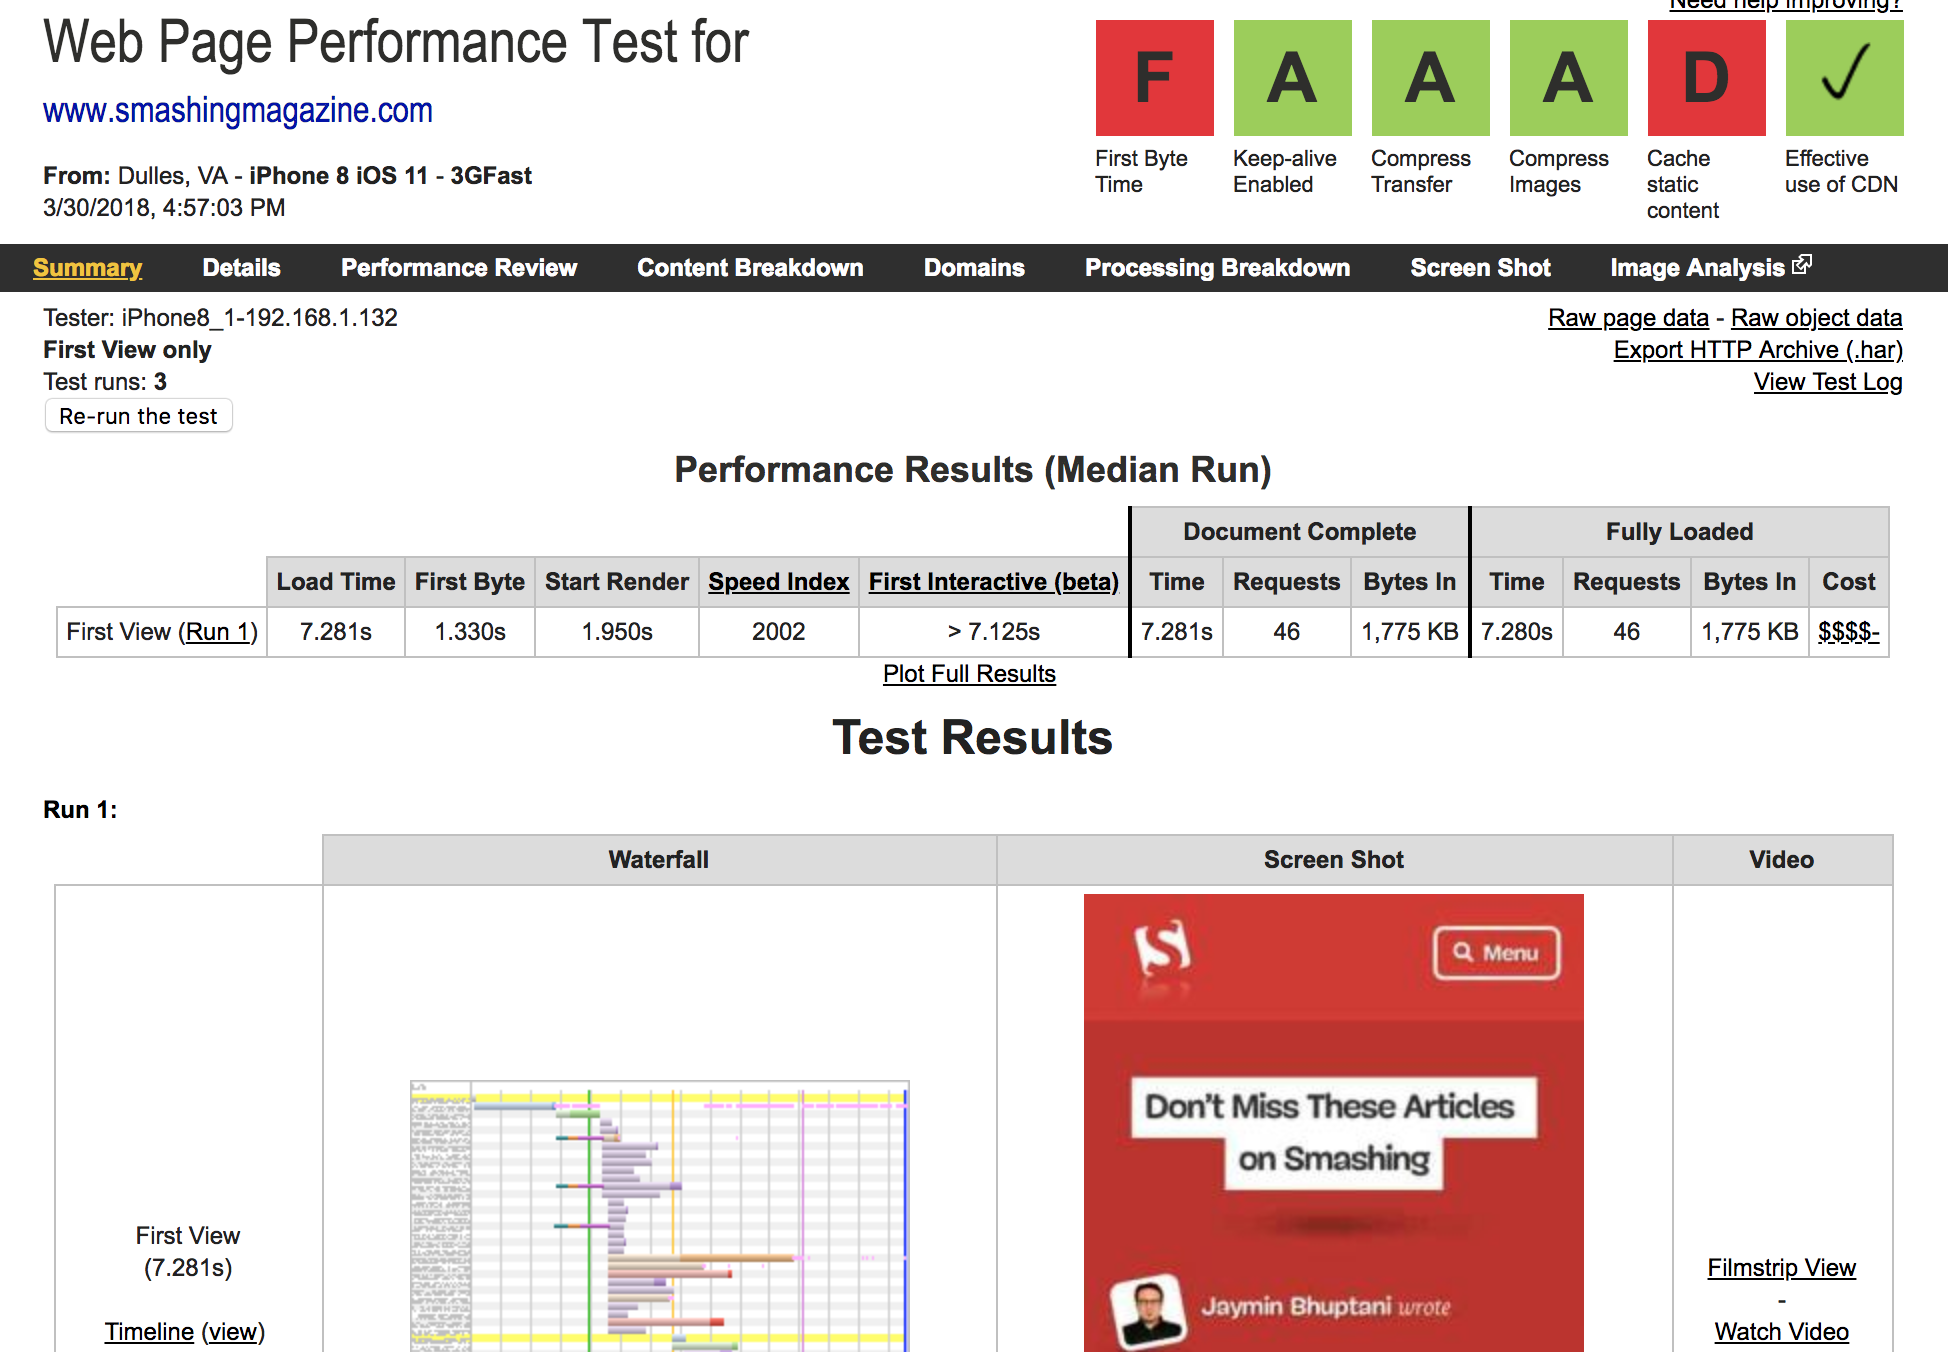
The summary view consists of a short list of metrics and links to timelines. Again, the value of the start render is more important than the load time. The first byte is useful for analyzing the server response speed. You can also dig into the more in-depth reports for additional insights.
Benchmarking
Now that you’ve profiled your page in Lighthouse and WebPageTest, it’s time to record the values. These benchmarks will provide a useful comparison as you optimize your page. If the metrics improve, your changes are worthwhile. If they stay static (or worse decline), you’ll need to rethink your strategy.
Lighthouse results are simulated which makes it less useful for benchmarking and more useful for in-depth reports and optimization suggestions. However, Lighthouse’s performance score and first meaningful paint are nice benchmarks so run it a few times and take the median for each.
WebPageTest’s values are more reliable for benchmarking since it tests on real devices, so these will be your primary benchmarks. Record the value for the first byte, start to render, and overall load time.
Bloat Reduction
Now that you’ve assessed the performance of your site, let’s take a look at a tool that can help reduce the size of your files. This tool can identify extra, unnecessary pieces of code that bloat your files and cause resources to be larger than they should.
In a perfect world, users would only download the code that they actually need. But the production and maintenance process can lead to unused artifacts in the codebase. Even the most diligent developers can forget to remove pieces of old CSS and JavaScript while making changes. Over time these bits of dead code accumulate and become unnecessary bloat.
Additionally, certain resources are intended to be cached and then used throughout multiple pages, such as a site-wide stylesheet. Site-wide resources often make sense, but how can you tell when a stylesheet is mostly underused?
The Coverage Tab
Fortunately, Chrome Developer Tools has a tool that helps assess the bloat in files: The Coverage tab. The Coverage tab analyzes code coverage as you navigate your site. It provides an interface that shows how much code in a given CSS or JS file is actually being used.
To access the Coverage tab, open up Chrome Developer Tools, and click on the three dots in the top right. Navigate to ‘More Tools’ → ‘Coverage’.
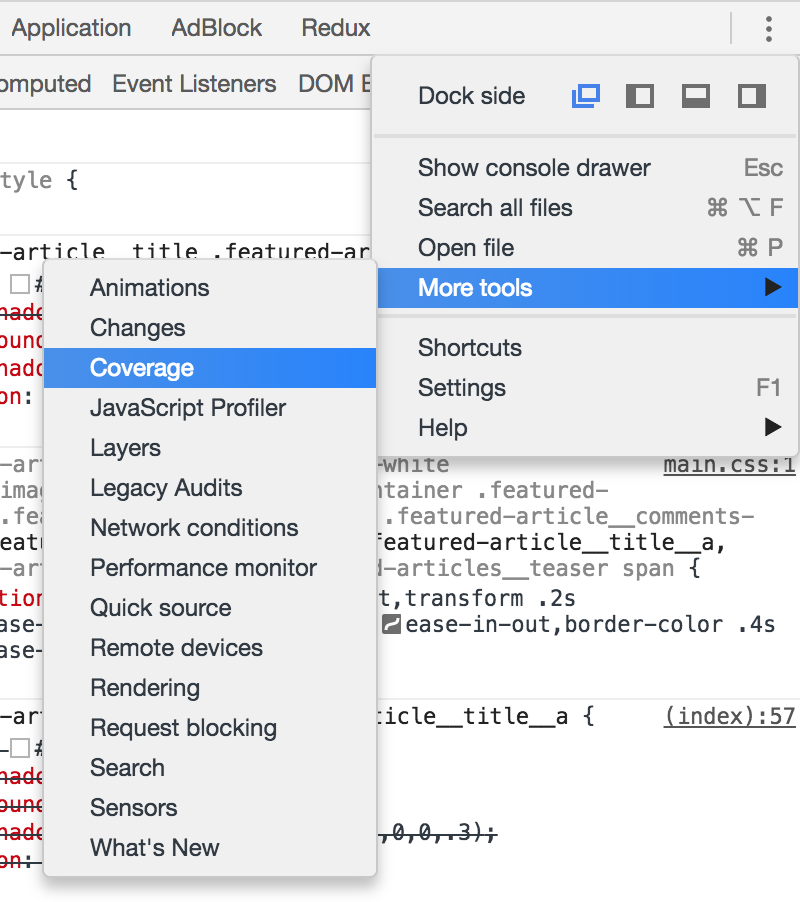
Next, start instrumenting coverage by clicking the reload button on the right. That will reload the page and begin the code coverage analysis. It brings up a report similar to this:
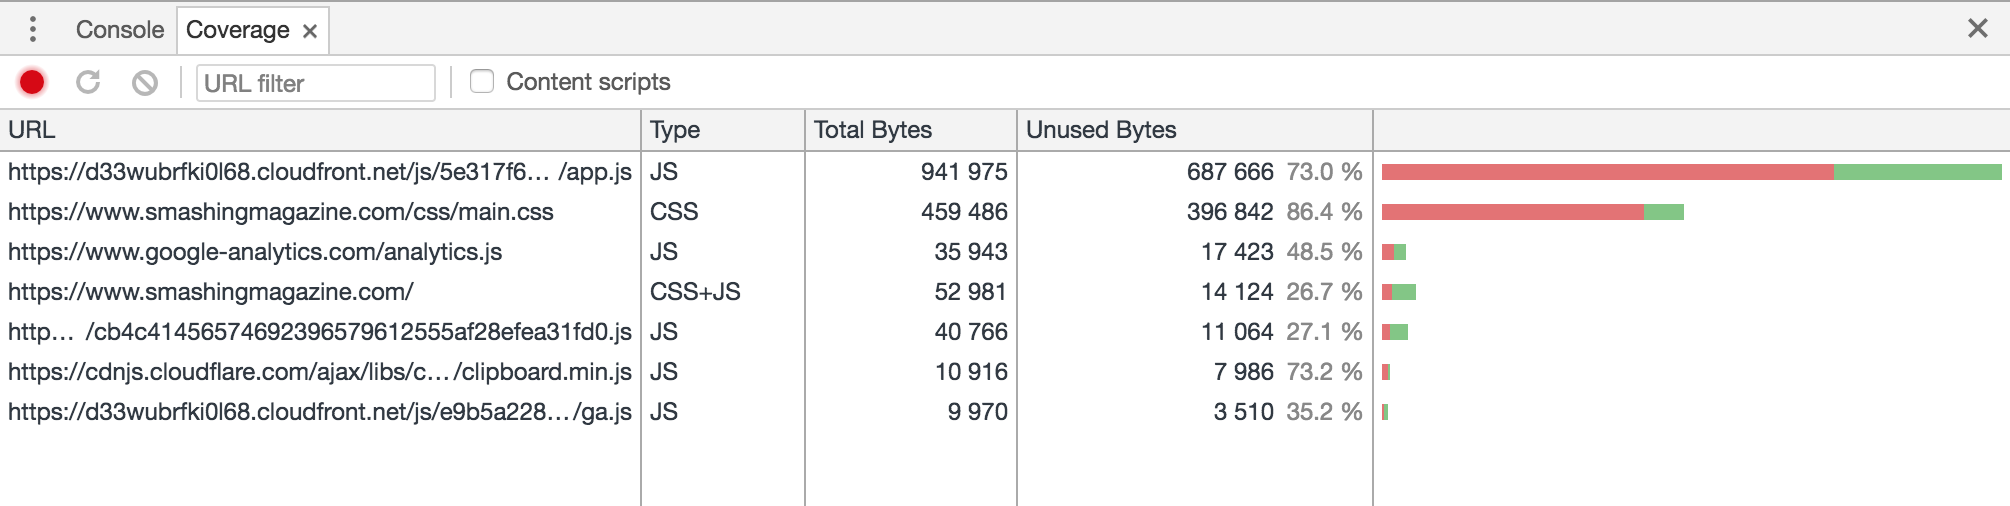
Here, pay attention to the unused bytes:
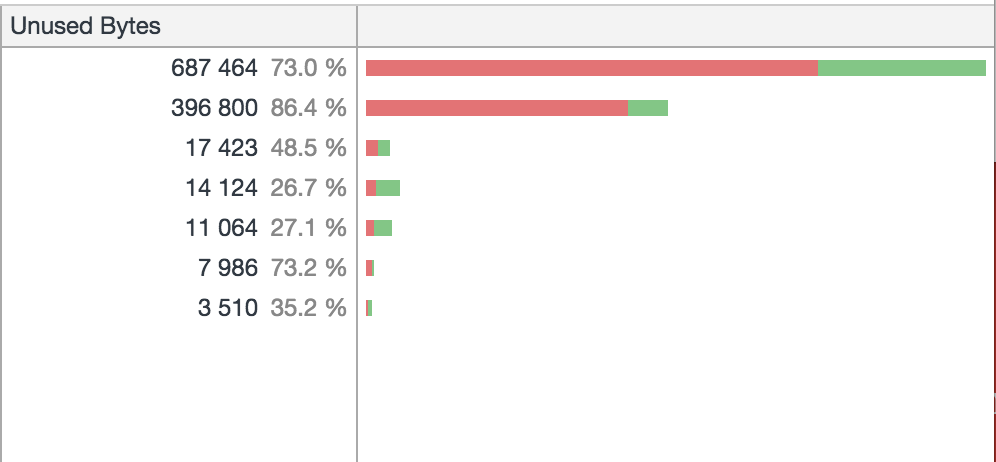
This UI shows the amount of code that is currently unused, colored red. In this particular page, the first file shown is 73% bloat. You may see significant bloat at first, but it only represents the current render. Change your screen size and you should see the CSS coverage go up as media queries get applied. Open any interactive elements like modals and toggles, and it should go up further.
Once you’ve activated every view, you will have an idea of how much code you are actually using. Next, you can dig into the report further to find out just which pieces of code are unused, simply click on one of the resources and look in the main window:
In this CSS file, look at the highlights to the left of each ruleset; green indicates used code and red indicates bloat. If you are building a single page app or using specialized resources for this particular page, you may be inclined to go in and remove this garbage. But don’t be too hasty. You should definitely remove dead code, but be careful to make sure that you haven’t missed a breakpoint or interactive element.
Next Steps
In this article, we’ve shown the quantitative benefits of optimizing page speed. I hope you’re convinced, and that you have the tools you need to convince others. We’ve also set a minimum goal for mobile page speed: sub three seconds.
To hit this goal, it’s important that you prioritize the highest impact optimizations first. There are a lot of resources online that can help define this roadmap, such as this checklist. Lighthouse can also be a great tool for identifying specific issues in your codebase, so I encourage you to tackle those bottlenecks first. Sometimes the smallest optimizations can have the biggest impact.
Further Reading
- Modern Methods For Improving Drupal’s Largest Contentful Paint Core Web Vital
- Fitts’ Law In The Touch Era
- Optimizing The Image Element LCP
- How We Optimized Performance To Serve A Global Audience


