SVG Web Page Components For IoT And Makers (Part 1)
Email Newsletter
Weekly tips on front-end & UX.
Trusted by 182,000+ folks.


 Custom Web Forms for Angular, React, & Vue. Your backend.
 Celebrating 10 million developers
The IoT market is still in its early stages, but gathering steam. We are at a cusp in the history of IoT. Markets are quadrupling in the course of five years, 2015 to 2020. For web developers, this IoT growth is significant. There is already a great demand for IoT web techniques.
Many devices will be spread out geospatially, and its owners will desire remote control and management. Full web stacks must be made in order to create channels for teleoperation. Also, the interaction will be with one or more IoT devices at a time. The interaction must be in the real time of the physical world.
This discussion delves into the interface requirements using Vue.js as a catalyst and illustrates one method of webpage to device communication out of many subsitutions.
Here are some of the goals planned for this discussion:
- Create a single page web app SPWA that hosts groups of IoT human-machine interfaces (we may call these “panel groups”);
- Display lists of panel group identifiers as a result of querying a server;
- Display the panels of a selected group as a result of a query;
- Ensure that the panel display is loaded lazily and becomes animated quickly;
- Ensure that panels synchronize with IoT devices.
IoT And The Rapid Growth Of Web Pages
The presentation of graphics for visualization and remote control of hardware along with synchronization of web pages with real-time physical processes are within the realm of web page problem solving inherent in this IoT future.
Many of us are beginning our search for IoT presentation techniques, but there are a few web standards along with a few presentation techniques that we can begin using now. As we explore these standards and techniques together, we can join this IoT wave.
Dashboards and data visualization are in demand. Furthermore, the demand for going beyond web pages that provide forms or display lists or textual content is high. The dashboards for IoT need to be pictographic, animated. Animations must be synchronized with real-time physical processes in order to provide a veridical view of machine state to users. Machine state, such as a flame burning or not, trumps application state and provides critical information to operators, perhaps even safety information.
The dashboards require more than the visualization of data. We have to keep in mind that the things part of IoT is devices that not only have sensors but also control interfaces. In hardware implementations, MCUs are extended with switches, threshold switches, parameter settings, and more. Still, web pages may take the place of those hardware control components.
Nothing new. Computer interfaces for hardware have been around for a long time, but the rapid growth of web page use for these interfaces is part of our present experience. WebRTC and Speech API are on a development path that started in 2012. WebSockets has been developing in a similar time frame.
IoT has been in our minds for a long time. IoT has been part of the human dialog since 1832. But, IoT and wireless as we are coming to know it was envisioned by Tesla around 1926. Forbes 2018 State of Iot tells us the current market focus for IoT. Of interest to web developers, the article calls out dashboards:
“IoT early adopters or advocates prioritize dashboards, reporting, IoT use cases that provide data streams integral to analytics, advanced visualization, and data mining.”
The IoT market is huge. This Market Size article gives a prediction for the number of devices that will appear: 2018: 23.14 billion ⇒ 2025: 75.44 billion. And, it attempts to put a financial figure on it: 2014: $2.99 trillion ⇒ 2020: $8.90 trillion. The demand for IoT skills will be the fastest growing: IoT in Demand.
As we develop clear interfaces for controlling and monitoring devices, we encounter a new problem for developing our interfaces. All the many billions of devices will be owned by many people (or organizations). Also, each person may own any number of devices. Perhaps even some of the devices will be shared.
Modern interfaces that have been made for machine controls often have a well-defined layout specific to a particular machine or installation of a few machines. For instance, in a smart house, a high-end system will have an LCD with panels for carefully placed devices. But, as we grow with the web version of IoT, there will be any number of panels for a dynamic and even mobile stream of devices.
The management of panels for devices becomes similar to managing social connections on social web sites.
“Our user interfaces will have to be dynamic in managing which highly animated real-time panel must be displayed at any one time for each particular user.”
The dashboard is a single page web app SPWA. And, we can imagine a database of panels. So, if a single user is going to access a number of panels and configurations for his devices strewn about the planet, the SPWA needs to access panel components on demand. The panels and some of their supporting JavaScript will have to load lazily.
“Our interfaces will have to work with web page frameworks that can allow incorporating asynchronous component bindings without reinitializing their frameworks.”
Let’s use Vue.js, WebSockets, MQTT, and SVG to make our step into the IoT market.
Recommended reading: Building An Interactive Infographic With Vue.js
High-Level Architecture For An IoT Web App
When designing the interface for the IoT web page, one always has many options. One option might be to dedicate one single page to one single device. The page might even be rendered on the server side. The server would have the job of querying the device to get its sensor values and then putting the values into the appropriate places in the HTML string.
Many of us are familiar with tools that allow HTML templates to be written with special markers that indicate where to put variable values. Seeing {{temperature}} in such a template tells us and the view engine to take the temperature queried from a device and replace the {{temperature}} symbol with it. So, after waiting for the server to query the device, the device responding, rendering the page, and delivering the page, the user will finally be able to see the temperature reported by the device.
For this page per device architecture, the user may then wish to send a command to the device. No problem, he can fill out an HTML form and submit. The server might even have a route just for the device, or perhaps a little more cleverly, a route for the type of device and device ID. The server would then translate the form data into a message to send to the device, write it to some device handler and wait for an acknowledgment. Then, the server may finally respond to the post request and tell the user that everything is fine with the device.
Many CMSs work in this way for updating blog entries and the like. Nothing seems strange about it. It seems that HTML over HTTP has always had the design for getting pages that have been rendered and for sending form data to be handled by the web server. What’s more, there are thousands of CMS’s to choose from. So, in order to get our IoT system up, it seems reasonable to wade through those thousands of CMS’s to see which one is right for the job. Or, we might apply one filter on CMS’s to start with.
We have to take the real-time nature of what we are dealing with into consideration. So, while HTML in its original form is quite good for many enterprise tasks, it needs a little help in order to become the delivery mechanism for IoT management. So, we need a CMS or custom web server that helps HTML do this IoT job. We can also just think of the server as we assume CMS’s provide server functionality. We just need to keep in mind that the server has to provide event-driven animation, so the page can’t be 100% finalized static print.
Here are some parameters that might guide choices for our device-linked web page, things that it should do:
- Receive sensor data and other device status messages asynchronously;
- Render the sensor data for the page in the client (almost corollary to 1);
- Publish commands to a particular device or group of devices asynchronously;
- Optionally send commands through the server or bypass it.
- Securely maintain the ownership relationship between the device and the user;
- Manage critical device operation by either not interfering or overriding.
The list comes to mind when thinking about just one page acting as the interface to a selected device. We want to be able to communicate with the device freely when it comes to commands and data.
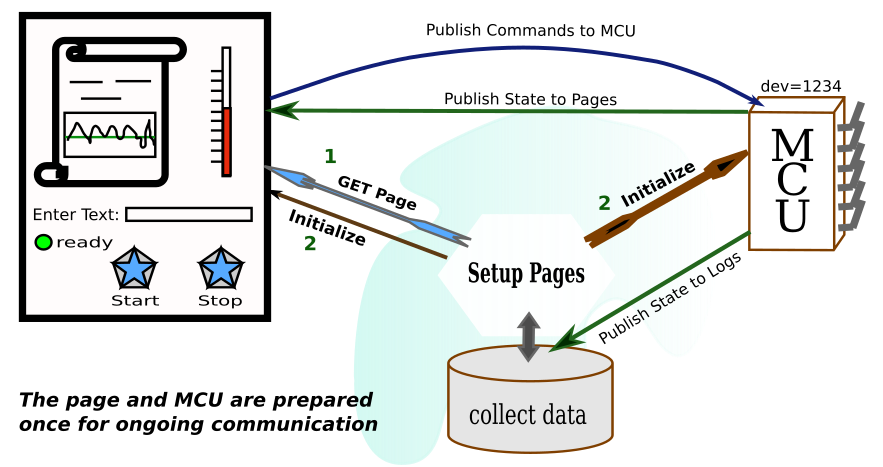
As for the page, we need only ask the web server for it once. We would expect that the web server (or associated application) would provide a secure communication pathway. And, the pathway does not have to be through the server, or maybe it should avoid the server altogether as the server may have higher priority tasks other than taking care of one page’s communication for data coming from sensors.
In fact, we can imagine data coming in from a sensor once a second, and we would not expect the web server itself to provide a constant second by the second update for thousands of individual sensor streams multiplied by thousands of viewers. Of course, a web server can be partitioned or set up in a load balancing framework, but there are other services that are customized for sensor delivery and marshaling commands to hardware.
The web server will need to deliver some packet so that the page may establish secure communication channels with the device. We have to be careful about sending messages on channels that don’t provide some management of the kinds of messages going through. There has to be some knowledge as to whether a device is in a mode that can be interrupted or there may be a demand for user action if a device is out of control. So, the web server can help the client to obtain the appropriate resources which can know more about the device. Messaging could be done with something like an MQTT server. And, there could be some services for preparing the MQTT server that can be initiated when the user gains access to his panel via the web server.
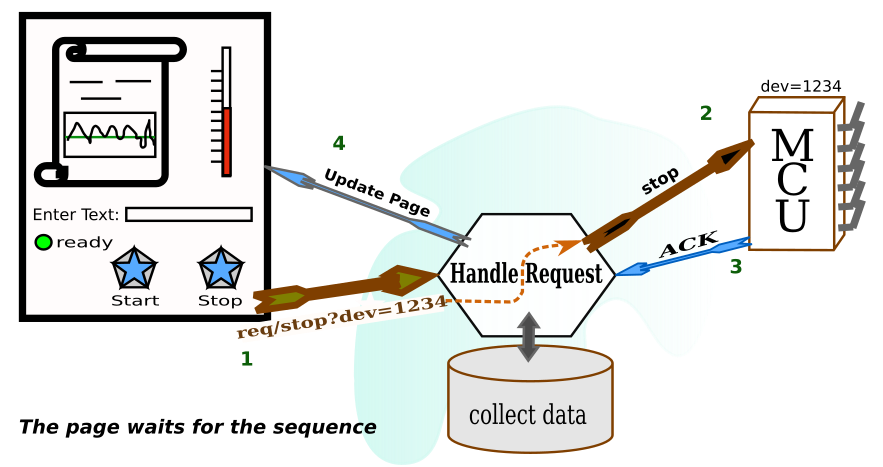
Because of the physical world with its real-time requirements and because of additional security considerations, our diagram becomes a little different from the original.
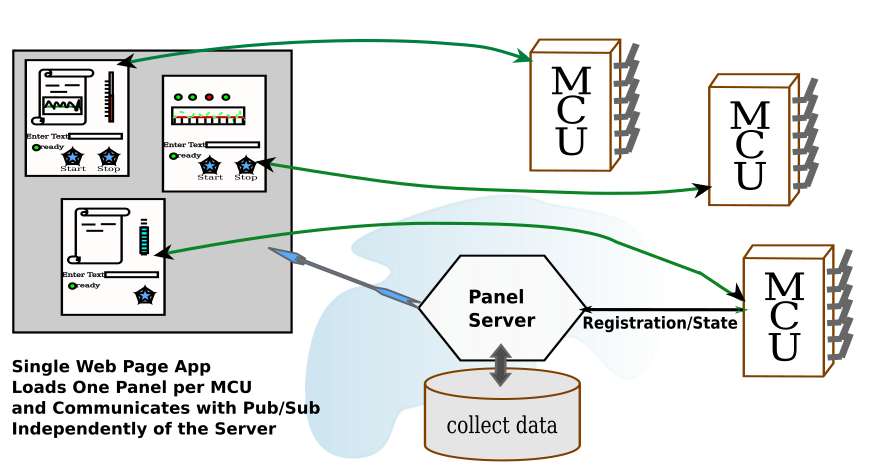
We don’t get to stop here. Setting up a single page per device, even if it is responsive and handles communication well, is not what we asked for. We have to assume that a user will log in to his account and access his dashboard. From there, he will ask for some list of content projects (most likely projects he is working on). Each item in the list will refer to a number of resources. When he selects an item by clicking or tapping, he will gain access to a collection of panels, each of which will have some information about a particular resource or IoT device.
Any number of the panels delivered in response to the query generated as a result of the user’s interface action may be those panels that interact with live devices. So, as soon as a panel comes up, it will be expected to show real-time activity and to be able to send a command to a device.
How the panels are seen on the page is a design decision. They might be floating windows, or they might be boxes on a scrollable background. However that is presented, panels will be ticking off time, temperature, pressure, wind speed, or whatever else you can imagine. We expect the panels to be animated with respect to various graphic scales. Temperature can be presented as a thermometer, speed as a semicircular speed gauge, sound as a streaming waveform, and so on.
The web server has the job of delivering the right panels to the right user given queries to a database of panels and given that devices have to be physically available. What’s more, given that there will be many different kinds of devices, the panels for each device will likely be different. So, the web server should be able to deliver the pictographic information needed for rendering a panel. However, the HTML page for the dashboard should not have to be loaded with all the possible panels. There is no idea of how many there will be.
Here are some parameters that might guide choices for our dashboard page, things that it should do:
- Present a way of selecting groups of related device panels;
- Make use of simultaneous device communication mechanisms for some number of devices;
- Activate device panels when the user requests them;
- Incorporate lazily loaded graphics for unique panel designs;
- Make use of security tokens and parameters with respect to each panel;
- Maintain synchronicity with all devices under user inspection.
We can begin to see how the game changes, but in the world of dashboard design, the game has been changing a little bit here and there for some time. We just have to narrow ourselves down to some up to date and useful page development tools to get ourselves up and going.
Let’s start with how we can render the panels. This already seems like a big job. We are imagining many different kinds of panels. But, if you ever used a music DAW, you would see how they have used graphics to make panels look like the analog devices used by bands from long ago. All the panels in DAW’s are drawn by the plugins that operate on sound. In fact, a lot of those DAW’s plugins might use SVG to render their interfaces. So, we limit ourselves to handling SVG interfaces, which in turn can be any graphic we can imagine.
Choosing SVG For Panels
Of course, I like DAWs and would use that for an example, but SVG is a web page standard. SVG is a W3C standard. It is for carrying line drawings to the web pages. SVG used to be a second class citizen on the web page, required to live in iFrames. But, since HTML5, it has been a first class citizen. Perhaps, when SVG2 comes out, that it will be able to use form elements. For now, form elements are Foreign Objects in SVG. But, that should not stop us from making SVG the substrate for panels.
SVG can be drawn, stored for display, and it can be lazily loaded. In fact, as we explore the component system we will see that SVG can be used for component templates. In this discussion, we will be using Vue.js to make components for the panels.
Drawing SVG is not difficult, because there are many line drawing programs that are easy to get. If you spend the money, you can get Adobe Illustrator, which exports SVG. Inkscape has been a goto for SVG creation for some time. It is open source and works well on Linux, but can also be run on Mac and Windows. Then, there are several web page SVG editing programs that are open source, and some SaaS versions as well.
I have been looking around for an open-source web-based SVG editor. After some looking around, I came upon SVG-Edit. You can include it in your own web pages, perhaps if you are making an SVG based blog or something.
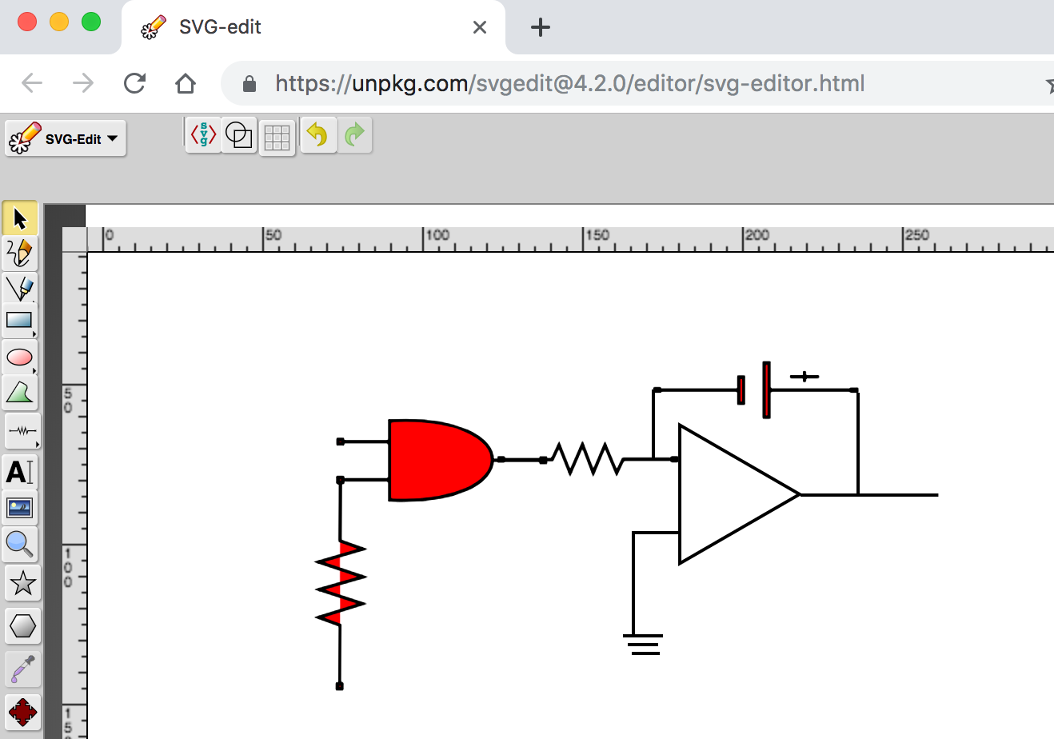
When you save your work to a file, SVG-Edit downloads it in your browser, and you can pick up the file from your download directory.
The picture I have drawn shows an AND gate controlling an integrator. That is not what one would usually expect to see in a panel for an MCU. The panel might have a button to feed one of the AND gate inputs, perhaps. Then it might have a display from an ADC that reads the output of the integrator. Perhaps that will be a line chart on a time axis. Most panels will have graphics that allow the user to relate to what is going on inside the MCU. And, if our circuit is going to live anywhere, it will be inside the MCU.
All the same, our electronic diagram can be used to discuss animation. What we want to do is take a look at the SVG and see where we can get at some of the DOM tags that we would like to change in some way. We can then animate the SVG by using a little vanilla JavaScript and a timer. Let’s make the AND gate blink in different colors.
The SVG that we are looking for is in the following code box. It doesn’t look very friendly for the programmer, although the user will be quite happy. Nevertheless, there are still some cues to go on for finding which DOM element we wish to operate on. First, most SVG drawing tools have a way of getting at object properties, in particular, the id attribute. SVG-Edit has a way, too. In the editor, select the AND gate and observe the toolbar. You will see a field for the id and the CSS class as well.
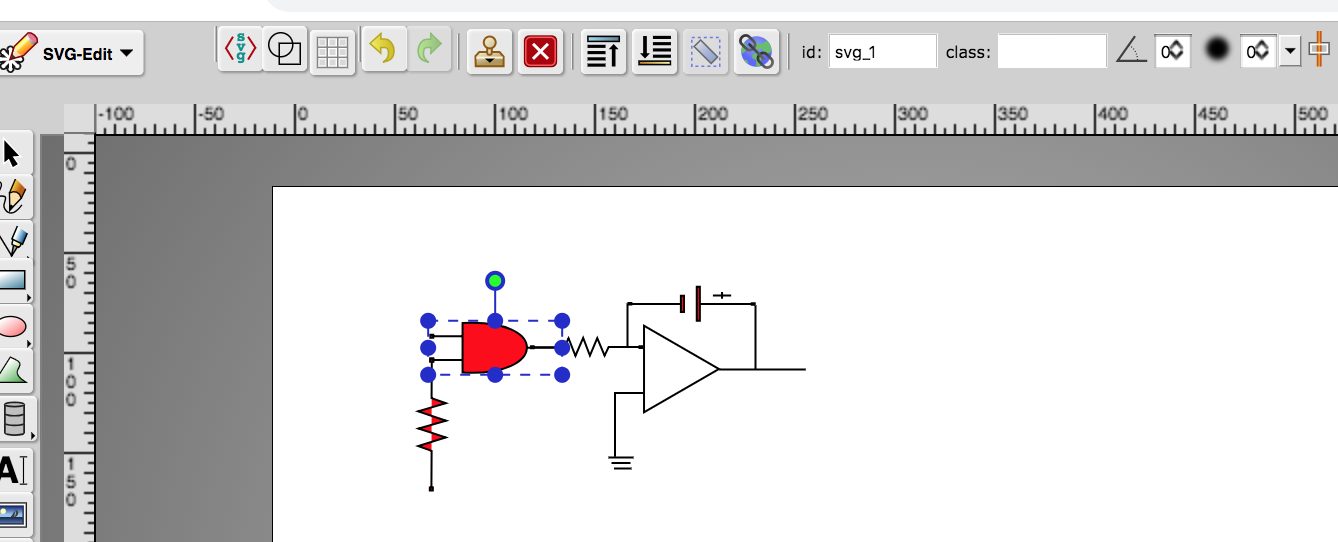
If you can’t get to an editing tool for some reason, you can open the SVG up in a browser and inspect the DOM. In any case, we have found that our gate had id = “svg_1”.
<svg width="640" height="480" xmlns="https://www.w3.org/2000/svg" xmlns:svg="https://www.w3.org/2000/svg">
 <g class="layer">
  <title>Layer 1</title>
  <path d="m80.59881,87.020171l14.714795,0m-14.714793,-11.938687l14.714797,0.000004m-0.033867,-6.543869l0,24.758504c42.377882,2.221929 43.364812,-27.139117 0,-24.758504zm47.366321,12.333056l-15.303943,0m-48.188699,-6.489897l1.454753,0l0,1.454751l-1.454753,0l0,-1.454751zm-0.068425,11.869359l1.454753,0l0,1.454753l-1.454753,0l0,-1.454753zm63.545246,-6.089294l1.454751,0l0,1.454751l-1.454751,0l0,-1.454751z" fill="#FF0000" id="svg_1" stroke="#000000"/>
  <path d="m48.58886,119.662231l18.234678,0l2.523043,-7.173309l4.128604,13.808613l4.587337,-13.987948l4.013933,13.808613l4.35797,-13.629278l4.35797,13.718944l2.408353,-6.72497l18.349357,0m-64.482612,-0.623112l1.515724,0l0,1.515728l-1.515724,0l0,-1.515728zm64.484275,-0.103111l1.515721,0l0,1.515728l-1.515721,0l0,-1.515728z" fill="#FF0000" id="svg_3" stroke="#000000" stroke-dasharray="null" stroke-linecap="null" stroke-linejoin="null" transform="rotate(90.3367 80.0675 119.304)"/>
  <polygon cx="108.5" cy="79.5" edge="0" fill="#ffffff" id="svg_6" orient="x" shape="regularPoly" sides="3" strokeWidth="null" strokecolor="#000000"/>
  <polygon cx="215.5" cy="192.5" edge="0" fill="#ffffff" id="svg_7" orient="x" shape="regularPoly" sides="3" strokeWidth="null" strokecolor="none"/>
  <polygon cx="165.5" cy="164.5" edge="0" fill="#ffffff" id="svg_8" orient="x" shape="regularPoly" sides="3" strokeWidth="null" strokecolor="none"/>
  <polygon cx="161.5" cy="138.5" edge="0" fill="#ffffff" id="svg_9" orient="x" shape="regularPoly" sides="3" strokeWidth="null" strokecolor="none"/>
  <polygon cx="160.5" cy="161.5" edge="0" fill="#ffffff" id="svg_10" orient="x" shape="regularPoly" sides="3" strokeWidth="null" strokecolor="none"/>
  <g id="svg_23">
   <path d="m225.016923,53.008793l0,3.419331m-4.558966,-1.709666l9.11791,0m10.303228,4.235512l-25.770656,0m-34.429182,0l24.544724,0m0.220544,-4.058194l1.543807,0l0,8.164451l-1.543807,0l0,-8.164451zm7.939567,-4.473673l1.543805,0l0,16.999955l-1.543805,0l0,-16.999955zm-34.176663,8.126854l1.474036,0l0,0.747515l-1.474036,0l0,-0.747515zm61.677552,0.018809l1.474038,0l0,0.747515l-1.474038,0l0,-0.747515z" fill="#FF0000" id="svg_4" sides="3" stroke="#000000" stroke-dasharray="null" stroke-linecap="null" stroke-linejoin="null" stroke-width="null"/>
   <polygon cx="171.5" cy="159.5" edge="43.256342" fill="#ffffff" id="svg_5" orient="x" points="223.47406005859375,91.5 186.01296997070312,113.128173828125 186.01296997070312,69.871826171875 223.47406005859375,91.5 " shape="regularPoly" sides="3" stroke="#000000" stroke-width="null" strokeWidth="null" strokecolor="#000000"/>
   <line fill="none" id="svg_12" stroke="#000000" stroke-dasharray="null" stroke-linecap="null" stroke-linejoin="null" stroke-width="null" x1="171" x2="186" y1="103.5" y2="103.5"/>
   <path d="m130.801817,80.659041l15.333707,0l2.12165,-4.564833l3.47178,8.787299l3.857534,-8.901421l3.375353,8.787299l3.664657,-8.673176l3.664657,8.730237l2.025206,-4.279526l15.430142,0m-54.224016,-0.396526l1.274586,0l0,0.964554l-1.274586,0l0,-0.964554zm54.225414,-0.065616l1.274584,0l0,0.964554l-1.274584,0l0,-0.964554z" fill="none" id="svg_14" stroke="#000000" stroke-dasharray="null" stroke-linecap="null" stroke-linejoin="null" stroke-width="null"/>
   <line fill="none" id="svg_15" stroke="#000000" stroke-dasharray="null" stroke-linecap="null" stroke-linejoin="null" stroke-width="null" x1="171.5" x2="171.5" y1="103.75" y2="135.388167"/>
   <line fill="none" id="svg_16" stroke="#000000" stroke-dasharray="null" stroke-linecap="null" stroke-linejoin="null" stroke-width="null" x1="177.75" x2="177.75" y1="58.75" y2="80.255951"/>
   <line fill="none" id="svg_17" stroke="#000000" stroke-dasharray="null" stroke-linecap="null" stroke-linejoin="null" stroke-width="null" x1="223.75" x2="266.854524" y1="91.75" y2="91.75"/>
   <line fill="none" id="svg_18" stroke="#000000" stroke-dasharray="null" stroke-linecap="null" stroke-linejoin="null" stroke-width="null" x1="241.75" x2="241.75" y1="59.75" y2="91.754167"/>
   <line fill="none" id="svg_19" stroke="#000000" stroke-dasharray="null" stroke-linecap="null" stroke-linejoin="null" stroke-width="null" x1="168.25" x2="180.75" y1="135.75" y2="135.75"/>
   <line fill="none" id="svg_20" stroke="#000000" stroke-dasharray="null" stroke-linecap="null" stroke-linejoin="null" stroke-width="null" x1="169.75" x2="179.25" y1="138.5" y2="138.5"/>
   <line fill="none" id="svg_22" stroke="#000000" stroke-dasharray="null" stroke-linecap="null" stroke-linejoin="null" x1="171" x2="179.75" y1="141.25" y2="141.25"/>
  </g>
 </g>
 </svg>
All we need now is a little JavaScript. We do take note first that the element attribute “fill” is present. Then there is just the simple program that follows:
<html>
    <head>
    </head>
<body>
        <!-- ALL THE SVG FROM ABOVE GOES HERE -->
</body>
<html>
</svg>
<script>
  // Set up a timer interval flash the color.
  var gateElement = document.getElementById("svg_1");
  if ( gateElement ) {
      setInterval( () => {
                    var fillC = gateElement.getAttribute("fill");
                    gateElement.setAttribute("fill", (fillC == "#00FF00") ? "#FF0000" : "#00FF00" );
                  }, 2000 )

  }
</script>
Notice that what we have is a minimal HTML page. You can cut and paste the code into your favorite editor. And, then don’t forget to cut and paste the SVG to replace the comment. My version of Chrome requires the page to be HTML in order to have the JavaScript section. So, that is one browser still treating SVG as something separate. But, it is a long way from the <iframe> days.
If you cut and paste just right, you can bring up the page and see the AND gate go from red to green over and over.
Recommended reading: SVG Circle Decomposition To Paths
Building Panels From VUE Components
We are already on our way to making any single panel come alive, but if we want to manage large collections of panels in sensible ways, we would have our work cut out for us. That would especially be the case if we simply built on our first example.
While the first example shows us how we can asynchronously change an object view, it does not show us how to tie the view to the state of any data object let alone one that manages a machine. We can certainly understand how the setInterval demonstration can be replaced by a fetch handler, but we might not even get the state of a machine from the web server that serves the SVG containing page. Also, when we get the data, our programs are now required to know about the DOM structure of the given page.
Fortunately, frameworks such as Vue have become popular, and they can save us a lot of work.
It’s easy to find out about Vue. The Vue documentation is very accessible. So, if this discussion jumps too far ahead, then you may spend some time learning about Vue on its own web site. But, there are very good discussions within the Smashing pages. Krutie Patel wrote a stunning article on making an infographic. Souvik Sarkar tells us how to build a weather dashboard with Vue.
Group Selection Of Related Panels
For the first step, we should address searching for groups of panels. One reason for doing this first is that it is at the framework level of our human interactions.
The user searches for something he is interested in. Perhaps he is interested in all the devices at locations in one town. Perhaps he has many batches of liquid products and he wants to narrow down to one type of product with each batch governed by a small collection of IoT devices. So, the user will first search to get a small list.
Here is the process:
- Search for groups of panels by features/parameters.
- View a list of icons representing groups.
- Select an icon (click/tap).
- Start using panels identified with the icon when they come up.
Another reason this is a good first step is that we can use Vue in its simplest form. No build tools needed. We will just include vue.js with a script tag in HTML. In fact, we don’t even have to download it. There is a site where a working copy of vue.js is being served.
All we need is the following tag:
<script src="https://cdn.jsdelivr.net/npm/vue@2.6.7/dist/vue.js"></script>
I copied the script tag directly from the Vue documentation about installation.
Now, we need a web page that can load icons and make them into something that clicks. Vue makes that very easy. In fact, I just wrote a little app to manage a Twitter list using Vue. It just manages text fields. As it is a tiny bit simpler than an SPWA using icons, we can have a look at it and then change it to be our desired single page app framework.
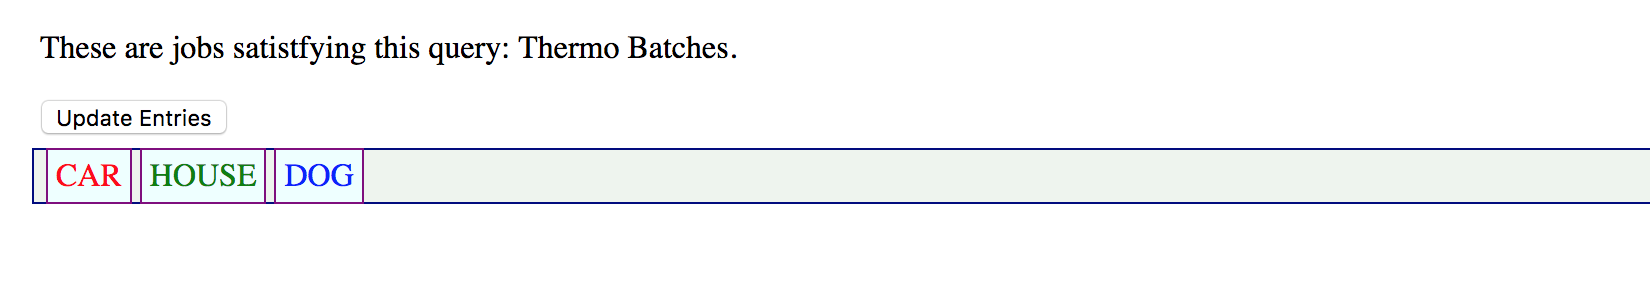
Here is part of what the page looks like:
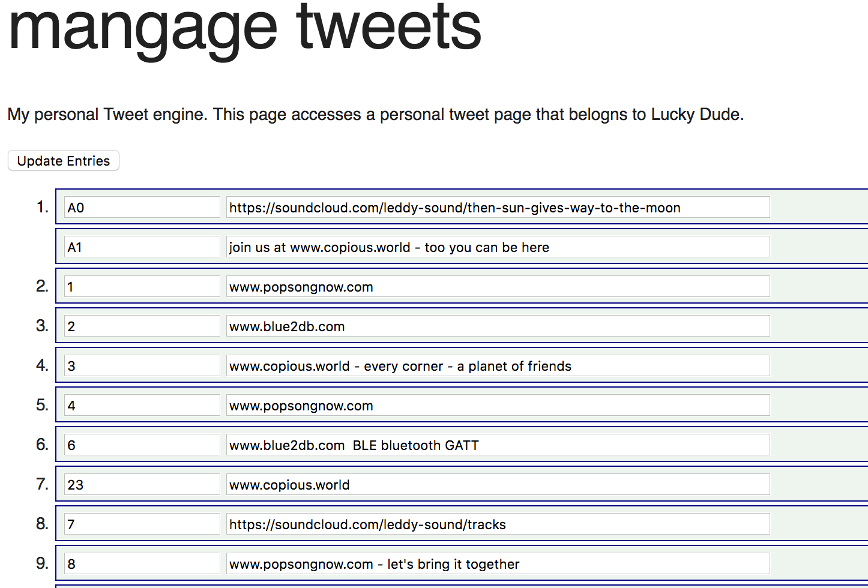
This looks like a fairly simple page. Each outer numerical entry is a time slot with one or two tweets in it. The second tweet is optional. If you edit a tweet, Vue mechanisms update a JavaScript object. This page leaves it up to the user to click the “update entries” button to tell the server that something has changed, via its button handler function.
In order for the button handler to relay data to the server, it must change the Vue data object into a JSON string. Now, you may wonder just how difficult translating a Vue object to JSON will be. It turns out to be one line of code. You can find the line in the following source code, but if you want to find it faster, it is highlighted in the paragraph after the source code.
The page looks simple. Looks can be deceiving. Of course, the page looks simple, but is the code simple? Yes, indeed it is! Using Vue, the page manages the contents of the fields almost magically. Here is the code:
<!DOCTYPE html>
<html lang="en" prefix="og: https://ogp.me/ns#">
  <!-- define microdata scope and type -->
  <head itemscope itemtype="https://schema.org/Article">
        <title>Tweet Keeper</title>
        <style>
            body {
                margin: 2em;
            }
            .entryart {
                border: solid 1px navy;
                width: 80%;
                padding: 2px;
                padding-left: 6px;
                margin-bottom: 3px;
                background-color: #EEF4EE;
            }
        </style>
        <script src="https://cdn.jsdelivr.net/npm/vue@2.6.7/dist/vue.js"></script>
    </head>
    <body onload="GetTweets()">  <!-- some old fashioned handling -->

        <!-- The Vue app starts here. This is the HTML part of the Vue object -->
        <div id="tweetAppDiv">  <!-- Recognize the name from the Vue doc -->
            <div itemscope itemtype="https://schema.org/Article">
                <h1 itemprop="name">mangage tweets</h1>
                <p itemprop="description">My personal Tweet engine.
                This page accesses a personal tweet page that belongs to {{tweetOwner}}.</p> <!-- {{tweetOwner}} is in the data model. -->
                <button onclick="sendTweets(event)">Update Entries</button>
            </div>

          <!-- Here is a Vue loop for generating a lit -->
          <ol>
            <li v-for="tweet in tweets">
                <!-- here is the first tweet represented as an object with a lable and tweet text -->
                <div class="entryart">
                    <input v-model="tweet.def[0].label" />
                    <input style="width:40%" v-model="tweet.def[0].tweet" />
                </div>
                <!-- here is the second tweet in the slot. But, notice that it is optional.  -->
                <div class="entryart" v-if="tweet.def.length > 1">
                    <input v-model="tweet.def[1].label"/>
                    <input style="width:40%" v-model="tweet.def[1].tweet"/>
                </div>
            </li>
          </ol>
        </div>
        <script>
            var twtApp = new Vue({
                                  el: '#tweetAppDiv',
                                  data: {
                                    tweets: [  // Where is the data? Still on the server.s
                                    ],
                                    tweetOwner : "Lucky Dude"  // picked a name for demo
                                  }
                            });
        </script>
    </body>
</html>
<script>

    // Notice that you don’t have to do everything in the Vue framework.
    // Here we are using some native API calls

    var gDefaultPostInfo = {  // there server is beyond simple - an example from node.js docs
        method: 'POST', // or 'PUT'
        mode: "cors", // no-cors, cors, *same-origin
        cache: "no-cache", // *default, no-cache, reload, force-cache, only-if-cached
        credentials: "same-origin", // include, *same-origin, omit
        redirect: "follow", // manual, *follow, error
        referrer: "no-referrer", // no-referrer, *client

        body: "",
        headers:{
            'Content-Type': 'application/json'
        }
    }
//
//
// recall the "onload"
function GetTweets(event) {
    var url = "https://localhost:8080/twitlist1.json"   // We have a fixed file name.
    fetch(url).then((response) => {  // this is now browser native
                    response.text().then((text) => {
                                         var newData = JSON.parse(text);  // DATA UPDATE! This is it.
                                         twtApp.tweets = newData   // the page update right away with new data.
                                    });
                    });
}

function sendTweets() {  // recall the button up above. This is not a Vue style button, but still in the Vue app.
    var url = "https://localhost:8080/"
    var data = twtApp.tweets;  // GET THE DATA OUT OF VUE. That’s all folks.
    //
    // so happens that Vue pulls out the right data and stringifies it.
    var jdata = JSON.stringify(data); // data can be `string` or {object}!
    //
    gDefaultPostInfo.body = jdata;  // that’s for fetch - not Vue related
    //
    fetch(url,gDefaultPostInfo).then(res => {  // We use fetch to POST as well as GET
                                        res.json()
                                   }).then(response => {
                                        console.log('Success:', JSON.stringify(response)) // promises
                                   }).catch(error => {
                                        console.error('Error:', error)
                                   });
}
//
//
//

</script>
So, just to highlight the amazing lines that speak to the power of the framework, let’s repeat here:
A. This is pulling the data out.
postOptionsObject.body = JSON.stringify(twtApp.tweets);
B. This is putting the data into Vue and seeing the screen update:
twtApp.tweets = JSON.parse(text) // text is the server response
How much work is that?
It looks like there is going to be a nice way to express how data will update panels for IoT.
Now, let’s turn the tweets into clickable icons designed to fetch components from the web server.
From Tweets To Panel Fetching Icons
People like to use SVG for icons. They like that use for SVG more than for other things as far as I can tell. I am only going on the number of web sites that sell or give away icons made in SVG. The selling point is that line graphics has fewer bytes than images. And, if I were going to ask for lists of pictures with button-like behavior, I might have grabbed for PNGs or JPEGs in the days SVG was in iframes. But, we can even find libraries in the Vue contributor lists that help us to a serving of icons.
We can turn the tweets page into an icon list returned as a search result. Just a little code has to be changed. Of course, there are a few things to be careful about if we want SVG icons to be loaded as buttons. Vue provides mechanisms for putting HTML into the application. These mechanisms have to be used or DOM elements fetched from the server don’t get interpreted.
Here is the kind of rendering you can get from view if you follow your first impulse in creating a handlebars style variable location in the application DOM.
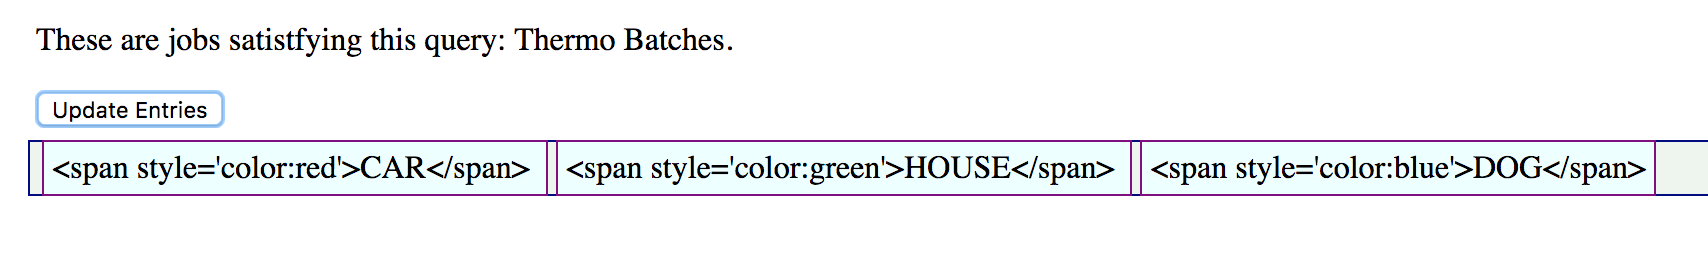
Here is the code that produces the result in the picture:
<div id="iconAppTry">
          <div class="entryart" style="padding:4px">
            <span class="oneItem" v-for="icon in iconList">
                {{icon}}
            </span>
          </div>
        </div>
        <script>
            var iconApp = new Vue({
                                  el: '#iconAppTry',
                                  data: {
                                    iconList: [  // Where is the data? Still on the server.
                                    ],
                                    queryToken : "Thermo Batches"  // picked a name for demo
                                  }
                            });
        </script>
Notice that we have gone from looping over tweets to looping over icons. tweet in tweets changed into icon in iconList. Our twtApp hooks into the DOM element #tweetAppDiv, while our iconApp hooks into the DOM element #iconAppTry. Within the Vue option object, the data subobject has a tweets in the first app, and iconList in the second. The fields are both empty arrays that receive data when the fetch routine does its job.
But, we have imitated our tweet app too closely. In the code above, the iconList is an array, and the server is expected to send an array of strings. So, let’s say the server has sent us HTML, and we have it properly decoded with the array assigned to data.iconList. Then, the picture above can be seen.
Now, let’s change the code just a little. In this revised code, we can see the following:
v-html="icon">Vue responds to the v-html syntax by putting in the DOM of the icon element. Notice that the syntax is included after the loop directive as another attribute to the span tag.
By removing the handlebars syntax and using v-html, our picture changes to something more comprehensible:
 <div id="iconAppTry2">
          <div class="entryart" style="padding:4px">
            <span class="oneItem" v-for="icon in iconList" v-html="icon">
            </span>
          </div>
        </div>
        <script>
            var iconApp = new Vue({
                                  el: '#iconAppTry2',
                                  data: {
                                    iconList: [  // Where is the data? Still on the server.
                                    ],
                                    queryToken : "Thermo Batches"  // picked a name for demo
                                  }
                            });
        </script>
While v-html is a quick way to do things, the Vue team recommends using components to get the desired HTML into the page. That seems like a good idea, and we shall soon set about doing that.
But, let’s use the v-html syntax for our next example.
It’s time to set up our working example for fetching SVG icons. Let’s have those icons be responsive to a button click. Once those are working, we can get the panels associated with an icon.
Let’s suppose that the SVG required for icons is stored in a database. For our example, we can just fetch a JSON file from the server. The grown-up version of the icon server would store many such files in a database, and deliver them to the page with the same mechanisms.
Also, it’s best if the SVG arrives on the page URL encoded since we will be using JSON parse. The SVG can be decoded by calling JavaScript’s decodeURIComponent function.
In order to simulate the response to searching, we can make use of several JSON files. The page can have one button for each file. Here is the code for the page:
<!DOCTYPE html>
<html lang="en" prefix="og: https://ogp.me/ns#">
<!-- define microdata scope and type -->
<head itemscope itemtype="https://schema.org/Article">
<title>Search Bar</title>
<style>
body {
margin: 2em;
}
div {
margin: 6px;
}
.entryart {
border: solid 1px navy;
width: 80%;
padding: 2px;
padding-left: 6px;
margin: 2px;
margin-bottom: 3px;
background-color: #EEF4EE;
}
.oneItem {
background-color: #EEFFFF;
margin: 2px;
padding: 4px;
border: solid 1px purple;
}
</style>
<script src="https://cdn.jsdelivr.net/npm/vue@2.6.7/dist/vue.js"></script>
</head>
<body> <!-- some old fashioned handling -->
<!-- The Vue app starts here. This is the HTML part of the Vue object -->
<div id="iconAppTry"> <!-- Recognize the name from the Vue doc -->
<div>
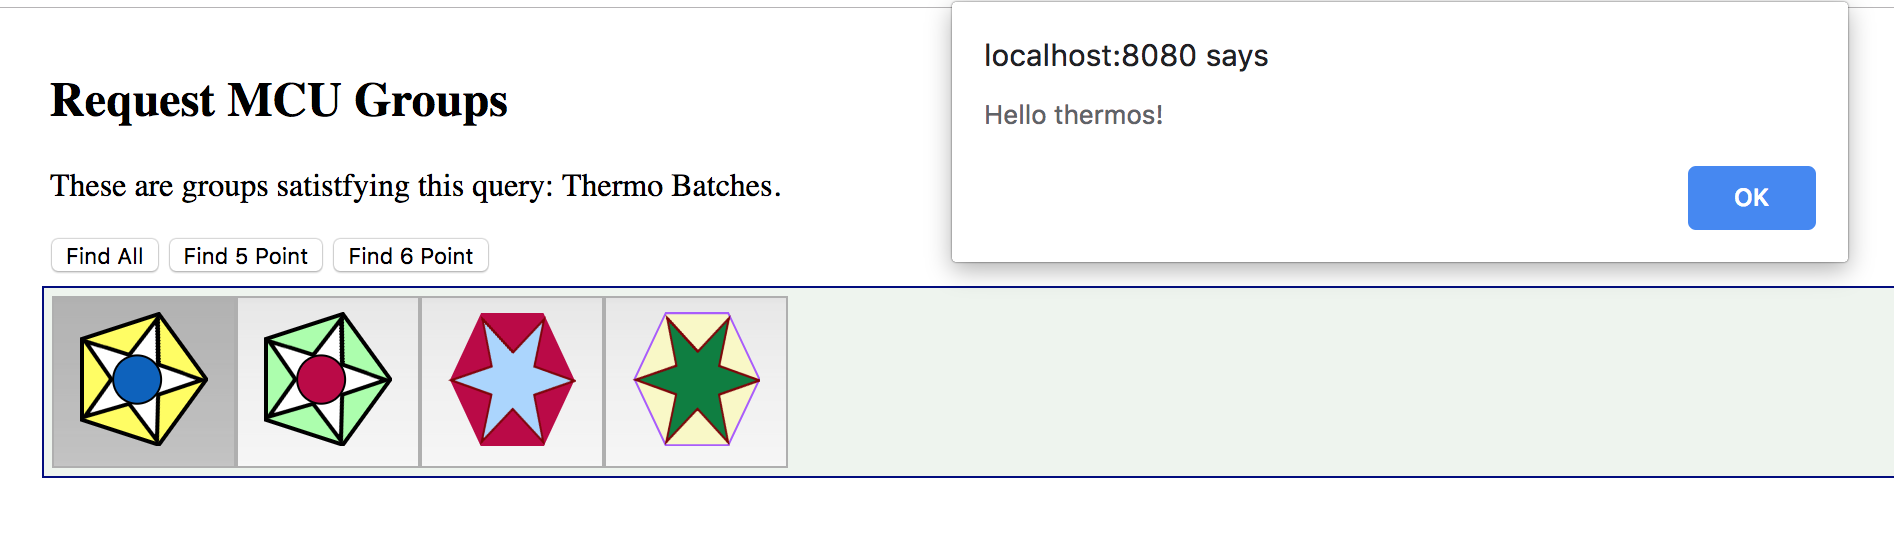
<h2 itemprop="name">Request MCU Groups</h2>
<p itemprop="description">These are groups satistfying this query: {{queryToken}}.</p> <!-- {{tweetOwner}} is in the data model. -->
<button onclick="GetIcons(11)">Find All</button>
<button onclick="GetIcons(5)">Find 5 Point</button>
<button onclick="GetIcons(6)">Find 6 Point</button>
</div>
<!-- Here is a Vue loop for generating a lit -->
<div class="entryart" style="padding:4px">
<button v-for="iconEntry in iconList" @click="goGetPanel(iconEntry.name)" >
<div v-html="iconEntry.icon">
</div>
</button>
</div>
</div>
<script>
var iconApp = new Vue({
el: '#iconAppTry',
data: {
iconList: [ // Where is the data? Still on the server.
],
queryToken : "Thermo Batches" // picked a name for demo
},
methods : {
goGetPanel: (pname) => {
// `this` inside methods points to the Vue instance
alert('Hello ' + pname + '!')
}
}
});
</script>
</body>
</html>
<script>
//
// recall the "onclick" on the <buttons>
function GetIcons(points) {
// special file names instead of search parameters
//
var url = (points == 11) ? "https://localhost:8080/batchQuery-all.json"
: ((points == 5) ? "https://localhost:8080/batchQuery-five.json" : "https://localhost:8080/batchQuery-six.json")
fetch(url).then((response) => { // this is now browser native
response.text().then((text) => {
var newData = JSON.parse(text); // DATA UPDATE! This is it.
newData = newData.map(obj => {
obj.icon = decodeURIComponent(obj.icon);
return(obj)
});
iconApp.iconList = newData; // the page update right away with new data.
});
});
}
</script>
Here is one display of icons that have been fetched from the server:
The data being sent is an array with the following kind of structure:
{
 "style" : {
     "color" : "red",
     "backgroundColor" : "yellow"
 },
 "icon" : svg1,
 "name" : "thermos"
},
Here, svg1 is SVG taken from a file. Of course, a righteous server would have taken the structure from a database, where the SVG would be stored in the structure.
Here is a snippet from the above code. This is the code that fetches the JSON and places the array of structures into the Vue app. You can see the promise structure of fetch in use. The text is parsed, and in the next line, the encoded SVG is decoded. One more line, and Vue updates the page. The number of buttons in the button bar will be equal to the length of the JSON array.
fetch(url).then((response) => {  // this is now browser native
    response.text().then((text) => {
             var newData = JSON.parse(text);  // DATA UPDATE! This is it.
                newData = newData.map(obj => {
                           obj.icon = decodeURIComponent(obj.icon);
                           return(obj)
                       });
             // the page update right away with new data.
             iconApp.iconList = newData;
        });
});
Now, just two more snippets. The Vue app. The reader will notice that the @click directive has been included on the buttons. The data element, iconEntry.name, is passed to a method within quotes.
The method is defined within the Vue app:
<div class="entryart" style="padding:4px">
<button v-for="iconEntry in iconList" @click="goGetPanel(iconEntry.name)" >
    <div v-html="iconEntry.icon">
    </div>
</button>
</div>
</div>
Here is the snippet for the definition of methods. The methods object is added just after the data object within the app parameter object:
,
methods: {
  goGetPanel: (pname) => {
      // `this` inside methods points to the Vue instance
      alert('Hello ' + pname + '!')
  }
}
The reader should find the goGetPanel definition, and the use of it was pointed out for the @click handler. In our final application, the alert call can be replaced by a function that fetches panels from the server.
A Component Library For IoT Panels
We could just decide that panels that we fetch from the server can be HMTL or just SVG drawings, but if there are going to be many kinds of panels, we would hope that the job of creating panels could be simplified by having libraries of components to choose from. We can imagine that SVG editors could be improved to allow library components to be dropped onto pictures as part of editing. Then, if the SVG editor could output a version of the picture with component tags, then the use of Vue would allow the picture to be created while ensuring that the JavaScript automation and animation is neatly woven together. For our discussion, some hand editing can help us get there.
If we want to create panels out of Vue components, then we had better figure out how to make the components and then collect them together into something useful. We will have to switch to using command line tools provided by Vue and organize our workflow.
Components
The Vue documentation points out that the component data section (subobject) of the component definition needs to be a function that returns data. The reason for this is that Vue needs to keep data separate among the instances. So, in going from a Vue application initialization to a component definition there is another small code change.
In this first snippet of code a Vue application is being initialized:
var iconApp = new Vue({
      el: '#iconApp',
      data: {  // this is the data field that can be easily updated
      },
      methods : {
        ...
      }
});
In this new snippet of code, a component is being defined and registered. First, notice that instead of creating a new Vue instance, a component named iconic is being registered. Then, the data field returns custom data for any iconic instance that the Vue app makes. Finally, the template field is present at the end of the component registration. Any HTML that might have been written on the web page to display the component can be part of the template.
Vue.component('iconic',
          data: () => {
            var instanceData = {
                // data fields named for the
                // variables appearing in the template
                onevar : "test"
            }
            return(instanceData);
          },
          methods : {
            ...
          },
          template: '<div>This appears in every instance {{onevar}}</div>'
    });
So, we can imagine a panel with thermometers. So, if someone provided a thermometer component, we would expect a component definition somewhere in our code. As such:
Vue.component('thermometer',
          data: () => {
            var instanceData = {
                // data fields named for the
                // variables appearing in the template
                temperature : 0
            }
            return(instanceData);
          },
          methods : {
            ...
          },
          template: '<div>Some SVG will go here</div>'
    });
We are trying to create something that looks like this:
The thermometer component is very similar to the first components that you will come across in the Vue tutorials. But, it’s a little tricky to figure out how to update it. There is a better way of defining the component for reactivity using properties. And, that is in the following:
Vue.component('thermometer', {
    props: ['temperature'],
    computed : {
        y: function() {
            var t = this.temperature/100;
            var h = 54.724472;
            var y_bar = 41.176476  // starts near the top
            // pretend the scale is 1 to 100, so that the temperature is a precentage
            return((1 - t)*h + y_bar)
        },
        height : function() {
            var t = this.temperature/100;
            var h = 54.724472; // as high as the whole range
            var y_bar = 41.176476
            // pretend the scale is 1 to 100, so that the temperature is a precentage
            return(t*h)
        }
    },
    template: '#thermometer-template'
})
So, instead of representing temperature as a data element. It is represented as a property under props. Then, there is a new section, computed, that provides variables that are functions of the property. We see this.temperature being used for both y and height. These computed variables are being used in the SVG as attributes for a rectangle.
In SVG, y grows from the top down. So, when we want the rectangle to be small at the bottom of the thermometer, the y of the red box has to be lower, and the height has to be reduced so that (y + height) stays at the thermometer zero.
Notice the template field in the definition of the components. It is in fact, a document element ID. The element being referred to is a script section with the special type: type="text/x-template". The script element is where the SVG for the thermometers is. And, the SVG makes use of Vue variables and control terms so that reactivity can be defined.
Here is some of the SVG:
<script type="text/x-template" id="thermometer-template">
<svg
   xmlns:svg="https://www.w3.org/2000/svg"
   xmlns="https://www.w3.org/2000/svg"
   width="20"
   height="70"
   version="1.1"
  >
  <g transform="translate(0,-180)">
    <g transform="matrix(2.0111869,0,0,1.0489665,-215.11053,144.5592)">
      <rect
         style="fill:#fffcfc;stroke:#000000;stroke-width:0.68848258;stroke-miterlimit:4;stroke-dasharray:none"
         stroke-linecap="null" stroke-linejoin="null" width="2.9665921" height="54.724472" x="111.90748" y="41.176476" />
      <rect
         style="fill:#e82b0d;stroke:#000000;stroke-width:0.68848258;stroke-miterlimit:4;stroke-dasharray:none"
         stroke-linecap="null"
         stroke-linejoin="null"
         width="2.9665921"
         x="111.90748"
         :height="height"
         :y="y"
      />
      <g transform="matrix(0.76503813,0,0,1,26.586929,0)">
        <line y2="57.306953" y1="57.306953" x2="113.15423" x1="107.22105" stroke-linejoin="null" stroke-linecap="null"
           style="fill:none;stroke:#000000;stroke-width:0.787139;stroke-miterlimit:4;stroke-dasharray:none" />
        <line y2="74.408356" y1="74.408356" x2="113.15423" x1="107.22105" stroke-linejoin="null" stroke-linecap="null"
The reader can find id="thermometer-template" at the top, and looking further down to the rect elements, the computed variables can be found.
Here the variable uses are separated out. The Vue shorthand syntax for v-bind is in use, with :height="height" and the same for y:
 x="111.90748"
         :height="height"
         :y="y"
When the parent of the SVG elements sets variables that act as input to the thermometer property temperature, Vue recalculates height and y. As a result, the position and height of the red box change.
It helps to have a listing of the Vue app that makes use of the thermometer.
<body>
<!-- The Vue app starts here. This is the HTML part of the Vue object -->
<div id="thermoApp"> <!-- Recognize the name from the Vue doc -->
<div>
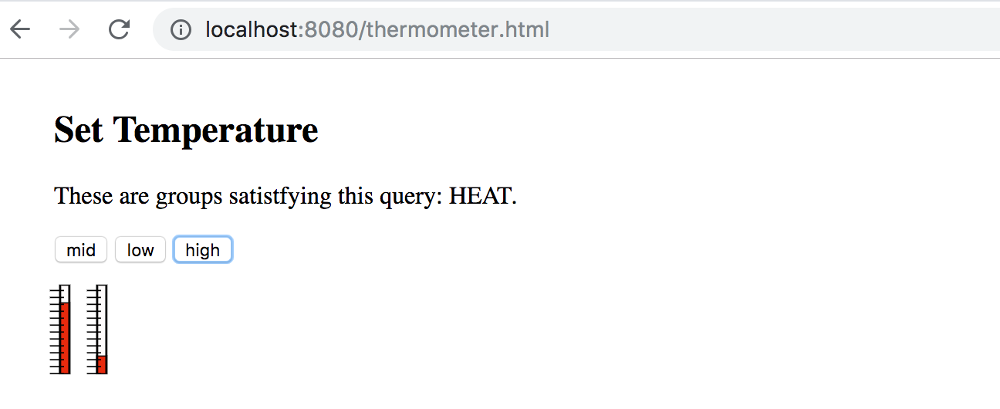
<h2 itemprop="name">Set Temperature</h2>
<p itemprop="description">These are groups satistfying this query: {{queryToken}}.</p> <!-- {{tweetOwner}} is in the data model. -->
<button @click="updateTemp(50,50)">mid</button>
<button @click="updateTemp(20,80)">low</button>
<button @click="updateTemp(80,20)">high</button>
</div>
<thermometer :temperature="temp1" ></thermometer>
<thermometer :temperature="temp2" ></thermometer>
</div>
<script>
var thermoApp = new Vue({
el: '#thermoApp',
data: {
temp1 : 30,
temp2 : 60,
queryToken : "HEAT"
},
methods : {
updateTemp: function (tval1,tval2) {
this.temp1 = tval1;
this.temp2 = tval2;
}
}
});
</script>
</body>
That is the whole thing. There are three buttons which call the updateTemp method of the thermoApp Vue application. The data section has two temperature variables. And, each thermometer updates its temperature when the values change.
The code for the two thermometers called out below can be found on the HTML assigned to the Vue app.
<thermometer :temperature="temp1" ></thermometer>
        <thermometer :temperature="temp2" ></thermometer>
Notice that application uses the function formalism for the method definition. Defining updateTemp this way updateTemp: function (tval1,tval2) allows for the instance variable this to be accessed.
Also, defining updateTemp this way updateTemp: (tval1,tval2) => assigns this to an internal data structure that does not react and update the view.
Assembling A Panel
Each IoT panel can be a component. Vue provides a way of defining components with subcomponents. Alternatively, there is a slot mechanism that can be used to yield a component that can wrap around any HTML content.
In the following few paragraphs, let’s look at making a panel out of subcomponents. There are two forms that follow quickly from our examples. In one case, the thermometers can be subcomponents called out in JavaScript. In another case, the components are defined independently but are mentioned in the HTML.
In both cases, the same HTML can be used for the template. Here is our panel as a template:
<script type="text/x-template" id="thermo-panel-template">
    <div>
        <thermometer :temperature="temp1" ></thermometer>
        <thermometer :temperature="temp2" ></thermometer>
    </div>
</script>
The only difference between the first detailing of the application is that a div element is surrounding the two thermometers. Vue will throw an error if the template is missing a top level DOM element. The div passes the Vue requirement, and the multiple elements may be included inside of it.
Now, we may see the two thermometers side by side. Passing the temperatures from the top to the final thermometer has values cascading down. At the top level, the panel joins the application when a single line is included in the application DOM.
<themo-panel :temp1="temp1" :temp2="temp2" ></themo-panel>The template for the panel, although simple, seems to indicate that panels can be easily designed in term of components. It’s as if a language for just IoT components is possible.
Now, the template definition for the panel is simple enough. Here it is with the subcomponents defined independently:
Vue.component('thermo-panel', {
              props: ['temp1','temp2'],
              template: '#thermo-panel-template'
            });
That is about as much as is required to make the panel functional. It is true that this version relies on a long list of properties for defining values to be updated as messages come into the page. But, this is a good start. Updating the data object at the top level does the job of animating the thermometers. However, as the panels become complicated, there may need to be another method for showing change.
Having made mention to the other ways of specifying subcomponents, for the panel, we should take a look at it. Here it is:
Vue.component('thermo-panel', {
              props: ['temp1','temp2'],
              template: '#thermo-panel-template',
              components: {
                // a sub component for the labels
                'thermometer': {
                  props: {
                    temperature: Number,
                  },
                  template: '#thermometer-template',
                  computed : {
                    y: function() {
                        var t = this.temperature/100;
                        var h = 54.724472;
                        var y_bar = 41.176476  // starts near the top
                        // pretend the scale is 1 to 100, so that the temperature is a precentage
                        return((1 - t)*h + y_bar)
                    },
                    height : function() {
                        var t = this.temperature/100;
                        var h = 54.724472; // as high as the whole range
                        var y_bar = 41.176476
                        // pretend the scale is 1 to 100, so that the temperature is a precentage
                        return(t*h)
                    }
                  }
              }
            }
        });
There is certainly more code, but that is because the JavaScript for the thermometer component is included within the components list of thermo-panel. The two approaches do the same job, but they offer different ways of packaging component definitions.
At the moment, my preference is for the first way. It should be considerably easier to revise panels and have them retrieved dynamically if only changing template and properties is required. To this end, the independently defined components form a component library. But, although that seems better, in the following it becomes more convenient to use the second, seemingly more verbose way.
Given that we can make responsive panels out of components in clearly defined ways, I’ll explain how we can manage them as a database that can make simple queries in the next part of my article.
Further Reading
- Converting Plain Text To Encoded HTML With Vanilla JavaScript
- The Forensics Of React Server Components (RSCs)
- How To Deal With Big Tooling Upgrades In Large Organizations
- Better Context Menus With Safe Triangles


