I Used The Web For A Day On A 50 MB Budget

Email Newsletter
Weekly tips on front-end & UX.
Trusted by 182,000+ folks.

 Custom Web Forms for Angular, React, & Vue. Your backend.
 Celebrating 10 million developers

This article is part of a series in which I attempt to use the web under various constraints, representing a given demographic of user. I hope to raise the profile of difficulties faced by real people, which are avoidable if we design and develop in a way that is sympathetic to their needs.
Last time, I navigated the web for a day using Internet Explorer 8. This time, I browsed the web for a day on a 50 MB budget.
Why 50 MB?
Many of us are lucky enough to be on mobile plans which allow several gigabytes of data transfer per month. Failing that, we are usually able to connect to home or public WiFi networks that are on fast broadband connections and have effectively unlimited data.
But there are parts of the world where mobile data is prohibitively expensive, and where there is little or no broadband infrastructure.
"People often buy data packages of just tens of megabytes at a time, making a gigabyte a relatively large and therefore expensive amount of data to buy.
— Dan Howdle, consumer telecoms analyst at Cable.co.uk"
Just how expensive are we talking?
The Cost Of Mobile Data
A 2018 study by cable.co.uk found that Zimbabwe was the most expensive country in the world for mobile data, where 1 GB cost an average of $75.20, ranging from $12.50 to $138.46. The enormous range in price is due to smaller amounts of data being very expensive, getting proportionally cheaper the bigger the data plan you commit to. You can read the study methodology for more information.
Zimbabwe is by no means a one-off. Equatorial Guinea, Saint Helena and the Falkland Islands are next in line, with 1 GB of data costing $65.83, $55.47 and $47.39 respectively. These countries generally have a combination of poor technical infrastructure and low adoption, meaning data is both costly to deliver and doesn’t have the economy of scale to drive costs down.
Data is expensive in parts of Europe too. A gigabyte of data in Greece will set you back $32.71; in Switzerland, $20.22. For comparison, the same amount of data costs $6.66 in the UK, or $12.37 in the USA. On the other end of the scale, India is the cheapest place in the world for data, at an average cost of $0.26. Kyrgyzstan, Kazakhstan and Ukraine follow at $0.27, $0.49 and $0.51 per GB respectively.
The speed of mobile networks, too, varies considerably between countries. Perhaps surprisingly, users experience faster speeds over a mobile network than WiFi in at least 30 countries worldwide, including Australia and France. South Korea has the fastest mobile download speed, averaging 52.4 Mbps, but Iraq has the slowest, averaging 1.6 Mbps download and 0.7 Mbps upload. The USA ranks 40th in the world for mobile download speeds, at around 34 Mbps, and is at risk of falling further behind as the world moves towards 5G.
As for mobile network connection type, 84.7% of user connections in the UK are on 4G, compared to 93% in the USA, and 97.5% in South Korea. This compares with less than 50% in Uzbekistan and less than 60% in Algeria, Ecuador, Nepal and Iraq.
The Cost Of Broadband Data
Meanwhile, a study of the cost of broadband in 2018 shows that a broadband connection in Niger costs $263 ‘per megabit per month’. This metric is a little difficult to comprehend, so here’s an example: if the average cost of broadband packages in a country is $22, and the average download speed offered by the packages is 10 Mbps, then the cost ‘per megabit per month’ would be $2.20.
It’s an interesting metric, and one that acknowledges that broadband speed is as important a factor as the data cap. A cost of $263 suggests a combination of extremely slow and extremely expensive broadband. For reference, the metric is $1.19 in the UK and $1.26 in the USA.
What’s perhaps easier to comprehend is the average cost of a broadband package. Note that this study was looking for the cheapest broadband packages on offer, ignoring whether or not these packages had a data cap, so provides a useful ballpark figure rather than the cost of data per se.
On package cost alone, Mauritania has the most expensive broadband in the world, at an average of $768.16 (a range of $307.26 to $1,368.72). This enormous cost includes building physical lines to the property, since few already exist in Mauritania. At 0.7 Mbps, Mauritania also has one of the slowest broadband networks in the world.
Taiwan has the fastest broadband in the world, at a mean speed of 85 Mbps. Yemen has the slowest, at 0.38 Mbps. But even countries with good established broadband infrastructure have so-called ‘not-spots’. The United Kingdom is ranked 34th out of 207 countries for broadband speed, but in July 2019 there was still a school in the UK without broadband.
The average cost of a broadband package in the UK is $39.58, and in the USA is $67.69. The cheapest average in the world is Ukraine’s, at just $5, although the cheapest broadband deal of them all was found in Kyrgystan ($1.27 — against the country average of $108.22).
Zimbabwe was the most costly country for mobile data, and the statistics aren’t much better for its broadband, with an average cost of $128.71 and a ‘per megabit per month’ cost of $6.89.
Absolute Cost Vs Cost In Real Terms
All of the costs outlined so far are the absolute costs in USD, based on the exchange rates at the time of the study. These costs have not been accounted for cost of living, meaning that for many countries the cost is actually far higher in real terms.
I’m going to limit my browsing today to 50 MB, which in Zimbabwe would cost around $3.67 on a mobile data tariff. That may not sound like much, but teachers in Zimbabwe were striking this year because their salaries had fallen to just $2.50 a day.
For comparison, $3.67 is around half the $7.25 minimum wage in the USA. As a Zimbabwean, I’d have to work for around a day and a half to earn the money to buy this 50MB data, compared to just half an hour in the USA. It’s not easy to compare cost of living between countries, but on wages alone the $3.67 cost of 50 MB of data in Zimbabwe would feel like $52 to an American on minimum wage.
Setting Up The Experiment
I launched Chrome and opened the dev tools, where I throttled the network to a slow 3G connection. I wanted to simulate a slow connection like those experienced by users in Uzbekistan, to see what kind of experience websites would give me. I also throttled my CPU to simulate being on a lower end device.

I installed ModHeader and set the ‘Save-Data’ header to let websites know I want to minimise my data usage. This is also the header set by Chrome for Android’s ‘Lite mode’, which I’ll cover in more detail later.
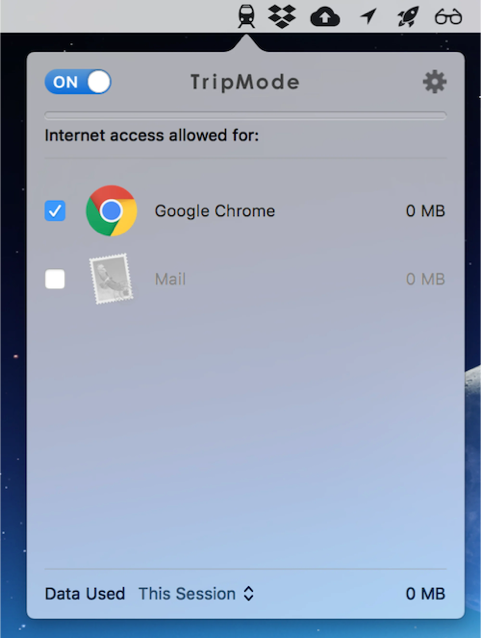
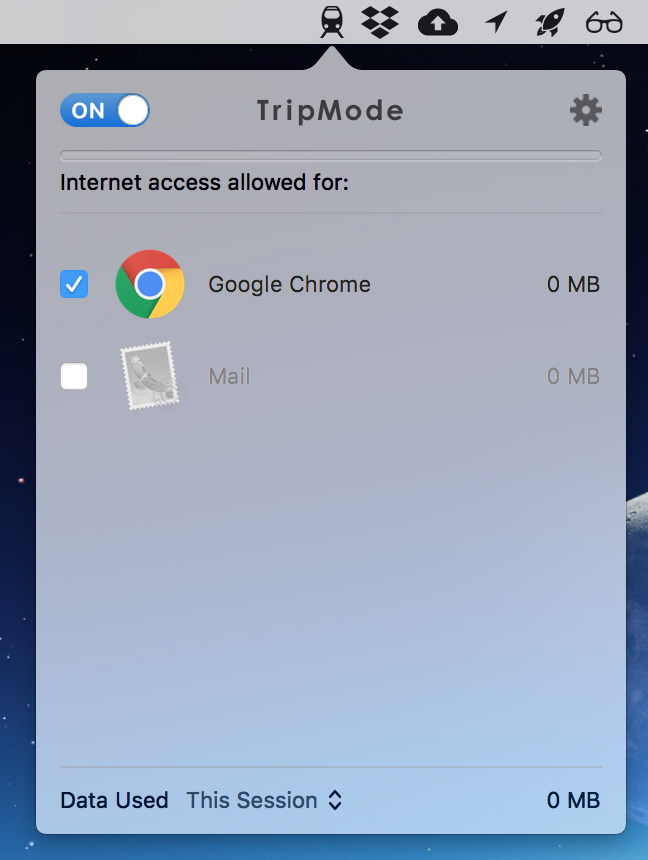
I downloaded TripMode; an application for Mac which gives you control over which apps on your Mac can access the internet. Any other application’s internet access is automatically blocked.
How far do I predict my 50 MB budget will take me? With the average weight of a web page being almost 1.7 MB, that suggests I’ve got around 29 pages in my budget, although probably a few more than that if I’m able to stay on the same sites and leverage browser caching.
Throughout the experiment I will suggest performance tips to speed up the first contentful paint and perceived loading time of the page. Some of these tips may not affect the amount of data transferred directly, but do generally involve deferring the download of less important resources, which on slow connections may mean the resources are never downloaded and data is saved.
The Experiment
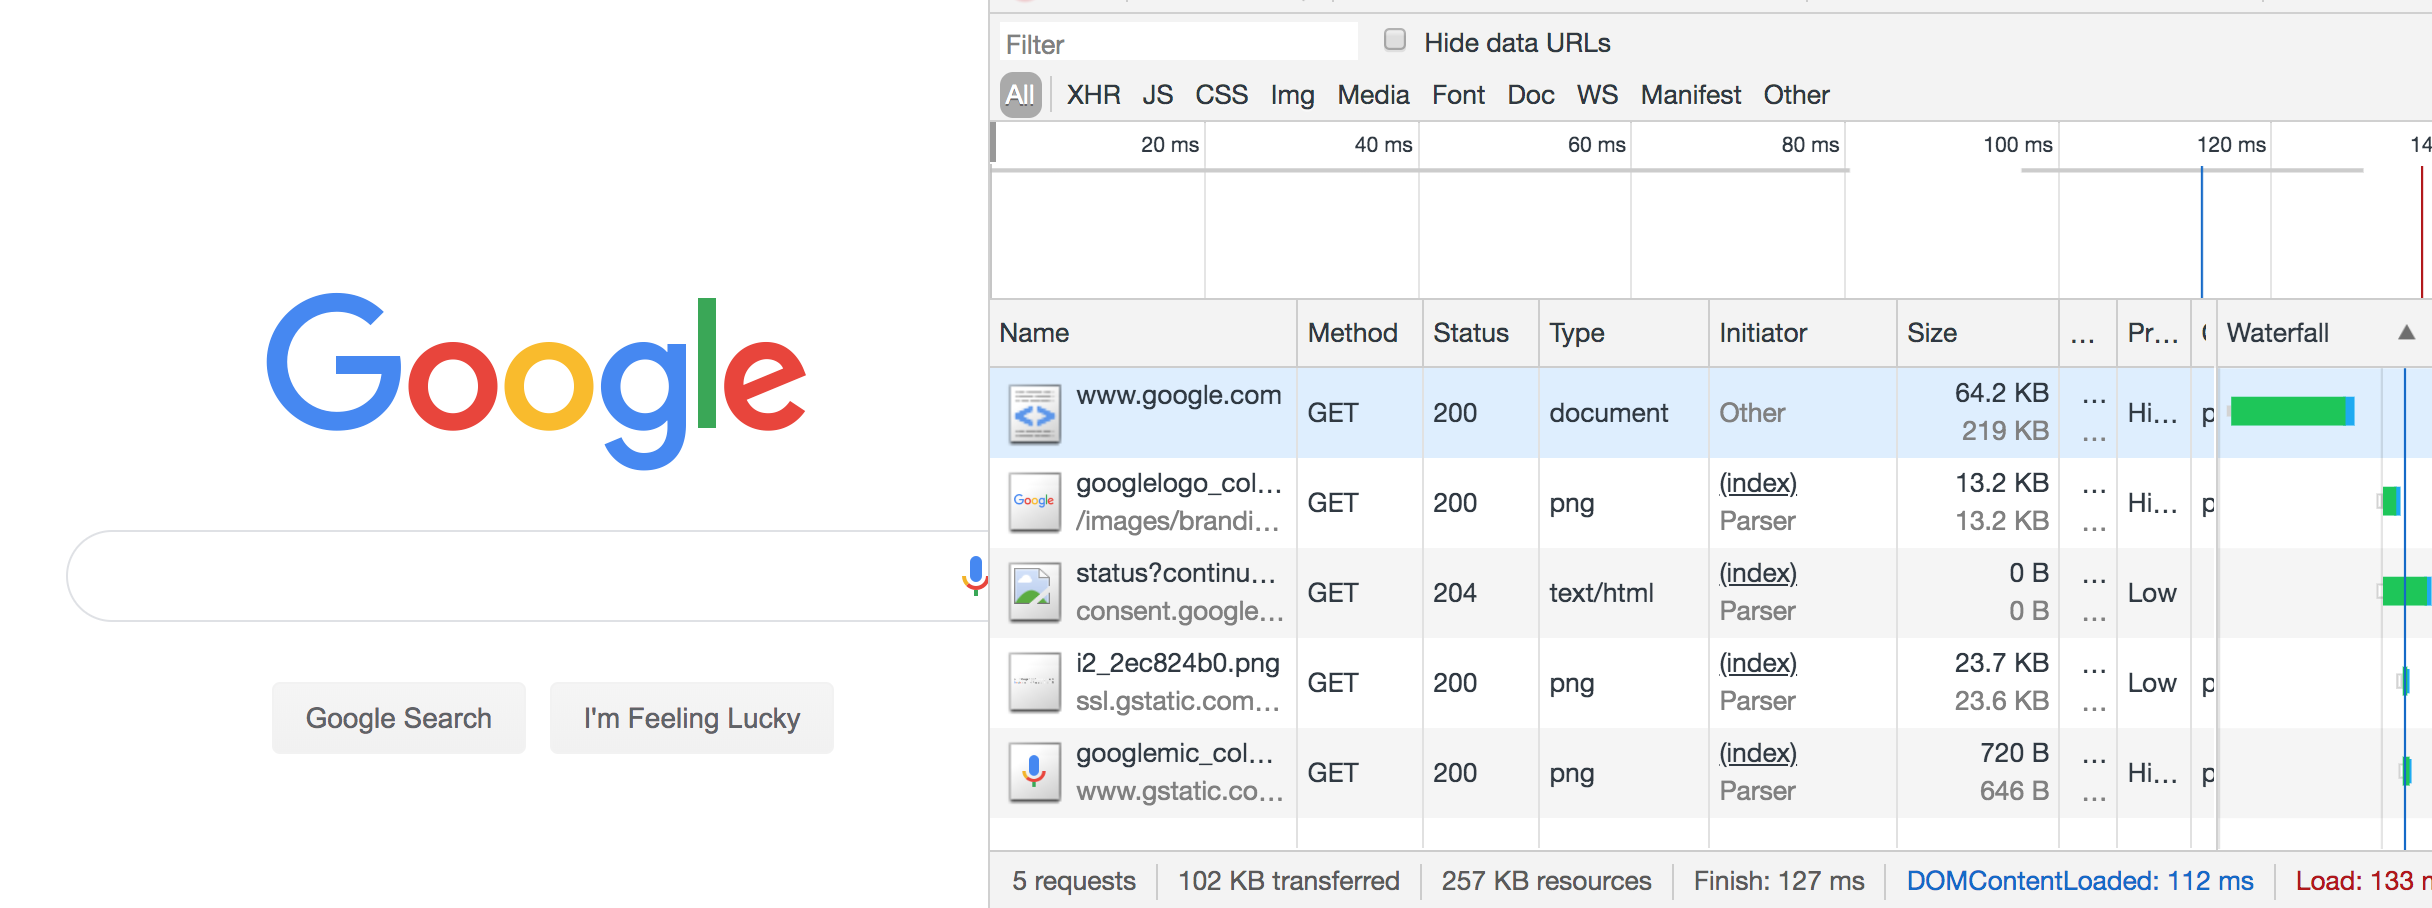
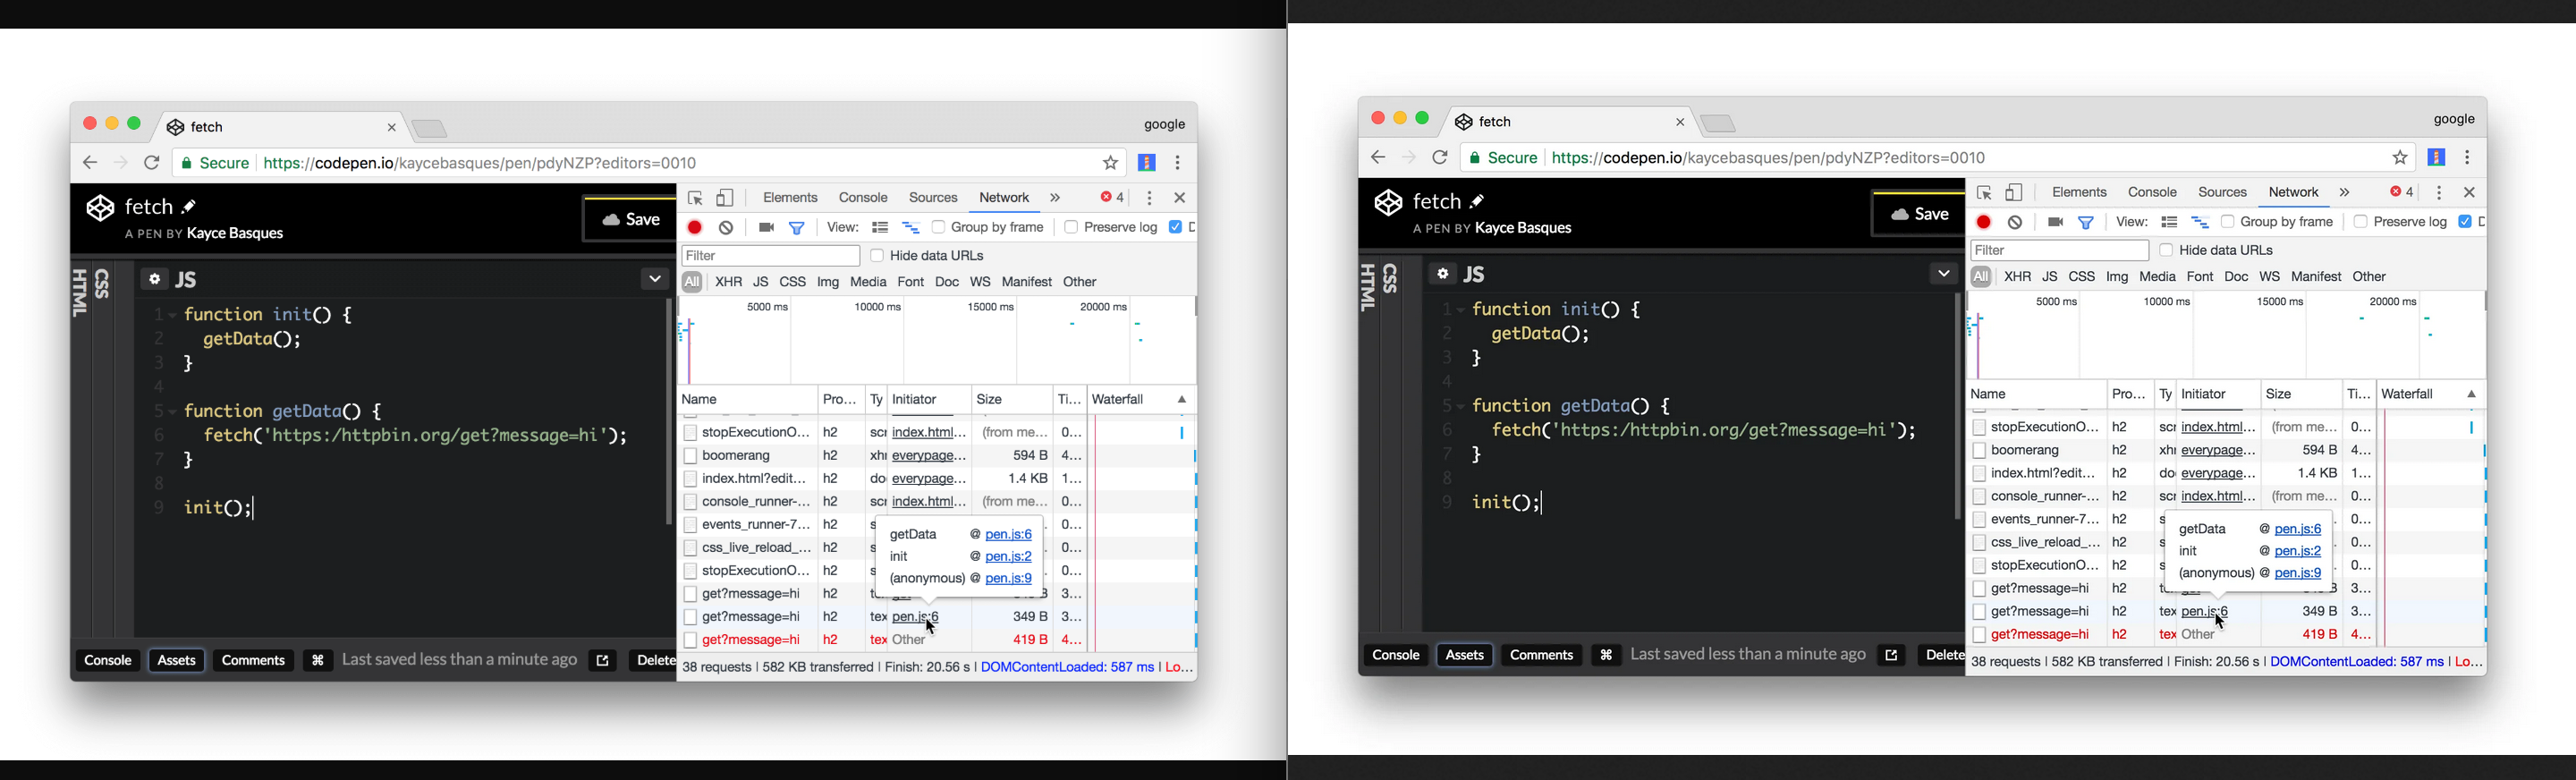
Without any further ado, I loaded google.com, using 402 KB of my budget and spending $0.03 (around 1% of my Zimbabwe budget).
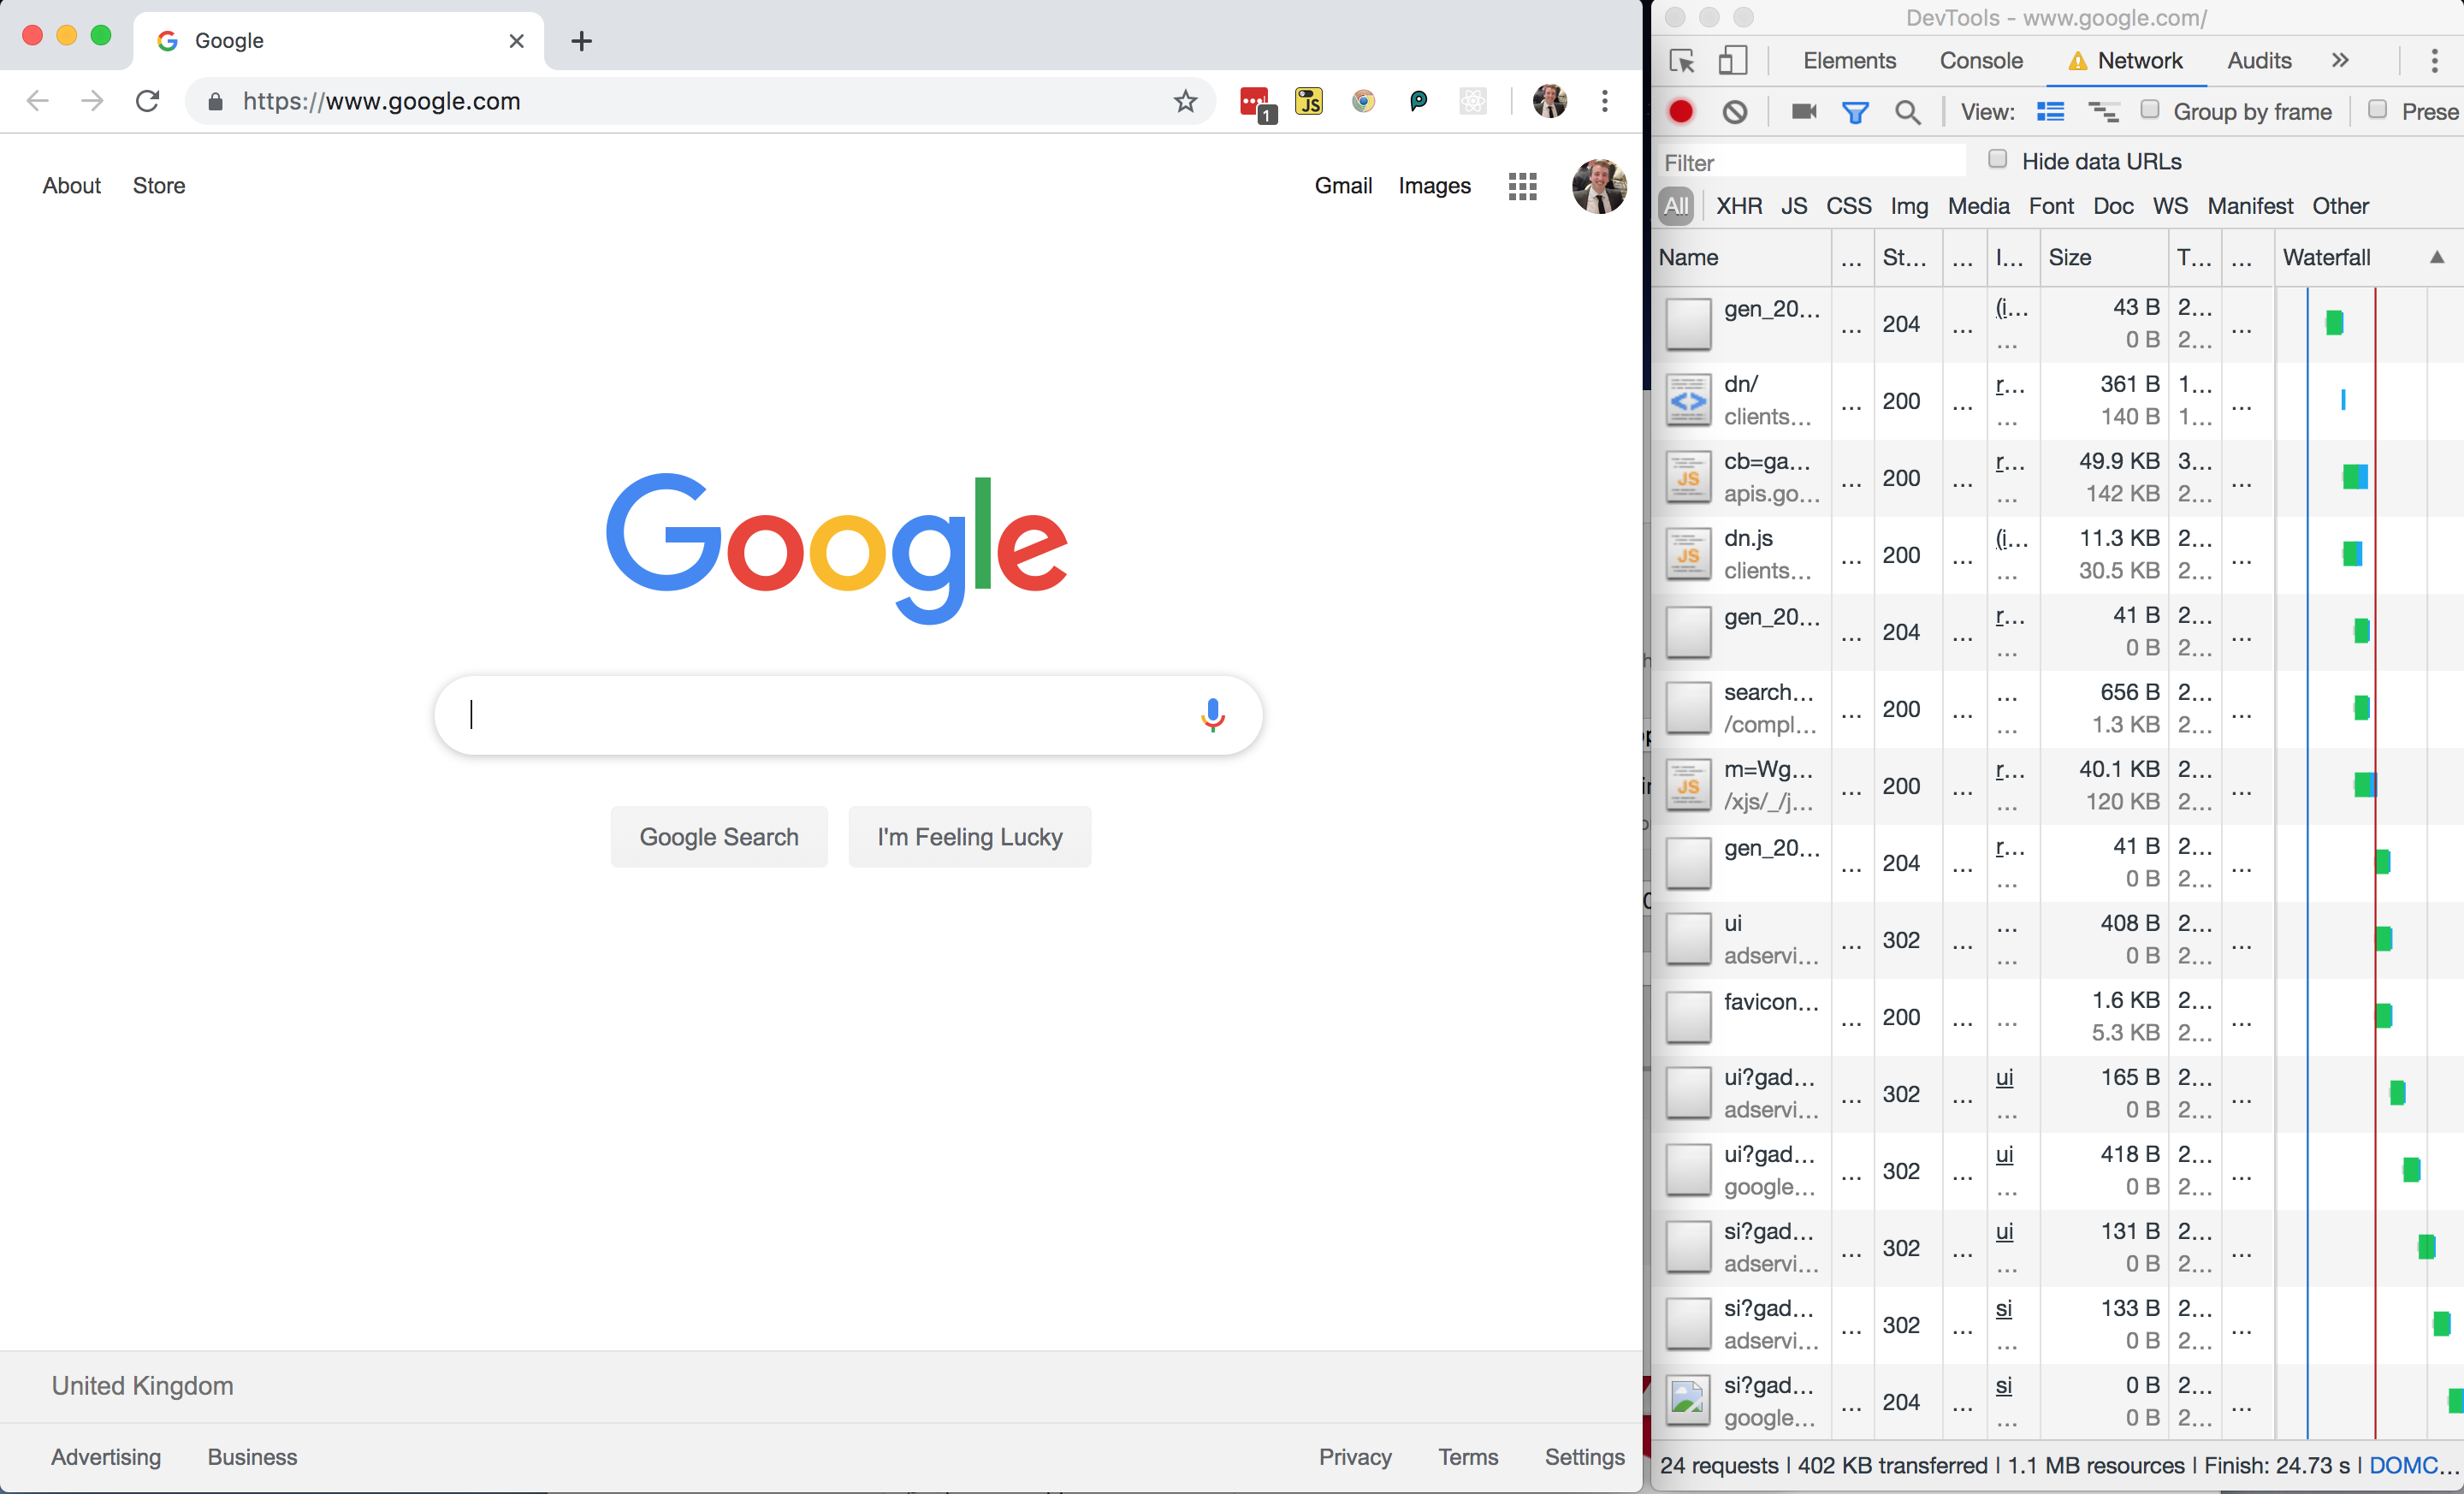
All in all, not a bad page size, but I wondered where those 24 network requests were coming from and whether or not the page could be made any lighter.
Google Homepage — DOM
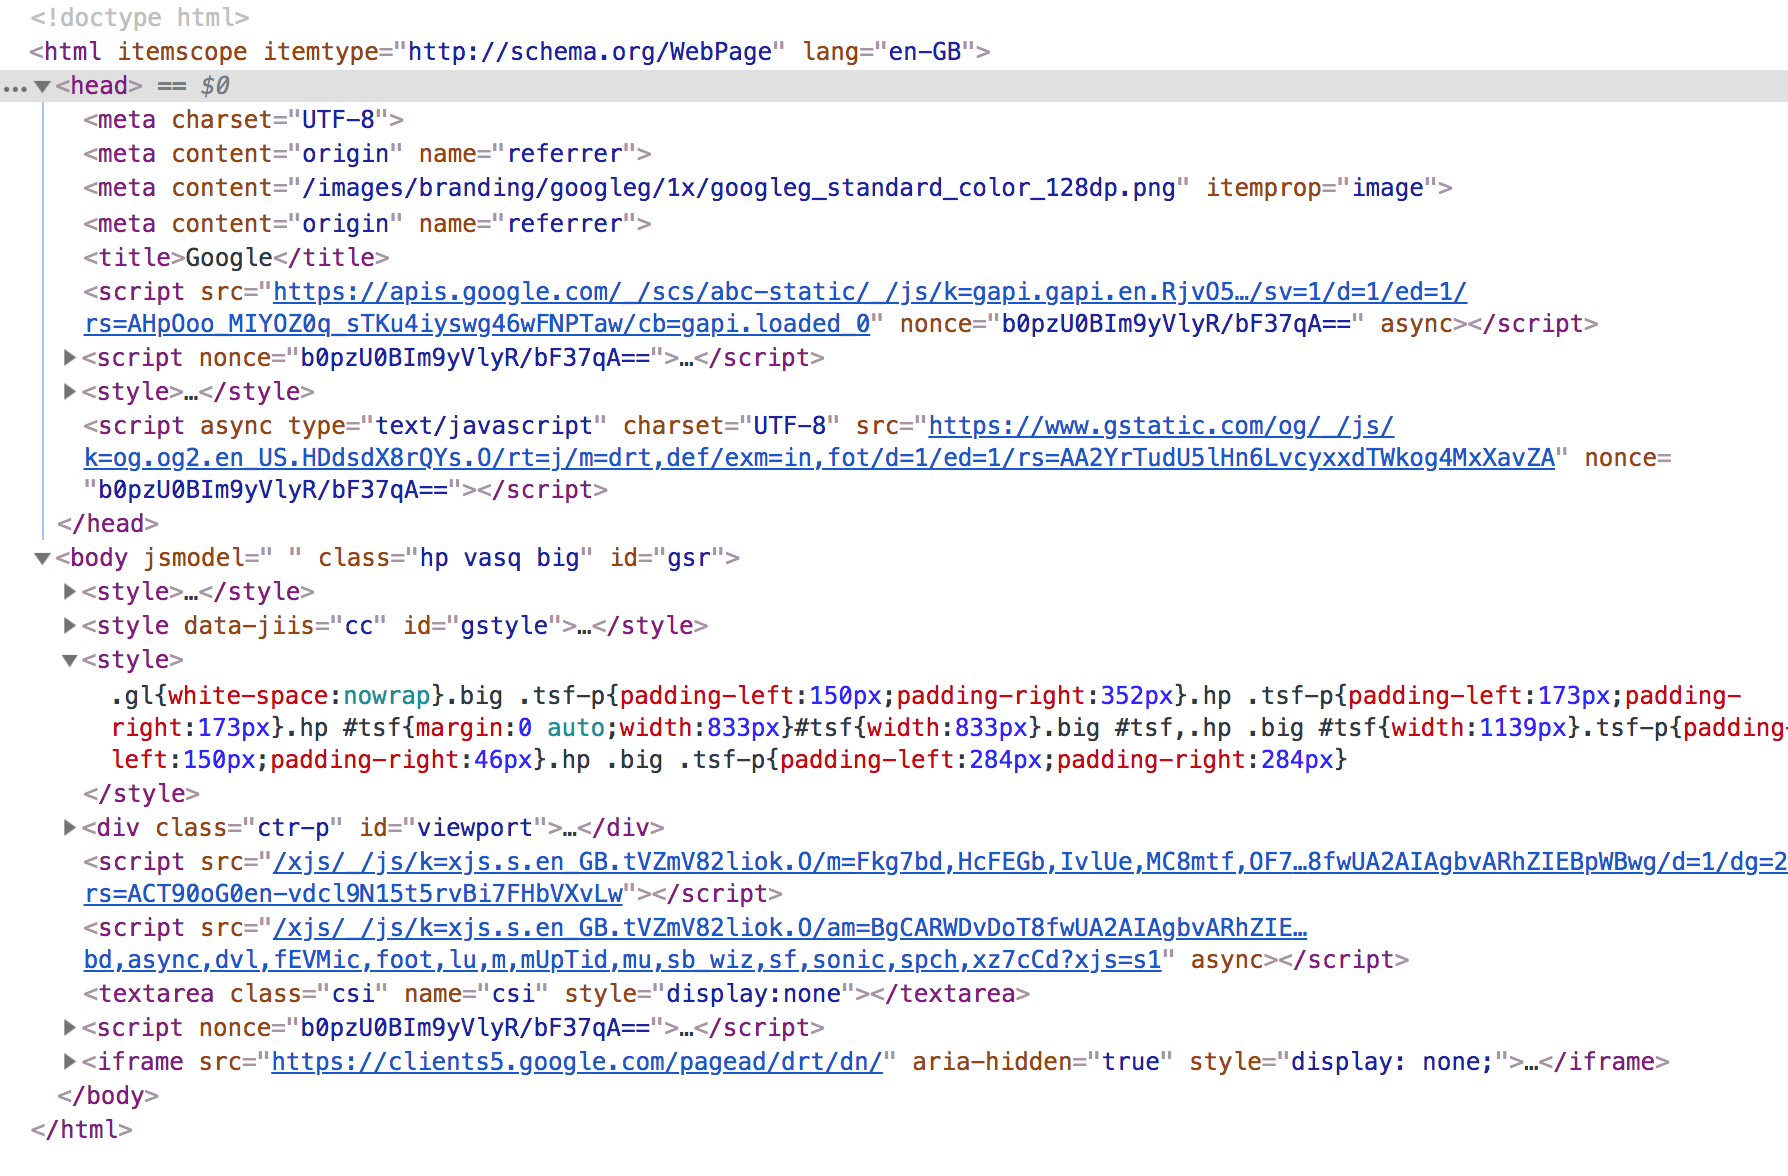
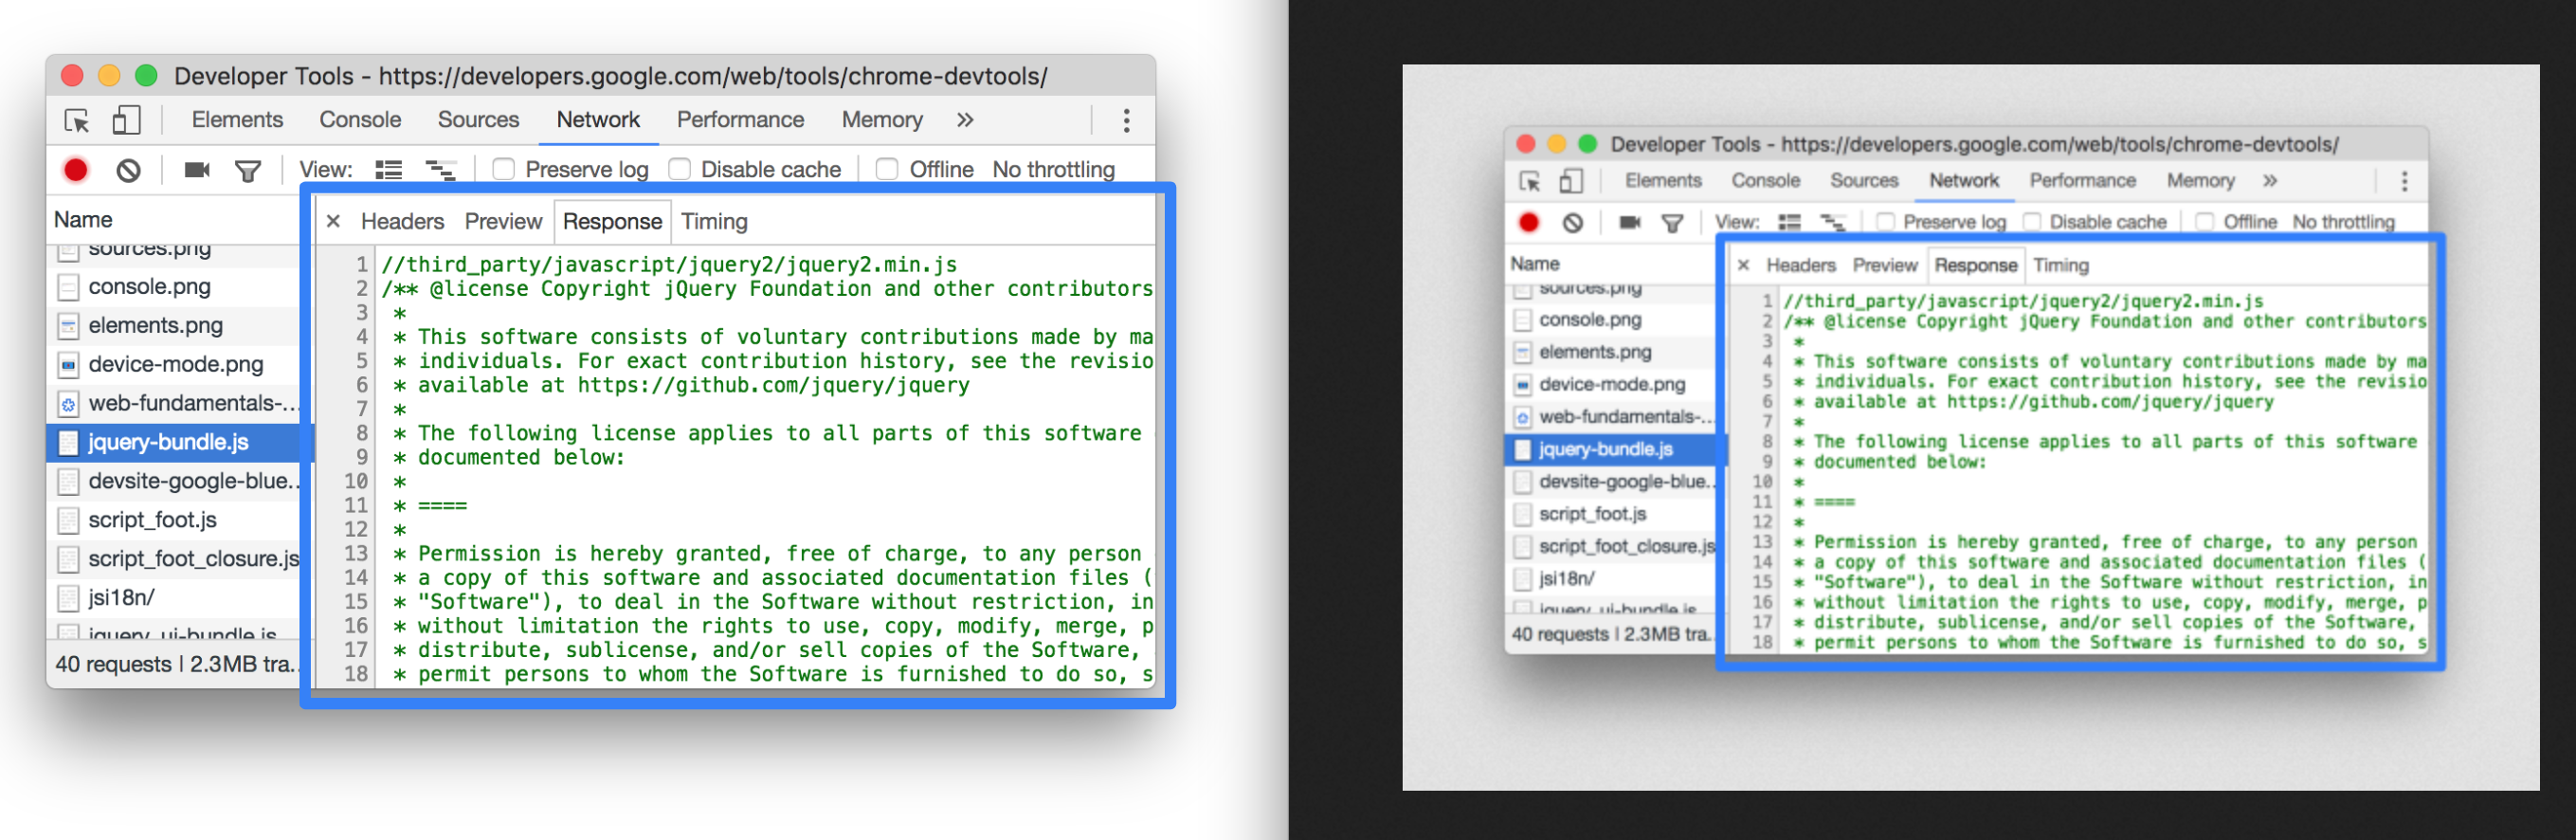
style tag. (Large preview)Looking at the page markup, there are no external stylesheets — all of the CSS is inline.
Performance Tip 1: Inline Critical CSS
This is good for performance as it saves the browser having to make an additional network request in order to fetch an external stylesheet, so the styles can be parsed and applied immediately for the first contentful paint. There’s a trade-off to be made here, as external stylesheets can be cached but inline ones cannot (unless you get clever with JavaScript).
The general advice is for your critical styles (anything above-the-fold) to be inline, and for the rest of your styling to be external and loaded asynchronously. Asynchronous loading of CSS can be achieved in one remarkably clever line of HTML:
<link rel="stylesheet" href="/path/to/my.css" media="print" onload="this.media='all'">The devtools show a prettified version of the DOM. If you want to see what was actually downloaded to the browser, switch to the Sources tab and find the document.
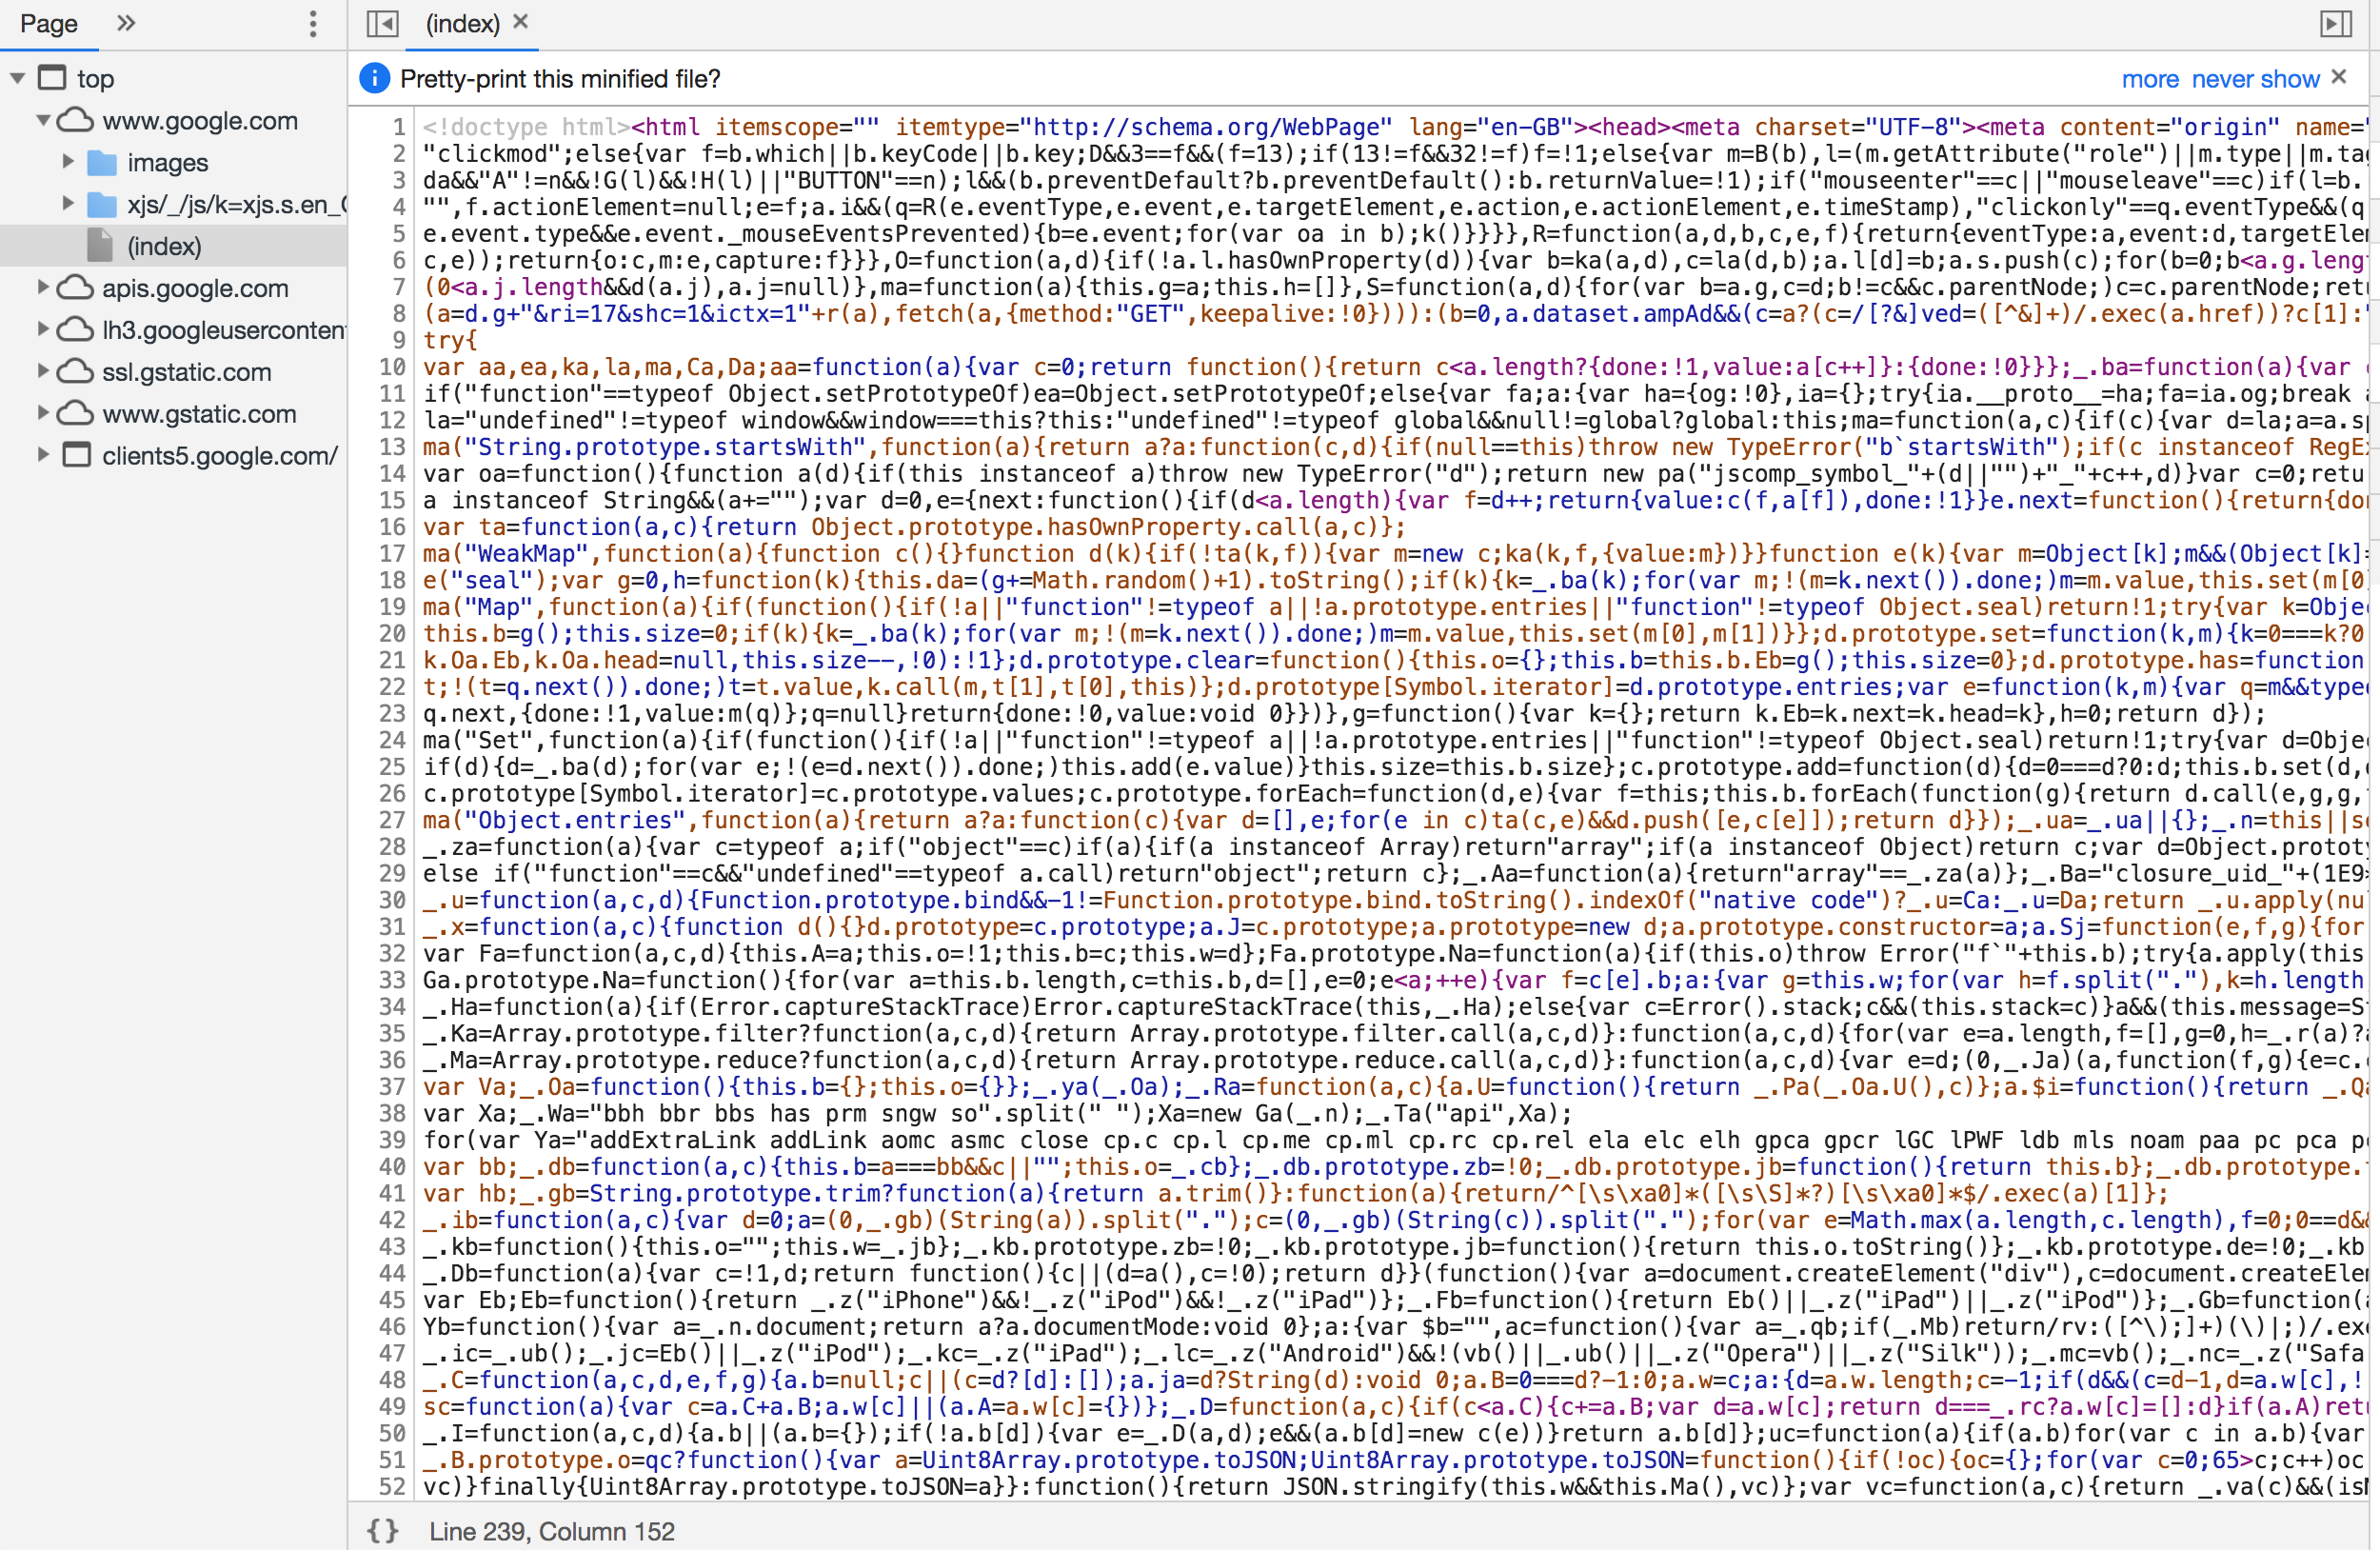
You can see there is a LOT of inline JavaScript here. It’s worth noting that it has been uglified rather than merely minified.
Performance Tip 2: Minify And Uglify Your Assets
Minification removes unnecessary spaces and characters, but uglification actually ‘mangles’ the code to be shorter. The tell-tale sign is that the code contains short, machine-generated variable names rather than untouched source code. This is good as it means the script is smaller and quicker to download.
Even so, inline scripts look to be roughly 120 KB of the 210 KB page resource (about half the 60 KB gzipped size). In addition, there are five external JavaScript files amounting to 291 KB of the 402 KB downloaded:
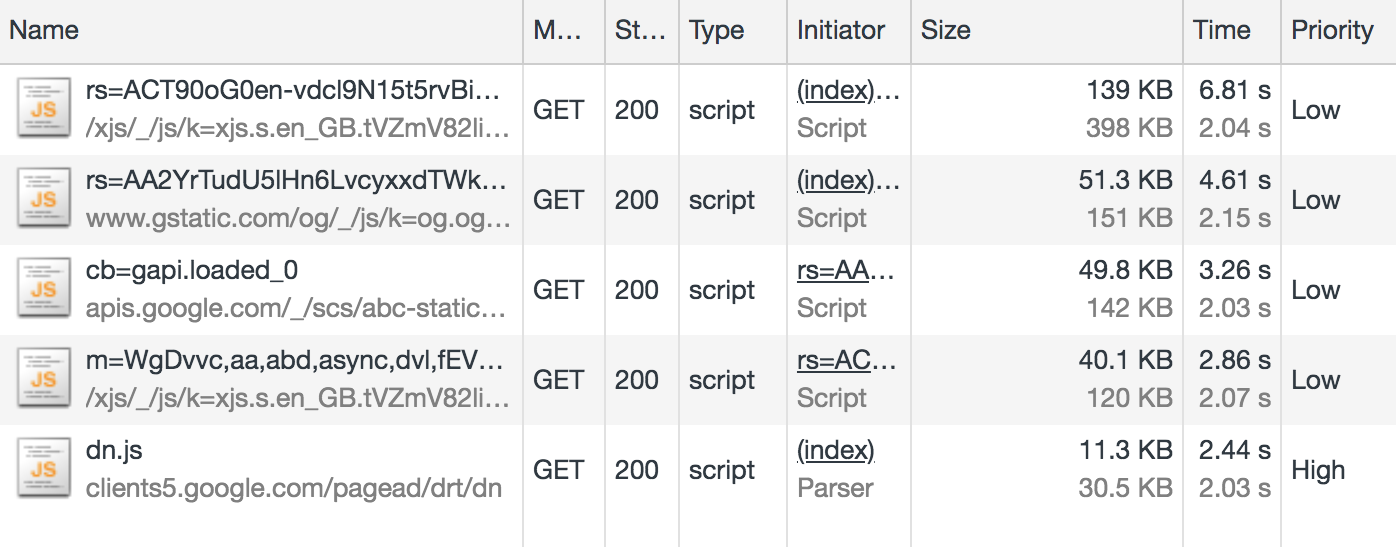
This means that JavaScript accounts for about 80 percent of the overall page weight.
This isn’t useless JavaScript; Google has to have some in order to display suggestions as you type. But I suspect a lot of it is tracking code and advertising setup.
For comparison, I disabled JavaScript and reloaded the page:
The JS-disabled version of Google search is just 102 KB, as opposed to 402 KB. Although Google can’t provide autosuggestions under these conditions, the site is still functional, and I’ve just cut my data usage down to a quarter of what it was. If I really did have to limit my data usage in the long term, one of the first things I’d do is disable JavaScript. It’s not as bad as it sounds.
Performance Tip 3: Less Is More
Inlining, uglifying and minifying assets is all well and good, but the best performance comes from not sending down the assets in the first place.
- Before adding any new features, do you have a performance budget in place?
- Before adding JavaScript to your site, can your feature be accomplished using plain HTML? (For example, HTML5 form validation).
- Before pulling a large JavaScript or CSS library into your application, use something like bundlephobia.com to measure how big it is. Is the convenience worth the weight? Can you accomplish the same thing using vanilla code at a much smaller data size?
Analysing The Resource Info
There’s a lot to unpack here, so let’s get cracking. I’ve only got 50 MB to play with, so I’m going to milk every bit of this page load. Settle in for a short Chrome Devtools tutorial.
402 KB transferred, but 1.1 MB of resources: what does that actually mean?
It means 402 KB of content was actually downloaded, but in its compressed form (using a compression algorithm such as gzip or brotli). The browser then had to do some work to unpack it into something meaningful. The total size of the unpacked data is 1.1 MB.
This unpacking isn’t free — there are a few milliseconds of overhead in decompressing the resources. But that’s a negligible overhead compared to sending 1.1MB down the wire.
Performance Tip 4: Compress Text-Based Assets
As a general rule, always compress your assets, using something like gzip. But don’t use compression on your images and other binary files — you should optimize these in advance at source. Compression could actually end up making them bigger.
And, if you can, avoid compressing files that are 1500 bytes or smaller. The smallest TCP packet size is 1500 bytes, so by compressing to, say, 800 bytes, you save nothing, as it’s still transmitted in the same byte packet. Again, the cost is negligible, but wastes some compression CPU time on the server and decompression CPU time on the client.
Now back to the Network tab in Chrome: let’s dig into those priorities. Notice that resources have priority “Highest” to “Lowest” — these are the browser’s best guess as to what are the more important resources to download. The higher the priority, the sooner the browser will try to download the asset.
Performance Tip 5: Give Resource Hints To The Browser
The browser will guess at what the highest priority assets are, but you can provide a resource hint using the <link rel="preload"> tag, instructing the browser to download the asset as soon as possible. It’s a good idea to preload fonts, logos and anything else that appears above the fold.
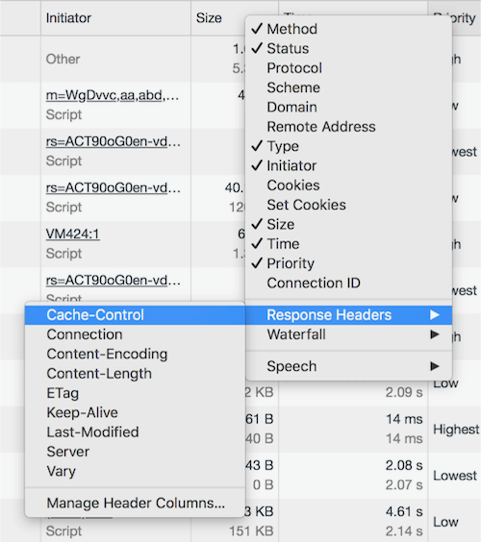
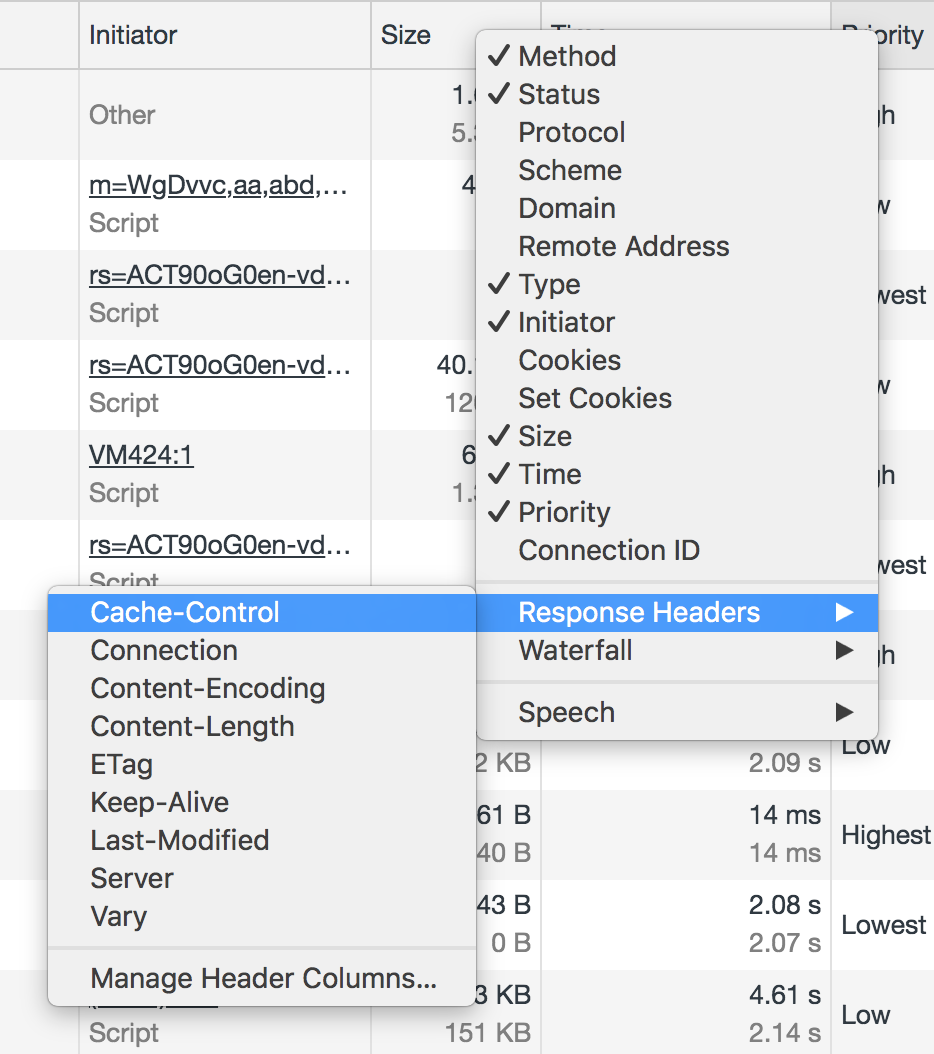
Let’s talk about caching. I’m going to hold ALT and right-click to change my column headers to unlock some more juicy information. We’re going to check out Cache-Control.
Cache-Control denotes whether or not a resource can be cached, how long it can be cached for, and what rules it should follow around revalidating. Setting proper cache values is crucial to keeping the data cost of repeat visits down.
Performance Tip 6: Set Cache-Control Headers On All Cacheable Assets
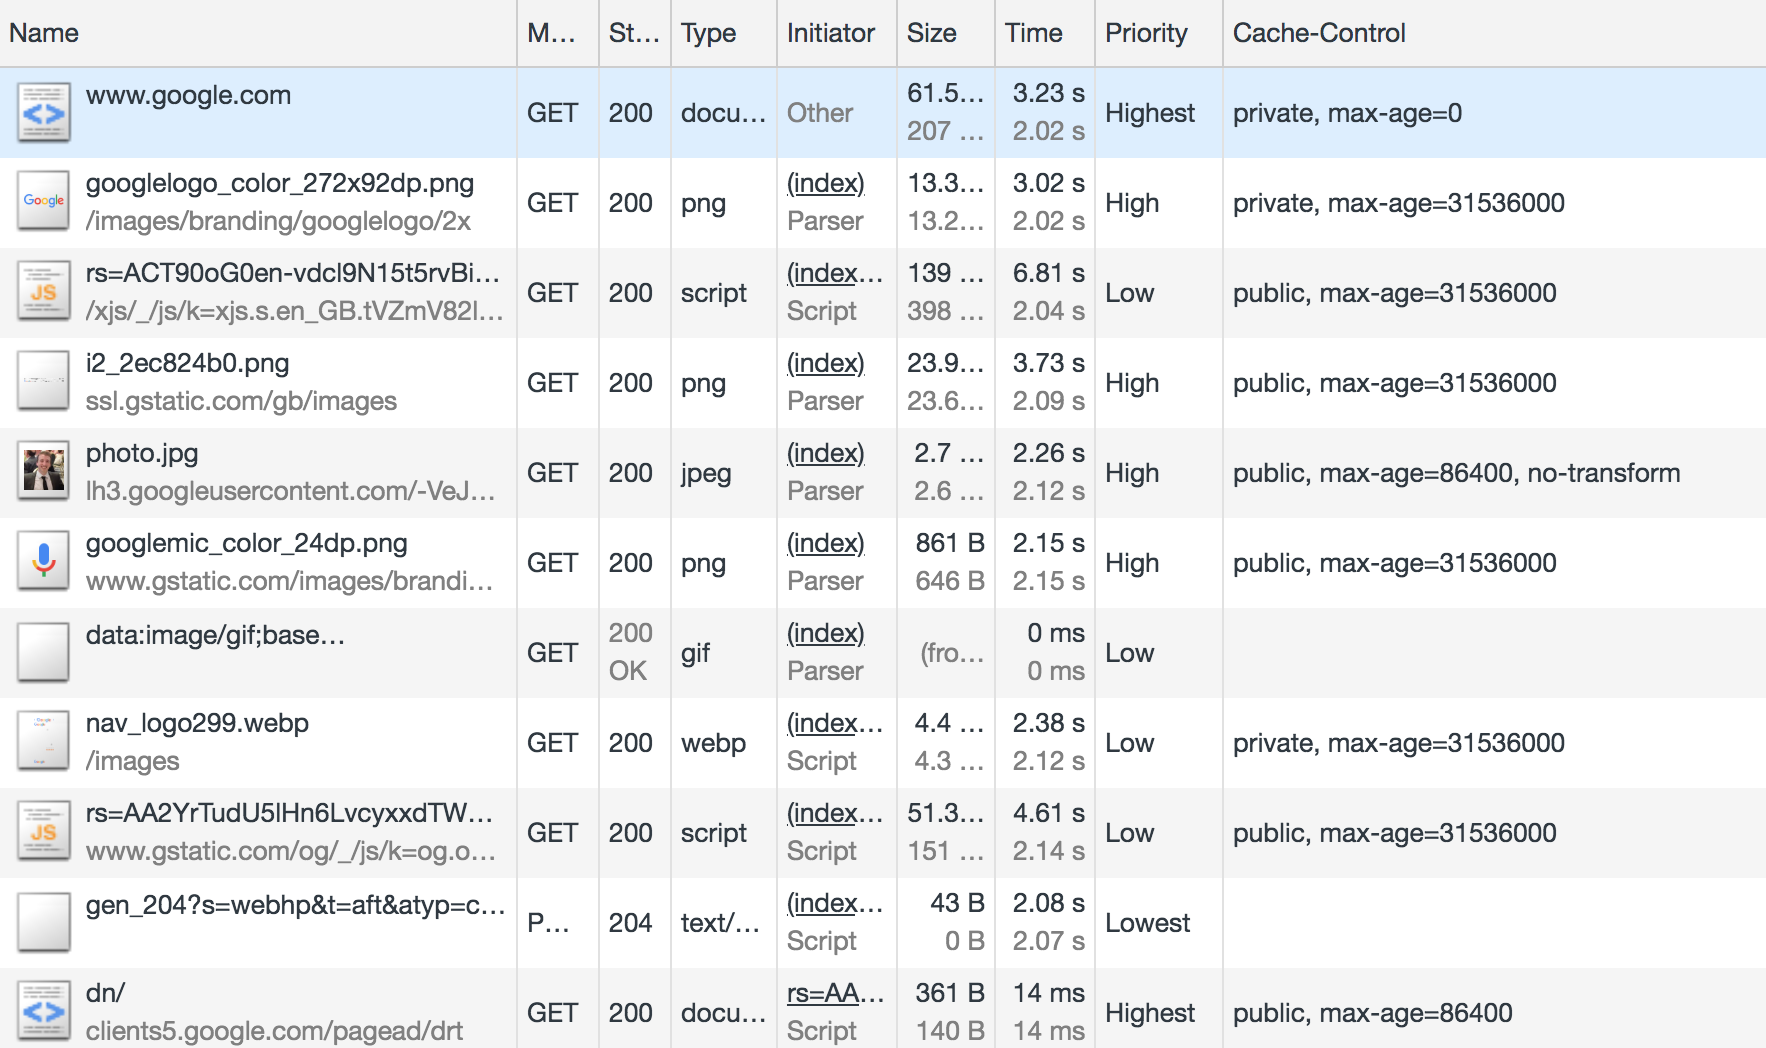
Note that the cache-control value begins with a directive of public or private, followed by an expiration value (e.g. max-age=31536000). What does the directive mean, and why the oddly specific max-age value?
The value 31536000 is the number of seconds there are in a year, and is the theoretical maximum value allowed by the cache-control specification. It is common to see this value applied to all static assets and effectively means “this resource isn’t going to change”. In practice, no browser is going to cache for an entire year, but it will cache the asset for as long as makes sense.
To explain the public/private directive, we must explain the two main caches that exist off the server. First, there is the traditional browser cache, where the resource is stored on the user’s machine (the ‘client’). And then there is the CDN cache, which sits between the client and the server; resources are cached at the CDN level to prevent the CDN from requesting the resource from the origin server over and over again.

A Cache-Control directive of public allows the resource to be cached in both the client and the CDN. A value of private means only the client can cache it; the CDN is not supposed to. This latter value is typically used for pages or assets that exist behind authentication, where it is fine to be cached on the client but we wouldn’t want to leak private information by caching it in the CDN and delivering it to other users.
One thing that got my attention was that the Google logo has a cache control of “private”. Other images on the page do have a public cache, and I don’t know why the logo would be treated any differently. If you have any ideas, let me know in the comments!
I refreshed the page and most of the resources were served from cache, apart from the page itself, which as you’ve seen already is private, max-age=0, meaning it cannot be cached. This is normal for dynamic web pages where it is important that the user always gets the very latest page when they refresh.
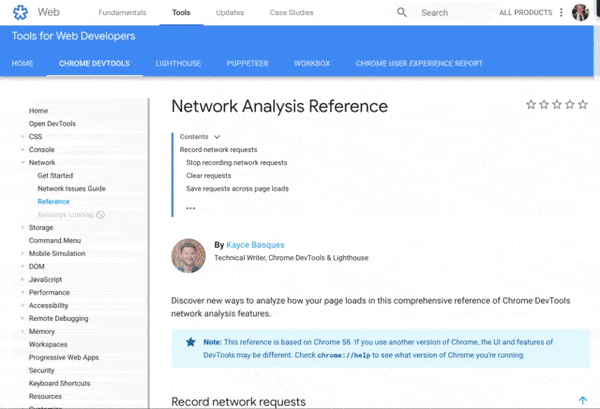
It was at this point I accidentally clicked on an ‘Explanation’ URL in the devtools, which took me to the network analysis reference, costing me about 5 MB of my budget. Oops.
Google Dev Docs
4.2 MB of this new 5 MB page was down to images; specifically SVGs. The weightiest of these was 186 KB, which isn’t particularly big — there were just so many of them, and they all downloaded at once.
That 5 MB page load was 10% of my budget for today. So far I’ve used 5.5 MB, including the no-JavaScript reload of the Google homepage, and spent $0.40. I didn’t even mean to open this page.
What would have been a better user experience here?
Performance Tip 7: Lazy-load Your Images
Ordinarily, if I accidentally clicked on a link, I would hit the back button in my browser. I’d have received no benefit whatsoever from downloading those images — what a waste of 4.2 MB!
Apart from video, where you generally know what you’re getting yourself into, images are by far the biggest culprit to data usage on the web. A study of the world’s top 500 websites found that images take up to 53% of the average page weight. “This means they have a big impact on page-loading times and subsequently overall performance”.
Instead of downloading all of the images on page load, it is good practice to lazy-load the images so that only users who are engaged with the page pay the cost of downloading them. Users who choose not to scroll below the fold therefore don’t waste any unnecessary bandwidth downloading images they’ll never see.
There’s a great css-tricks.com guide to rolling out lazy-loading for images which offers a good balance between those on good connections, those on poor connections, and those with JavaScript disabled.
If this page had implemented lazy loading as per the guide above, each of the 38 SVGs would have been represented by a 1 KB placeholder image by default, and only loaded into view on scroll.
Performance Tip 8: Use The Right Format For Your Images
I thought that Google had missed a trick by not using WebP, which is an image format that is 26% smaller in size compared to PNGs (with no loss in quality) and 25-34% smaller in size compared to JPEGs (and of a comparable quality). I thought I’d have a go at converting SVG to WebP.
Converting to WebP did bring one of the SVGs down from 186 KB to just 65 KB, but actually, looking at the images side by side, the WebP came out grainy:
I then tried converting one of the PNGs to WebP, which is supposed to be lossless and should come out smaller. However, the WebP output was *heavier* (127 KB, from 109 KB)!
This surprised me. WebP isn’t necessarily the silver bullet we think it is, and even Google have neglected to use it on this page.
So my advice would be: where possible, experiment with different image formats on a per-image basis. The format that keeps the best quality for the smallest size may not be the one you expect.
Now back to the DOM. I came across this:

Notice the async keyword on the Google analytics script?
Despite being one of the first things in the head of the document, this was given a low priority, as we’ve explicitly opted out of being a blocking request by using the async keyword.
A blocking request is one that stops the rendering of the page. A <script> call is blocking by default, stopping the parsing of the HTML until the script has downloaded, compiled and executed. This is why we traditionally put <script> calls at the end of the document.
Performance Tip 9: Avoid Writing Blocking Script Calls
By adding the async attribute to our <script> tag, we’re telling the browser not to stop rendering the page but to download the script in the background. If the HTML is still being parsed by the time the script is downloaded, the parsing is paused while the script is executed, and then resumed. This is significantly better than blocking the rendering as soon as <script> is encountered.
There is also a defer attribute, which is subtly different. <script defer> tells the browser to render the page while the script loads in the background, and even if the HTML is still being parsed by the time the script is downloaded, the script must wait until the page is rendered before it can be executed. This makes the script completely non-blocking. Read “Efficiently load JavaScript with defer and async” for more information.
Anyway, enough Google dissecting. It’s time to try out another site. I’ve still got almost 45 MB of my budget left!
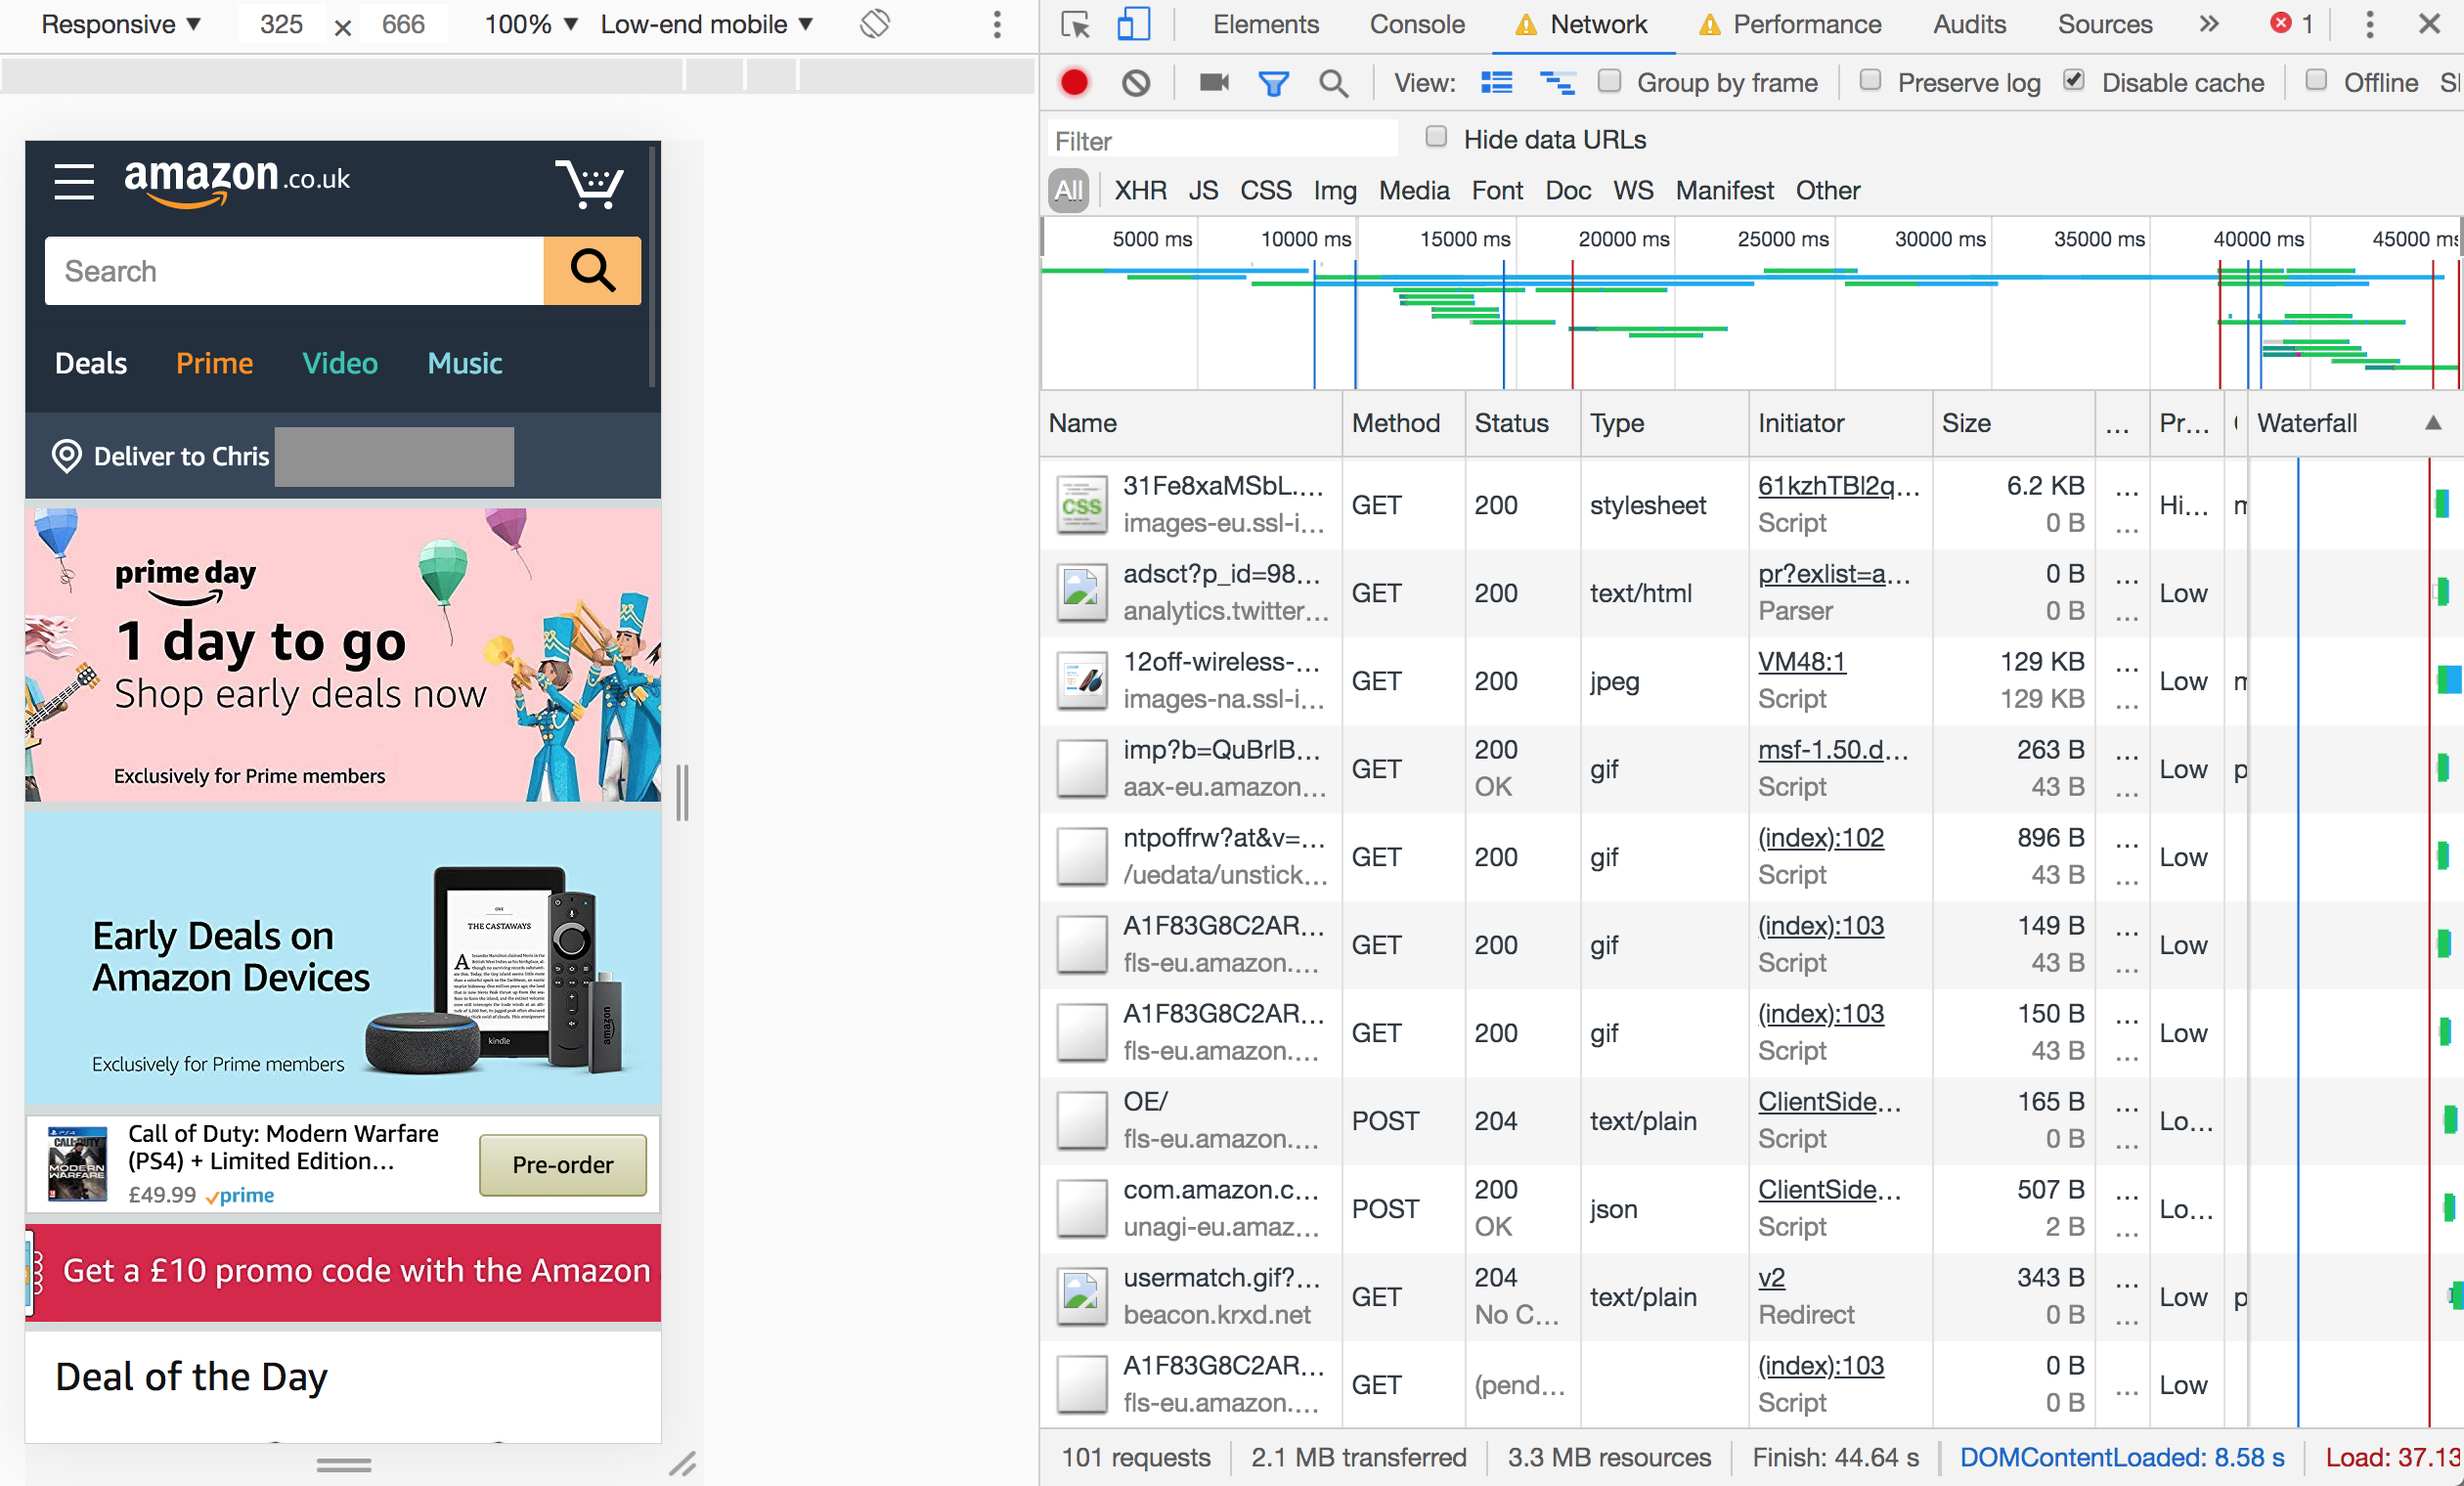
Amazon

The Amazon homepage loaded with a total weight of about 6 MB. One of these was a 587 KB image that I couldn’t even find on the page. This was a PNG, presumably to have crisp text, but on a photographic background — a classic combination that’s terrible for performance.
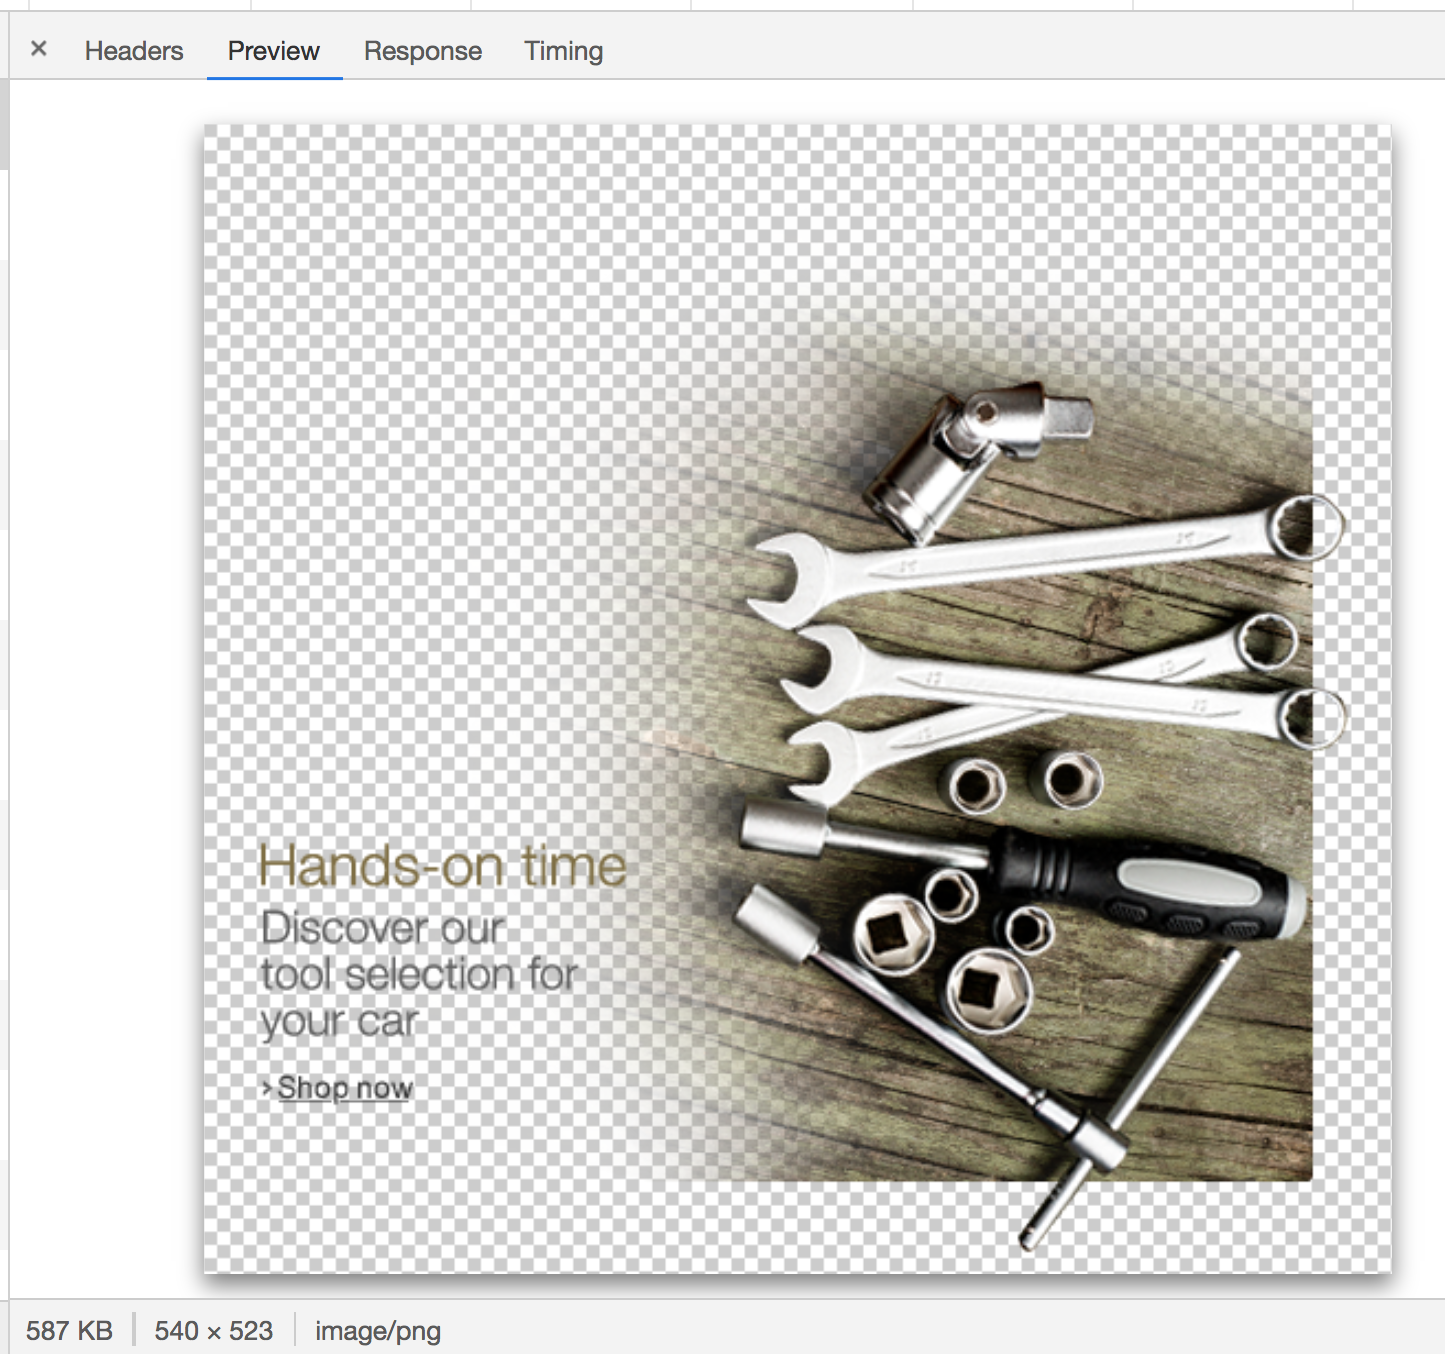
In fact, there were a few several-hundred-kilobyte images in my network tab that I couldn’t actually see on the page. I suspect a misconfiguration somewhere on Amazon, but these invisible images combined chewed through at least 1 MB of my data.
How about the hero image? It’s the main image on the page, and it’s only 94 KB transferred — but it could be reduced in size by about 15% if it were cropped directly around the text and footballers. We could then apply the same background color in CSS as is in the image. This has the additional advantage of being resizable down to smaller screens whilst retaining legibility of text.

I’ve said it once, and I’ll say it again: optimising and lazy-loading your images is the single biggest benefit you can make to the page weight of your site.
"Optimizing images provided, by far, the most significant data reduction. You can make the case JavaScript is a bigger deal for overall performance, but not data reduction. Optimizing or removing images is the safest way of ensuring a much lighter experience and that’s the primary optimization Data Saver relies on."
— Tim Kadlec, Making Sense of Chrome Lite Pages
To be fair to Amazon, if I resize the browser to a mobile size and refresh the page, the site is optimized for mobile and the total page weight is only 2.1 MB.
But this brings me onto my next point…
Performance Tip 10: Don’t Make Assumptions About Data Connections
It’s difficult to detect if someone on a desktop is on a broadband connection or is tethering through a data-limited dongle or mobile. Many people work on the train like that, or live in an area where broadband infrastructure is poor but mobile signal is strong. In Amazon’s case, there is room to make some big data savings on the desktop site and we shouldn’t get complacent just because the screen size suggests I’m not on a mobile device.
Yes, we should expect a larger page load if our viewport is ‘desktop sized’ as the images will be larger and better optimized for the screen than a grainier mobile one. But the page shouldn’t be orders of magnitude bigger.
Moreover, I was sending the Save-Data header with my request. This header explicitly indicates a preference for reduced data usage, and I hope more websites start to take notice of it in the future.
The initial ‘desktop’ load may have been 6 MB, but after sitting and watching it for a minute it had climbed to 8.6 MB as the lower-priority resources and event tracking kicked into action. This page weight includes almost 1.7 MB of minified JavaScript. I don’t even want to begin to look at that.
Performance Tip 11: Use Web Workers For Your JavaScript
Which would be worse — 1.7 MB of JavaScript or 1.7 MB of images? The answer is JavaScript: the two assets are not equivalent when it comes to performance.
"A JPEG image needs to be decoded, rasterized, and painted on the screen. A JavaScript bundle needs to be downloaded and then parsed, compiled, executed —and there are a number of other steps that an engine needs to complete. Be aware that these costs are not quite equivalent."
— Addy Osmani, The Cost of JavaScript in 2018
If you must ship this much JavaScript, try putting it in a web worker. This keeps the bulk of JavaScript off the main thread, which is now freed up for repainting the UI, helping your web page to stay responsive on low-powered devices.
I’m now about 15.5 MB into my budget, and have spent $1.14 of my Zimbabwe data budget. I’d have had to have worked for half a day as a teacher to earn the money to get this far.
I’ve heard good things about Pinterest’s performance, so I decided to put it to the test.
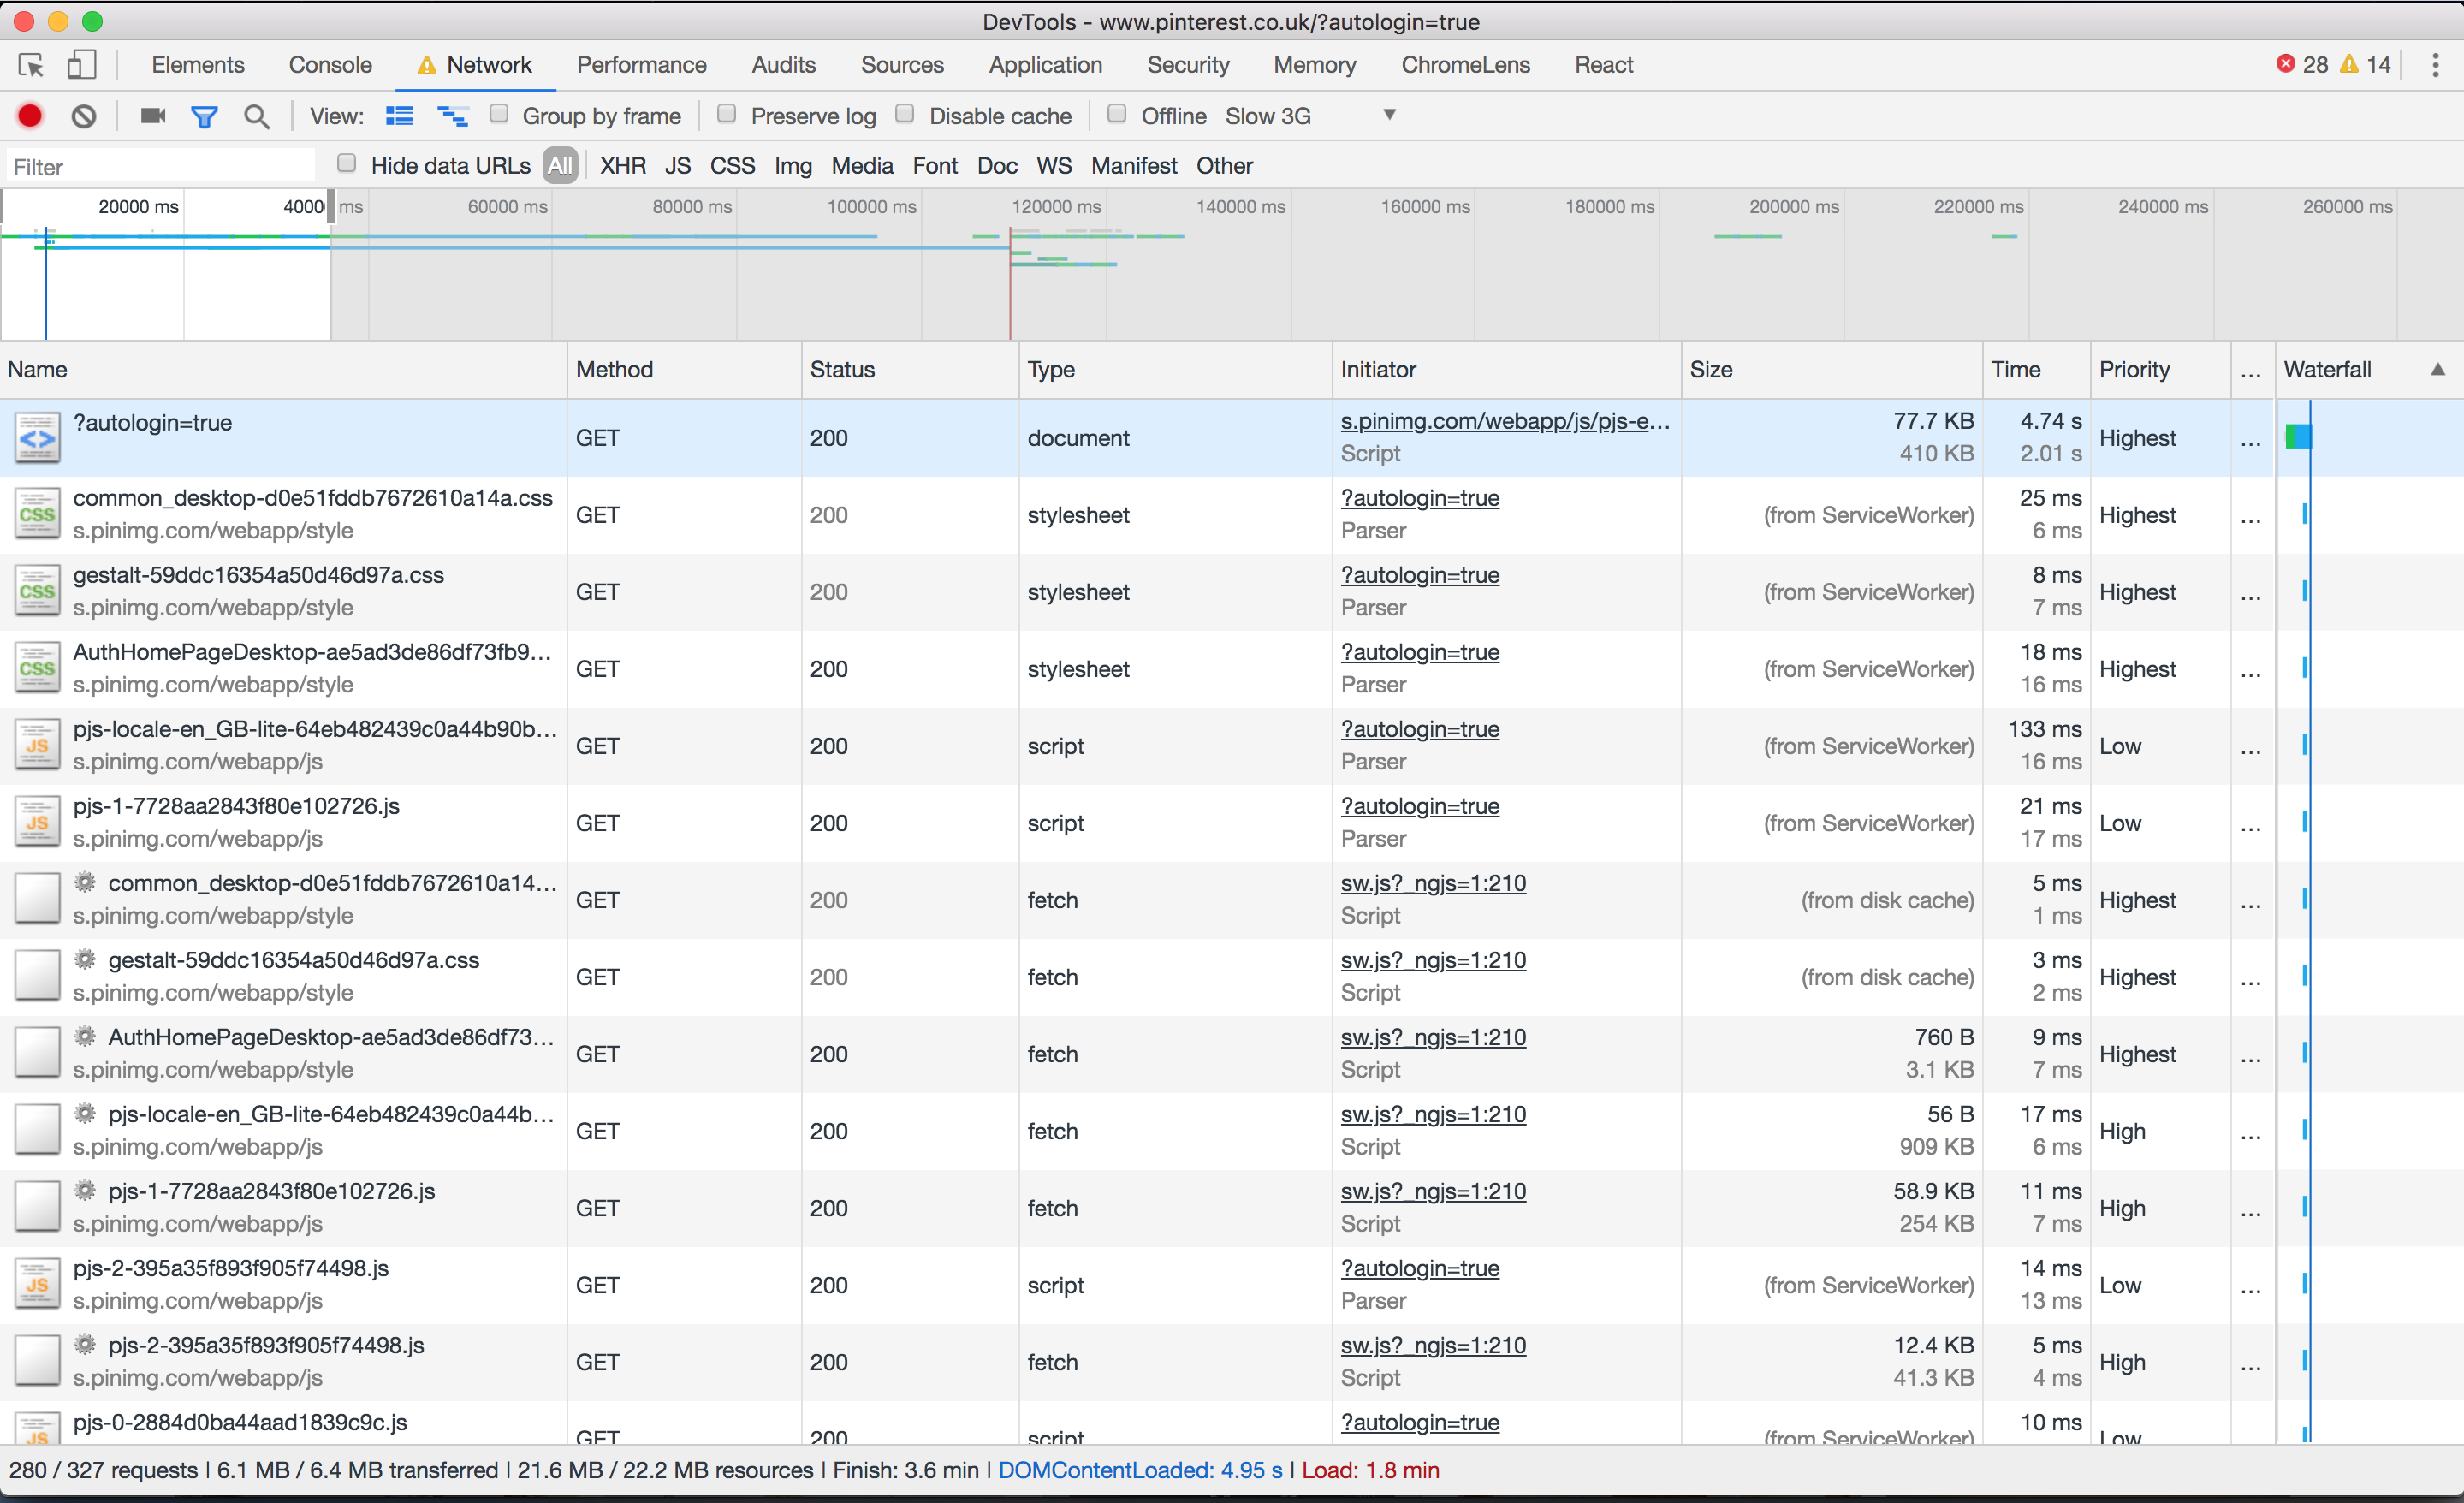
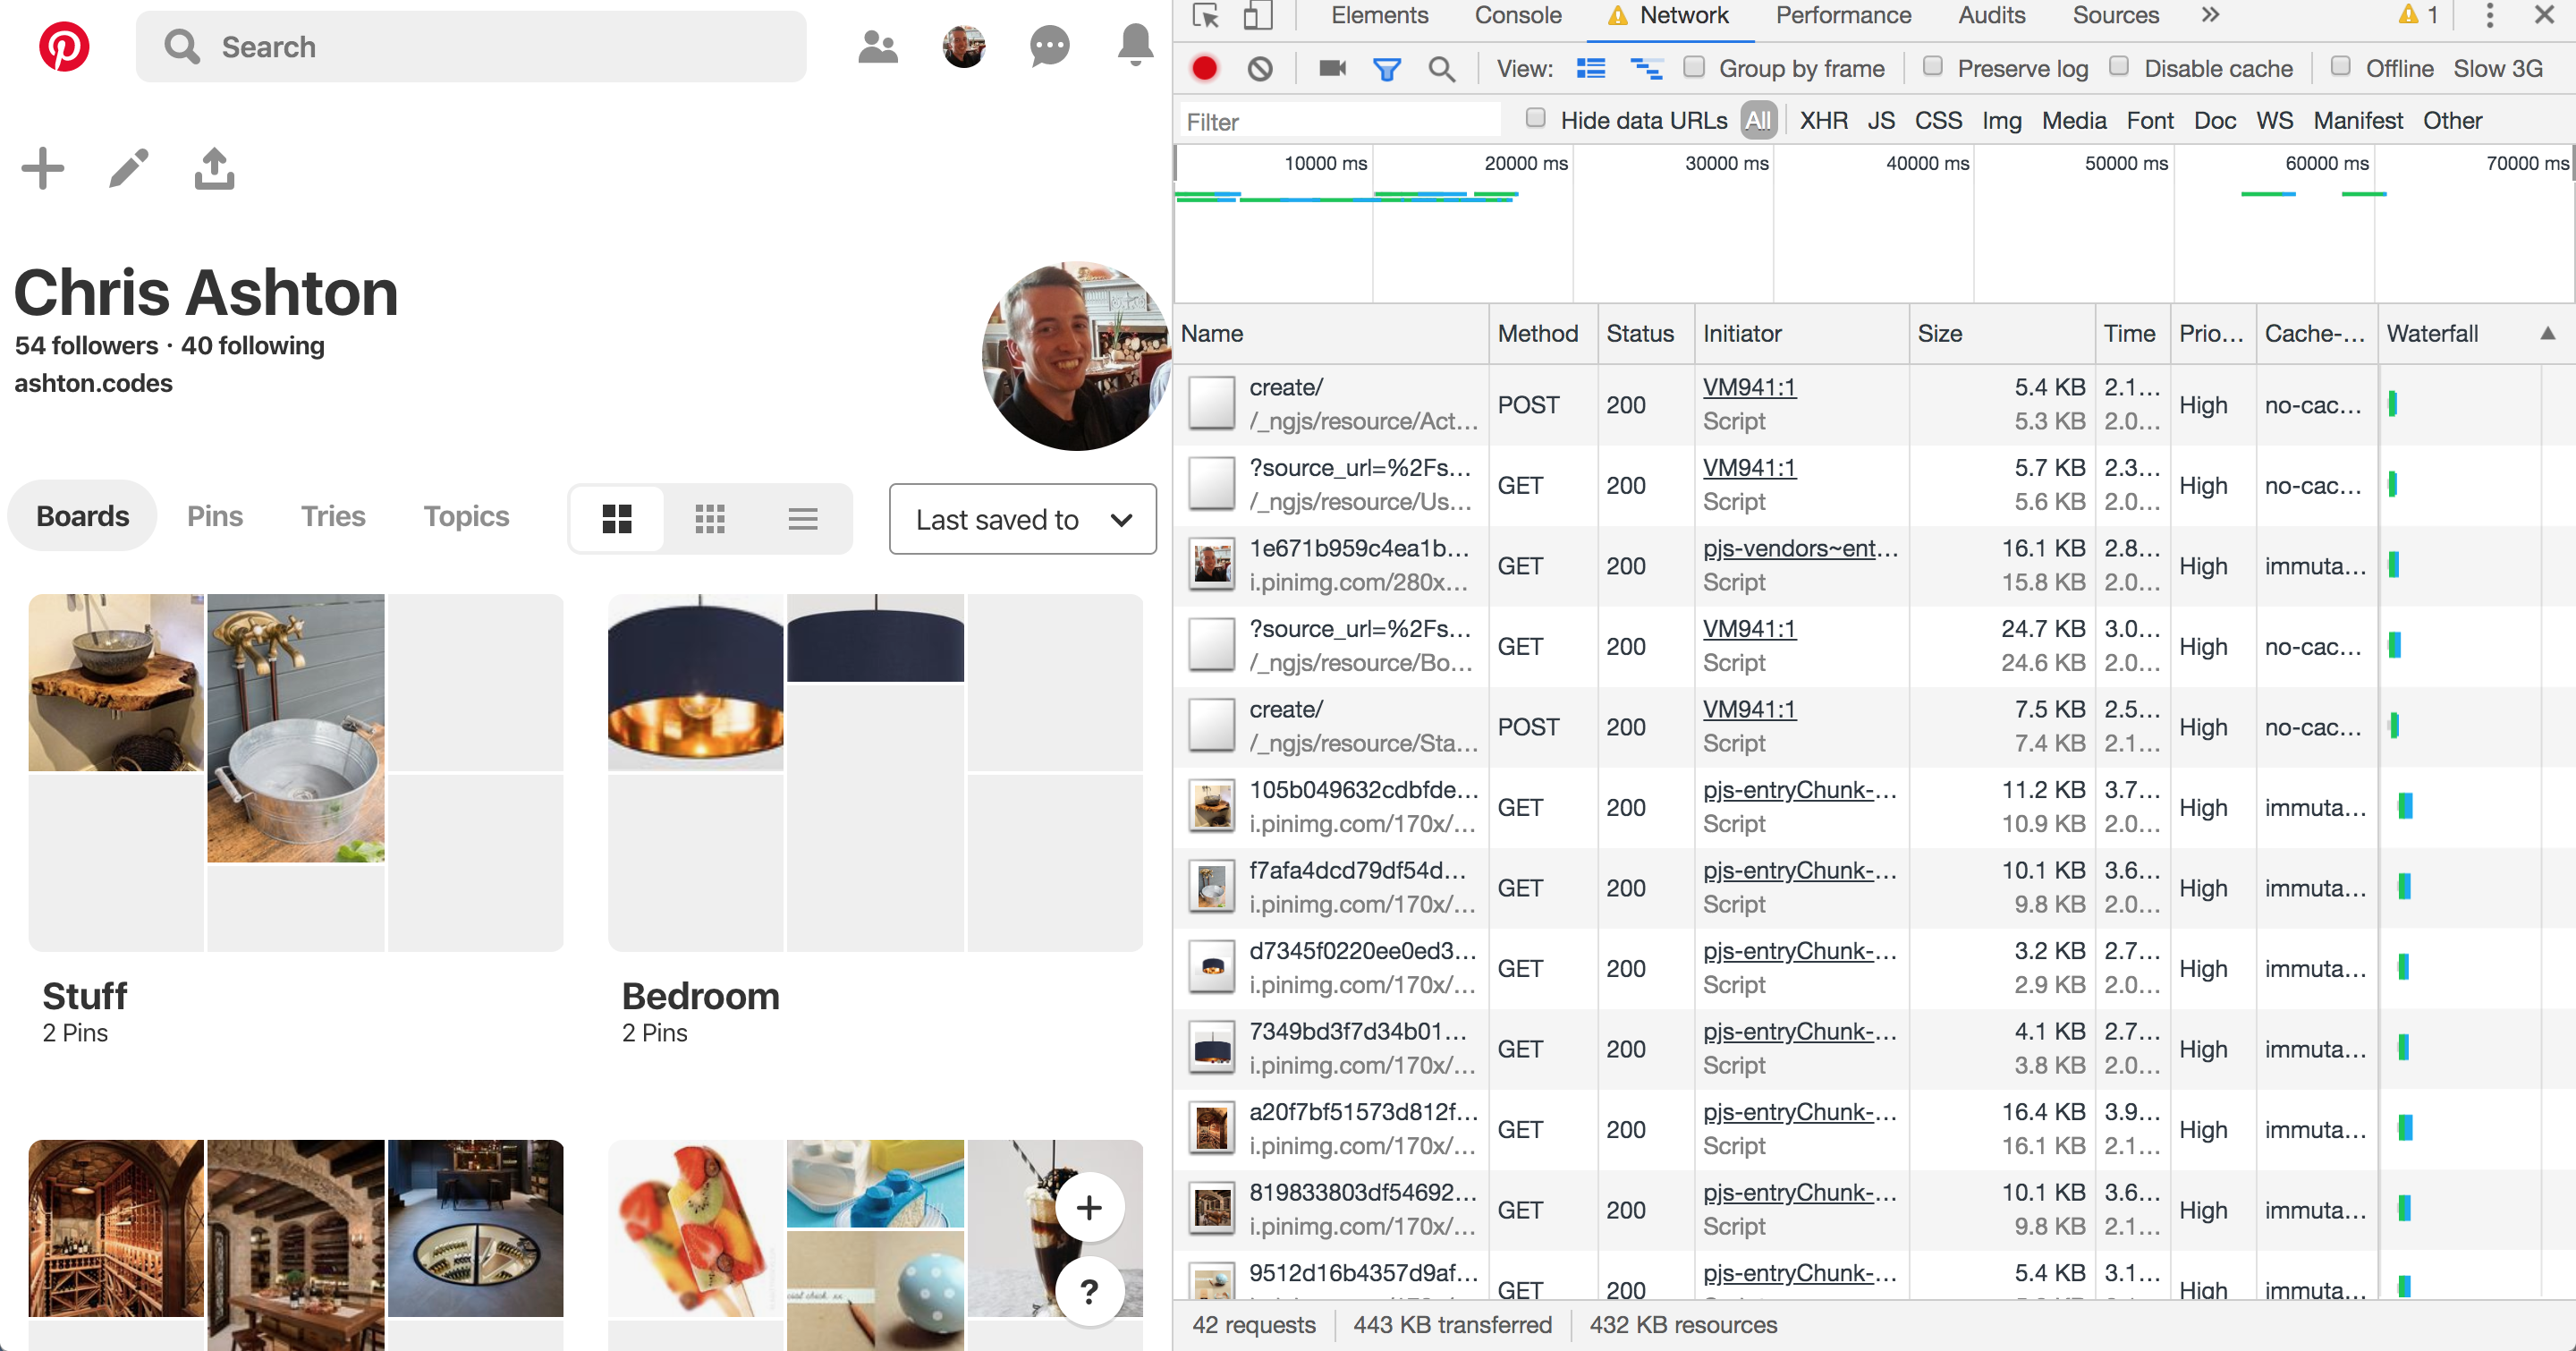
Perhaps this isn’t the fairest of tests; I was taken to the sign-in page, upon which an asynchronous process found I was logged into Facebook and logged me in automatically. The page loaded relatively quickly, but the requests crept up as more and more content was preloaded.
However, I saw that on subsequent page loads, the service worker surfaced much of the content — saving about half of the page weight:
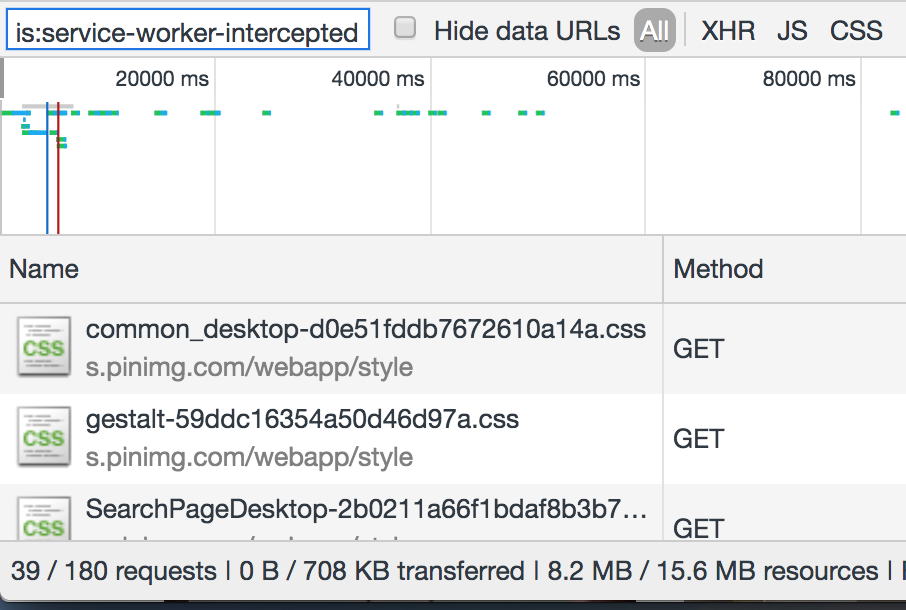
The Pinterest site is a progressive web app; it installed a service worker to manually handle caching of CSS and JS. I could now turn off my WiFi and continue to use the site (albeit not very usefully):

Performance Tip 12: Use Service Workers To Provide Offline Support
Wouldn’t it be great if I only had to load a website once over network, and now get all the information I need even if I’m offline?
A great example would be a website that shows the weather forecast for the week. I should only need to download that page once. If I turn off my mobile data and subsequently go back to the page at some point, it should be able to serve the last known content to me. If I connect to the internet again and load the page, I would get a more up to date forecast, but static assets such as CSS and images should still be served locally from the service worker.
This is possible by setting up a service worker with a good caching strategy so that cached pages can be re-accessed offline. The lodash documentation website is a nice example of a service worker in the wild:
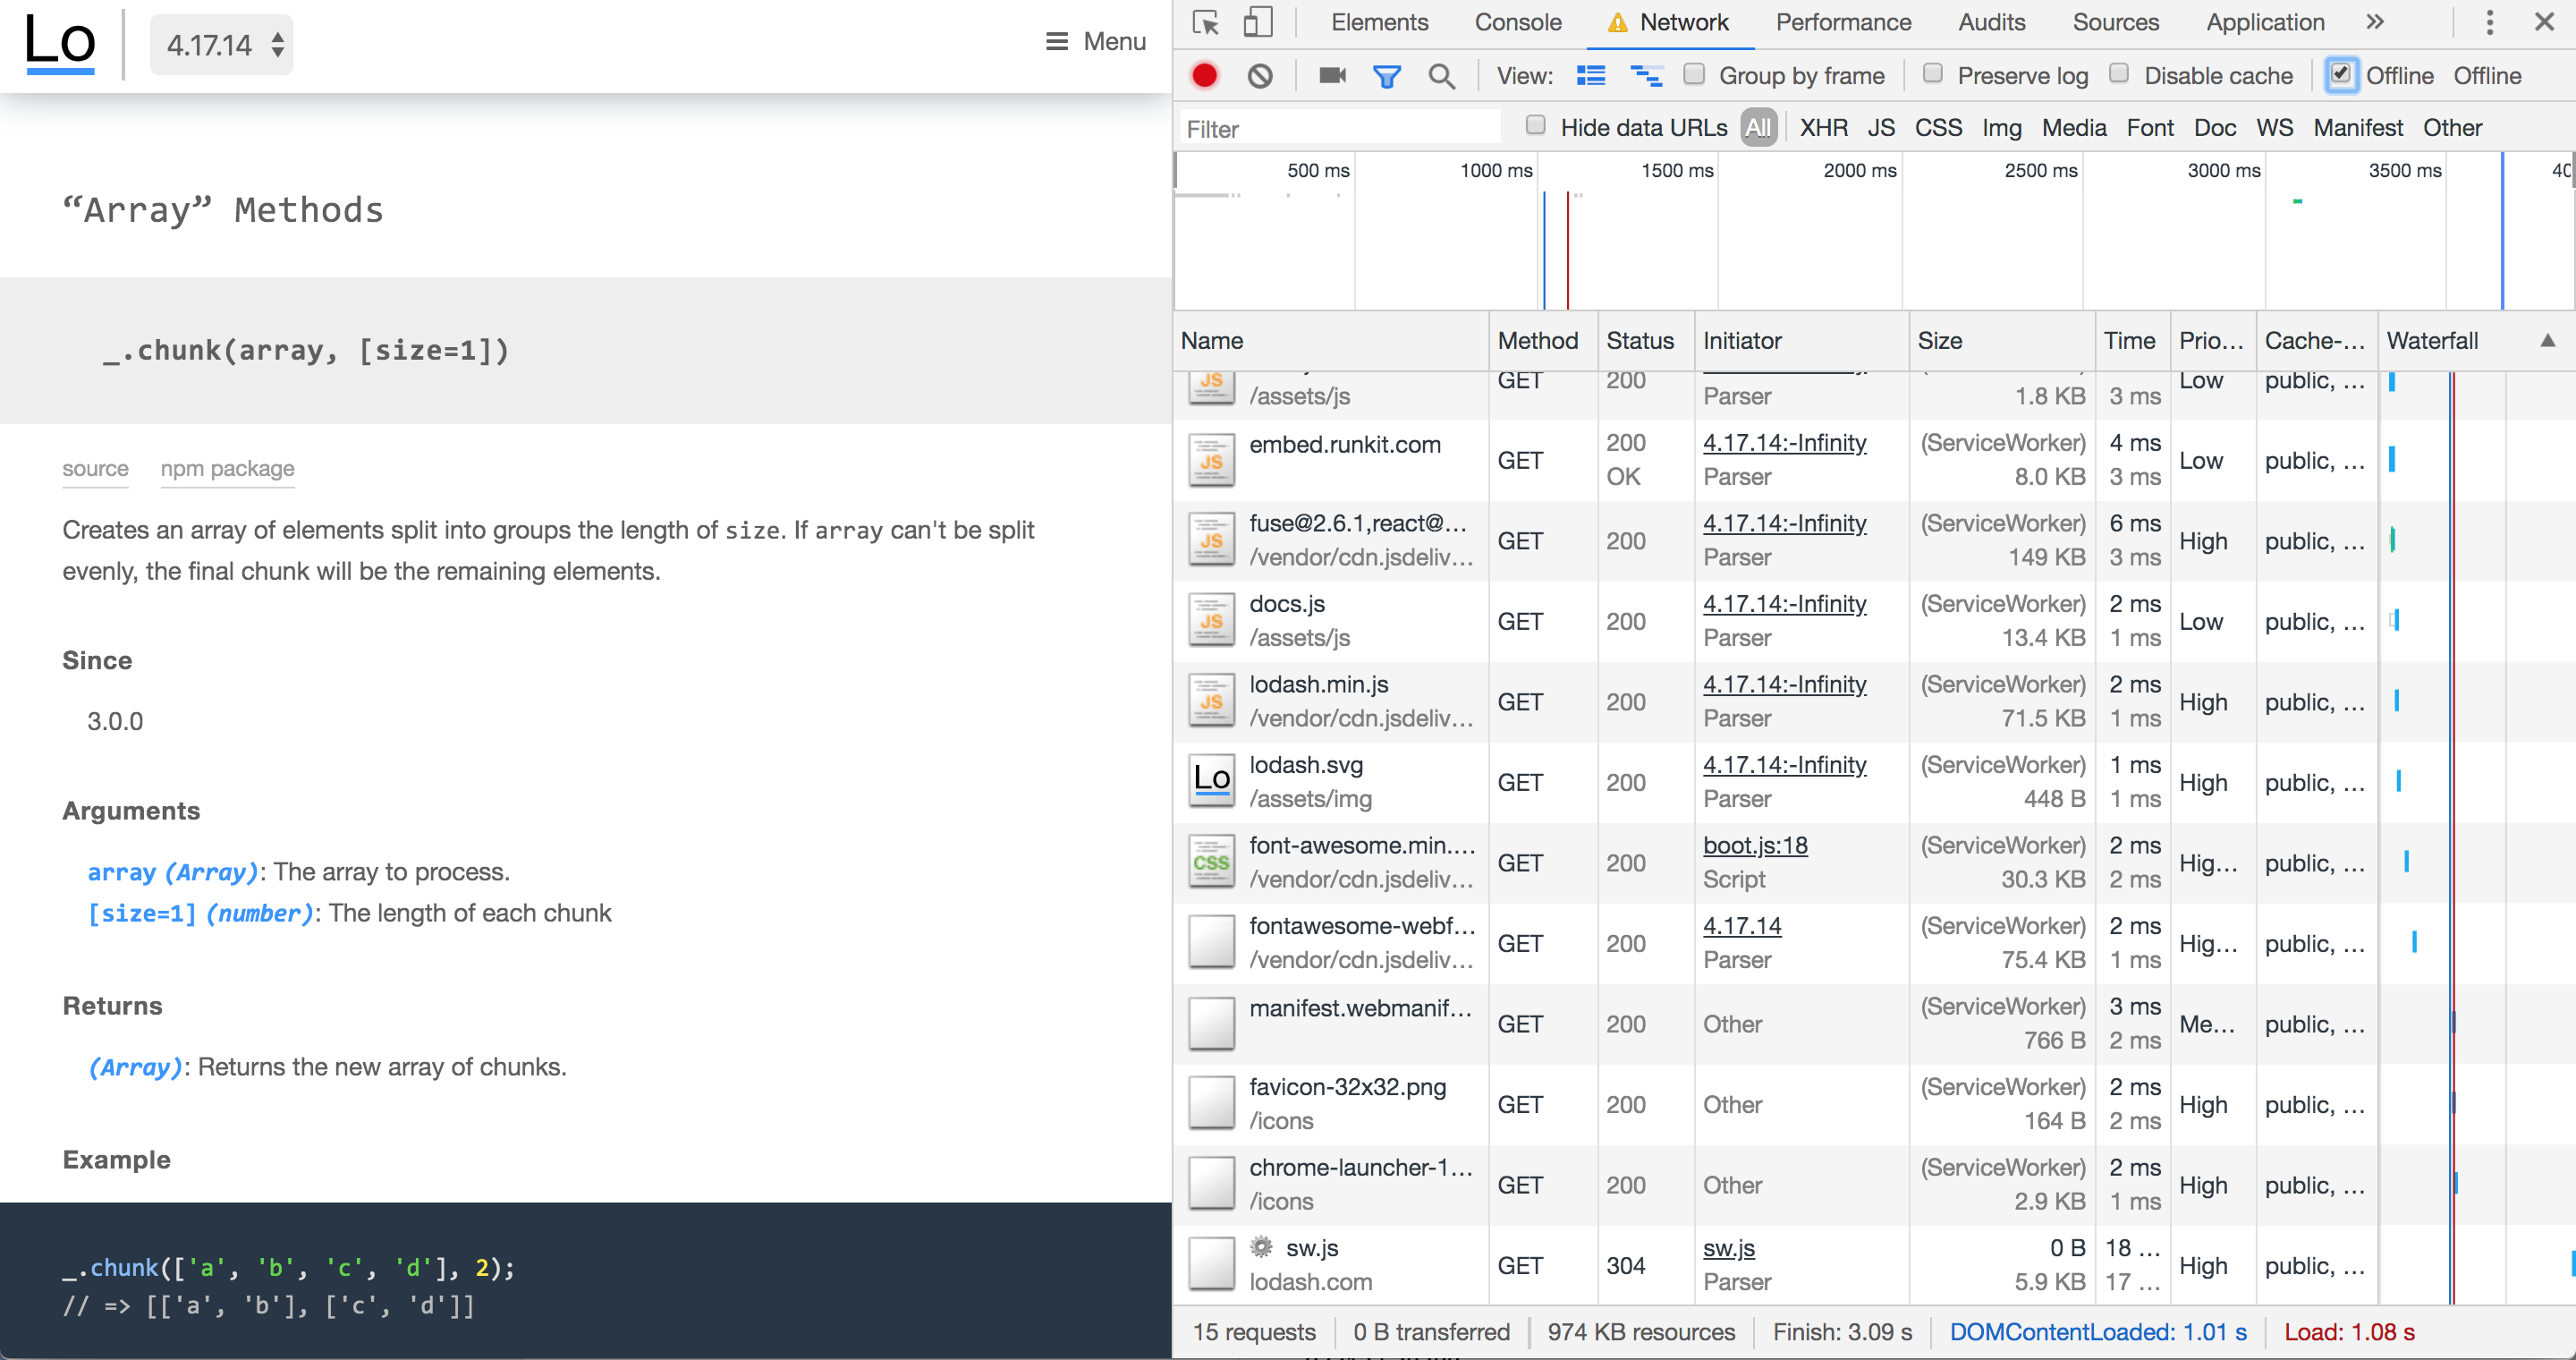
Content that rarely updates and is likely to be used quite regularly is a perfect candidate for service worker treatment. Dynamic sites with ever-changing news feeds aren’t quite so well suited for offline experiences, but can still benefit.
Service workers can truly save the day when you’re on a tight data budget. I’m not convinced the Pinterest experience was the most optimal in terms of data usage – subsequent pages were around the 0.5 MB mark even on pages with few images — but letting your JavaScript handle page requests for you and keeping the same navigational elements in place can be very performant. The BBC manages a transfer size of just 3.1 KB for return-visits to articles that are renderable via the single page application.
So far, Pinterest alone has chewed through 14 MB, which means I’ve blown around 30 MB of my budget, or $2.20 (almost a day’s wages) of my Zimbabwe budget.
I’d better be careful with my final 20 MB… but where’s the fun in that?
Gamespot
I picked this one because it felt noticeably sluggish on my mobile in the past and I wanted to dig into the reasons why. Sure enough, loading the homepage consumes 8.5 MB of data.
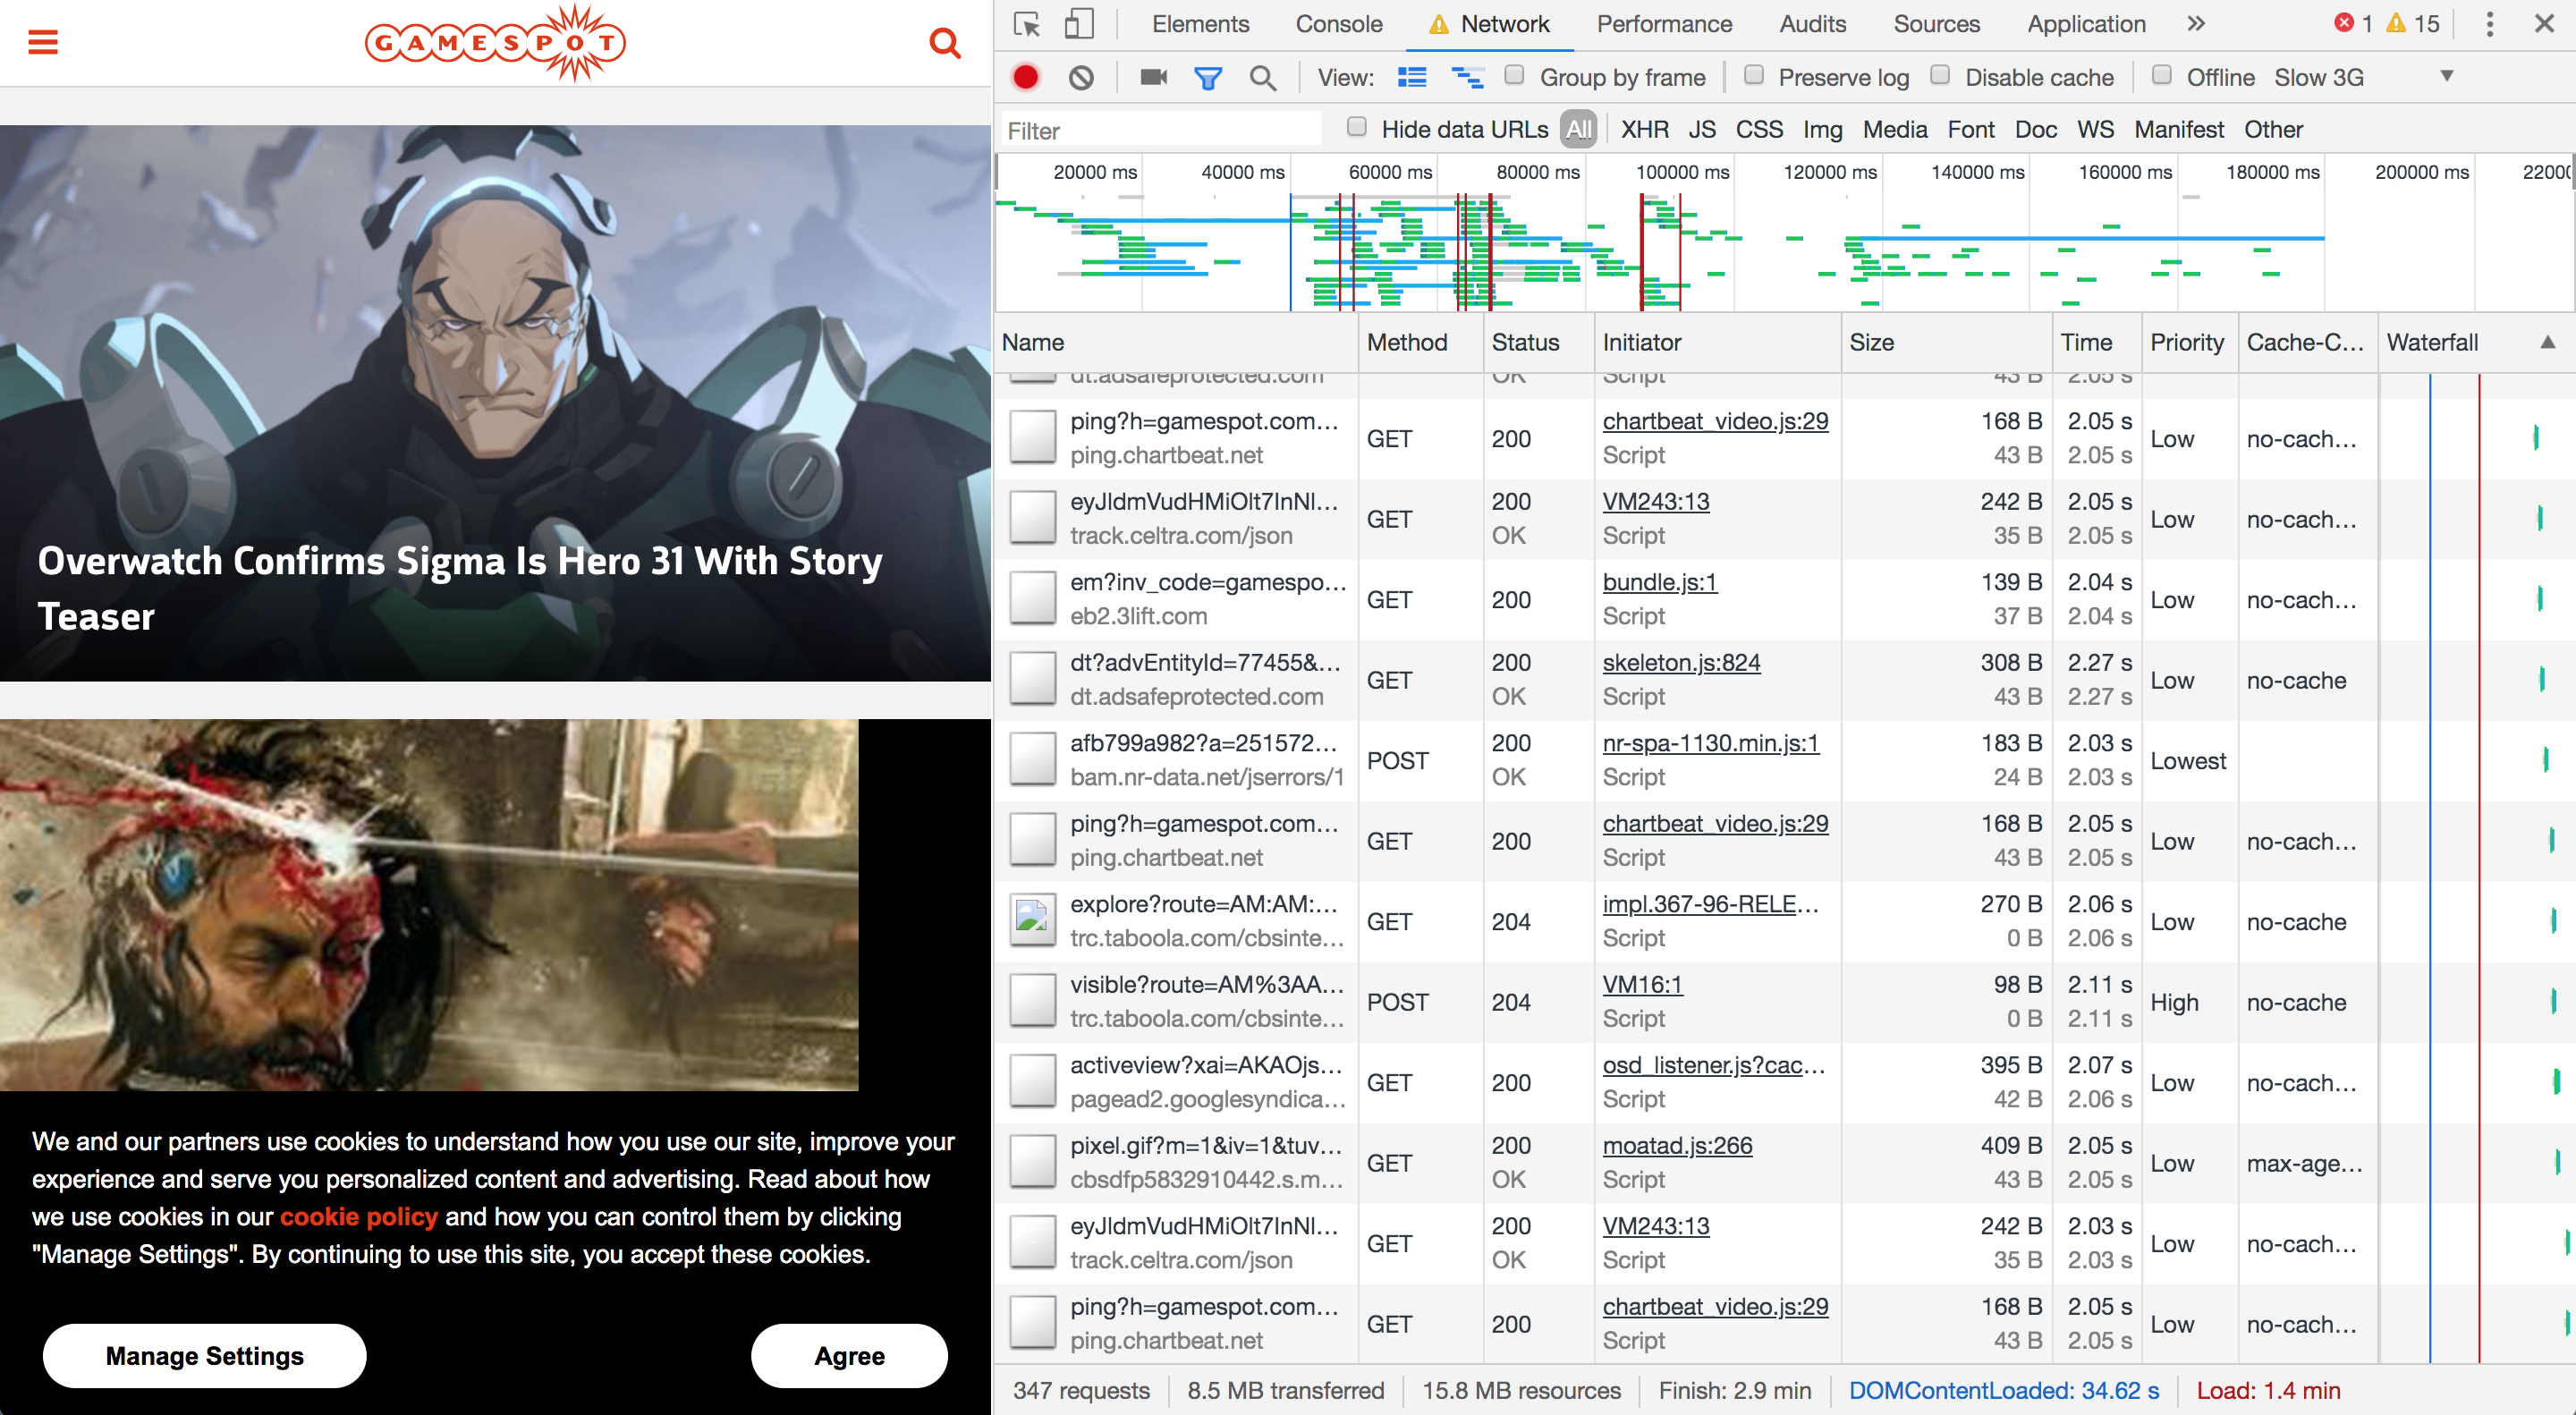
6.5 MB of this was down to an autoplaying video halfway down the page, which — to be fair — didn’t appear to download until I began scrolling. Nevertheless…

I could only see half the video in my viewport — the right hand side was clipped. It was also 30 seconds long, and I would wager that most people won’t sit and watch the whole thing. This single asset more than tripled the size of the page.
Performance Tip 13: Don’t Preload Video
As a rule, unless your site’s primary mode of communication is video, don’t preload it.
If you’re YouTube or Netflix, it’s reasonable to assume that someone coming to your page will want the video to auto-load and auto-play. There is an expectation that the video will chew through some data, but that it’s a fair exchange for the content. But if you’re a site whose primary medium is text and image — and you just happen to offer additional video content — then don’t preload the video.
Think of news articles with embedded videos. Many users only want to skim the article headline before moving on to their next thing. Others will read the article but ignore any embeds. And others will diligently click and watch each embedded video. We shouldn’t hog the bandwidth of every user on the assumption that they’re going to want to watch these videos.
To reiterate: users don’t like autoplaying video. As developers we only do it because our managers tell us to, and they only tell us to do it because all the coolest apps are doing it, and the coolest apps are only doing it because video ads generate 20 to 50 times more revenue than traditional ads. Google Chrome has started blocking autoplay videos for some sites, based on personal preferences, so even if you develop your site to autoplay video, there’s no guarantee that’s the experience your users are getting.
If we agree that it’s a good idea to make video an opt-in experience (click to play), we can take it a step further and make it click to load too. That means mocking a video placeholder image with a play button over it, and only downloading the video when you click the play button. People on fast connections should notice no difference in buffer speed, and people on slow connections will appreciate how fast the rest of your site loaded because it didn’t have to preload a large video file.
Anyway, back to Gamespot, where I was indeed forced to preload a large video file I ended up not watching. I then clicked through to a game review page that weighed another 8.5 MB, this time with 5.4 MB of video, before I even started scrolling down the page.
What was really galling was when I looked at what the video actually was. It was an advert for a Samsung TV! This advert cost me $0.40 of my Zimbabwe wages. Not only was it pre-loaded, but it also didn’t end up playing anywhere as far as I’m aware, so I never actually saw it.

The ‘real’ video — the gameplay footage (in other words, the content) — wasn’t actually loaded until I clicked on it. And that ploughed through my remaining data in seconds.
That’s it. That’s my 50 MB gone. I’ll need to work another 1.5 days as a Zimbabwean schoolteacher to repeat the experience.
Performance Tip 14: Optimize For First Page Load
What’s striking is that I used 50 MB of data and in most cases, I only visited one or two pages on any given site. If you think about it, this is true of most user journeys today.
Think about the last time you Googled something. You no doubt clicked on the first search result. If you got your answer, you closed the tab, or else you hit the back button and moved onto the next search result.
With the exception of a few so-called ‘destination sites’ such as Facebook or YouTube, where users habitually go as a starting point for other activities, the majority of user journeys are ephemeral. We stumble across random sites to get the answers to our questions, never to return to those sites again.
Web development practices are heavily skewed towards optimising for repeat visitors. “Cache these assets — they’ll come in handy later”. “Pre-load this onward journey, in case the user clicks to read more”. “Subscribe to our mailing list”.
Instead, I believe we should optimize heavily for one-off visitors. Call it a controversial opinion, but maybe caching isn’t really all that important. How important can a cached resource that never gets surfaced again be? And perhaps users aren’t actually going to subscribe to your mailing list after reading just the one article, so downloading the JavaScript and CSS for the mail subscription modal is both a waste of data and an annoying user experience.
The Decline Of Proxy Browsers
I had hoped to try out Opera Mini as part of this experiment. Opera Mini is a mobile web browser which proxies web pages through Opera’s compression servers. It accounts for 1.42% of global traffic as of June 2019, according to caniuse.com.
Opera Mini claims to save up to 90% of data by doing some pretty intensive transcoding. HTML is parsed, images are compressed, styling is applied, and a certain amount of JavaScript is executed on Opera’s servers. The server doesn’t respond with HTML as you might expect — it actually transcodes the data into Opera Binary Markup Language (OBML), which is progressively loaded by Opera Mini on the device. It renders what is essentially an interactive ‘snapshot’ of the web page — think of it as a PDF with hyperlinks inside it. Read Tiffany Brown’s excellent article, “Opera Mini and JavaScript” for a technical deep-dive.
It would have been a perfect way to eek my 50 MB budget as far as possible. Unfortunately, Opera Mini is no longer available on iOS in the UK. Attempting to visit it in the app store throws an error:

It’s still available “in some markets” but reading between the lines, Opera will be phasing out Opera Mini for its new app — Opera Touch — which doesn’t have any data-saving functionality apart from the ability to natively block ads.
Opera desktop used to have a ‘Turbo mode’, acting as a traditional proxy server (returning a HTML document instead of OBML), applying data-saving techniques but less intensively than Opera Mini. According to Opera, JavaScript continues to work and “you get all the videos, photos and text that you normally would, but you eat up less data and load pages faster”. However, Opera quietly removed Turbo mode in v60 earlier this year, and Opera Touch doesn’t have a Turbo mode either. Turbo mode is currently only available on Opera for Android.
Android is where all the action is in terms of data-saving technology. Chrome offers a ‘Lite mode’ on its mobile browser for Android, which is not available for iPhones or iPads because of “platform constraints“. Outside of mobile, Google used to provide a ‘Data Saver’ extension for Chrome desktop, but this was canned in April.
Lite mode for Chrome Android can be forcibly enabled, or automatically kicks in when the network’s effective connection type is 2G or worse, or when Chrome estimates the page will take more than 5 seconds to reach first contentful paint. Under these conditions, Chrome will request the lite version of the HTTPS URL as cached by Google’s servers, and display this stripped-down version inside the user’s browser, alongside a “Lite” marker in the address bar.
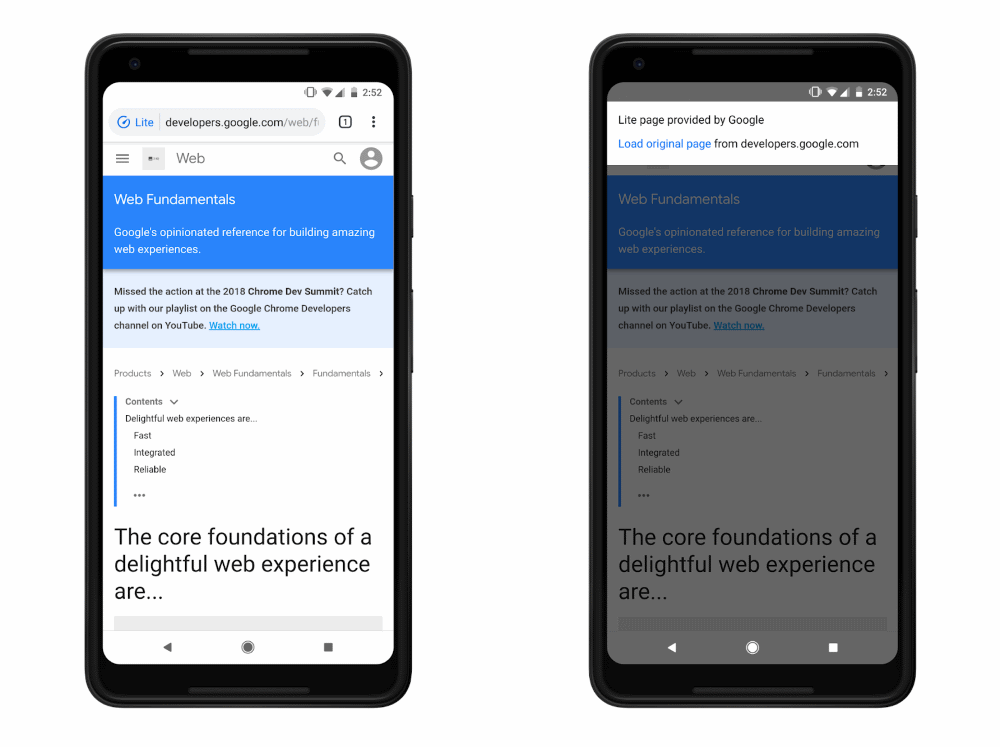
I’d love to try it out — apparently it disables scripts, replaces images with placeholders, prevents loading of non-critical resources and shows offline copies of pages if one is available on the device. This saves up to 60% of data. However, it isn’t available in private (Incognito) mode, which hints at some of the privacy concerns surrounding proxy browsers.
Lite mode shares the HTTPS URL with Google, therefore it makes sense that this mode isn’t available in Incognito. However other information such as cookies, login information, and personalised page content is not shared with Google — according to ghacks.net — and “never breaks secure connections between Chrome and a website”. One wonders why seemingly none of these data-saving services are allowed on iOS (and there is no news as to whether Lite mode will ever become available on iOS).
Data saver proxies require a great deal of trust; your browsing activity, cookies and other sensitive information are entrusted to some server, often in another country. Many proxies simply won’t work anymore because a lot of sites have moved to HTTPS, meaning initiatives such as Turbo mode have become a largely “useless feature“. HTTPS prevents this kind of man-in-the-middle behaviour, which is a good thing, although it has meant the demise of some of these proxy services and has made sites less accessible to those on poor connections.
I was unable to find any OSX or iOS compatible data-saving tool except for Bandwidth Hero for Firefox (which requires setting up your own data compression service — far beyond the technical capabilities of most users!)
Conclusion
Reducing the data footprint of your website goes hand in hand with improving frontend performance. It is the single most reliable thing you can do to speed up your site.
In addition to the cost of data, there are lots of good reasons to focus on performance, as described in a GOV.UK blog post on the subject:
- 53% of users will abandon a mobile site if it takes more than 3 seconds to load.
- People have to concentrate 50% more when trying to complete a simple task on a website using a slow connection.
- More performant web pages are better for the battery life of the user’s device, and typically require less power on the server to deliver. A performant site is good for the environment.
We don’t have the power to change the global cost of data inequality. But we do have the power to lessen its impact, improving the experience for everyone in the process.
Further Reading
- How To Monitor And Optimize Google Core Web Vitals
- Conducting Accessibility Research In An Inaccessible Ecosystem
- Using AI For Neurodiversity And Building Inclusive Tools
- Connecting With Users: Applying Principles Of Communication To UX Research


