How To Empower Design Teams By Measuring Value

Email Newsletter
Weekly tips on front-end & UX.
Trusted by 182,000+ folks.


 Celebrating 10 million developers
 Custom Web Forms for Angular, React, & Vue. Your backend.
The business value of design has been proven at scale by the McKinsey Design Index. The report shows the best design performers increased their revenues and shareholder returns at nearly twice the rate of their industry counterparts.
However, we still see designers struggling with these common problems:
- Projects are stop and start designers lose momentum and focus;
- Potentially impactful design work isn’t put into production;
- Designers are given solutions and have to try and bring projects back to the problem;
- Stakeholders aren’t involved or our out of reach;
- Business strategies and desired outcomes aren’t clear;
- and the list goes on.
With the right people, enough rigor, patience and pragmatism. These problems can be solved, but then we often start all over again on the next project.
We are great at measuring usability and analytics. We can show how we’ve increased conversion rates on our e-commerce store, or how far people scroll down a page. In doing so we have created a culture of the world’s best design brains thinking about how to get more people to click a button.
We need to change this, we need to start measuring the potential for impact, of design, in a consistent way. We need a metric that people can see and they want to move.
Meet DIET (Design Impact Evaluation Tactic)
DIET asks key questions, that are fundamental for designers to be impactful in their work. The designer’s answers give a DIET score at the key stages of the project.
Numbers are powerful they give us an object to point at and discuss. They keep the conversation focused. The meaning behind a number is more important to designers, the why, not the what. Having the ingredients for good design baked into a number helps cross the divide of design and business metrics.
Why We Focus On Product Metrics Instead
“The first step is to measure whatever can be easily measured. This is OK as far as it goes. The second step is to disregard that which can’t be easily measured or to give it an arbitrary quantitative value. This is artificial and misleading. The third step is to presume that what can’t be measured easily really isn’t important. This is blindness. The fourth step is to say that what can’t be easily measured really doesn’t exist. This is suicide.”
— “Corporate Priorities: A continuing study of the new demands on business,” Daniel Yankelovich, 1972
Kristin Zibell’s table of UX metrics is a fantastic way to measure the customer experience, linking UX metrics directly to business goals.
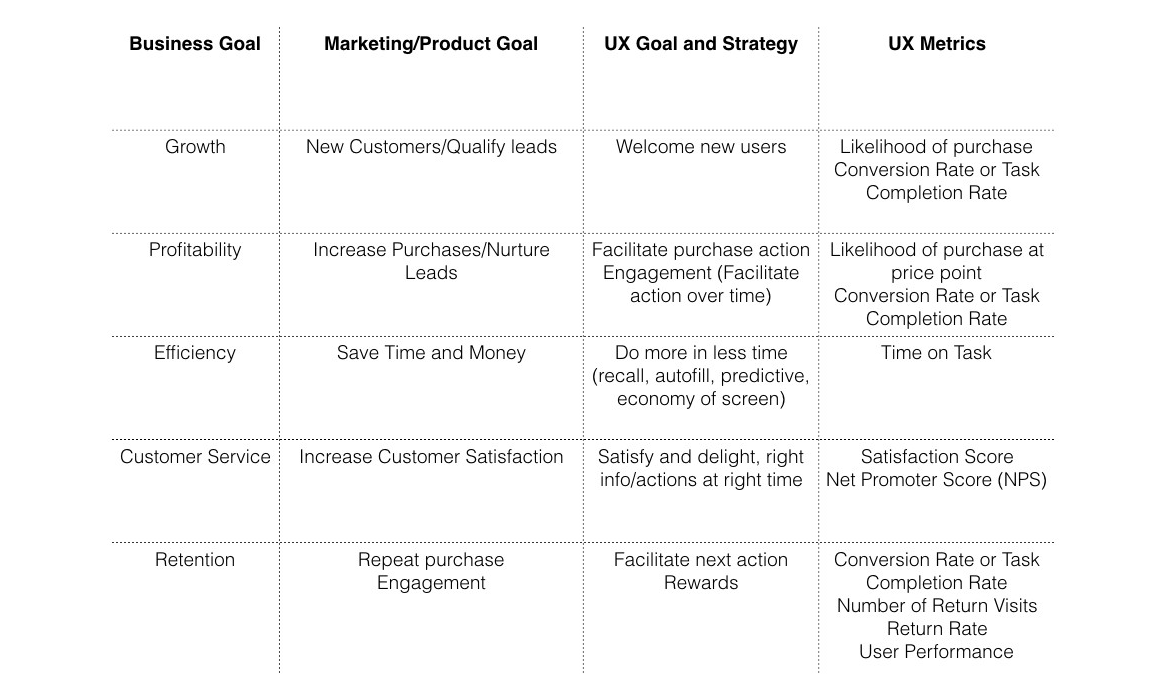
However, the potential value of design can’t be measured using a product metric such as conversion rate or time on task. What we are measuring here is the outcome of a product.
The product could be a square wheel or a chocolate fireguard, improving these products may show better metrics but is a means to an end.
If we as designers are spending all our time trying to move a needle how and where does innovation live in our work?
Measurements Gives Us A Language
Back in the 1700s, people were measuring temperature using cylinders of water and wine. This resulted in inaccurate measurements. It wasn’t until Fahrenheit came along and introduced constants to measure from, that things improved.
In one of his early experiments of constants, Fahrenheit used a glass of icy water as a low scale, and the upper scale being his wife’s armpit. Having the two constants meant he could measure temperatures against them. Fahrenheit went on to invent the mercury thermometer. The German’s scale of measuring temperature is still used in the United States today.
Fahrenheit gives us a consistent language to talk about the measurement of things. “It’s 120 degrees Fahrenheit outside” instantly informs you that it’s going to be very hot today, so don’t forget to wear sunscreen.
So, Like Fahrenheit, Do We Have A Glass Of Icy Water And An Armpit?
Design lives and breaths in different environments in different ways. In larger orgs projects, often balloon so get ditched or pivot. Stakeholders or key decision-makers can be out of reach. Business strategy can be unclear and not communicated well. Teams are fluid and can often be without the skills needed. All of these things are part of the ingredients which either prevent or allow design to thrive and grow.
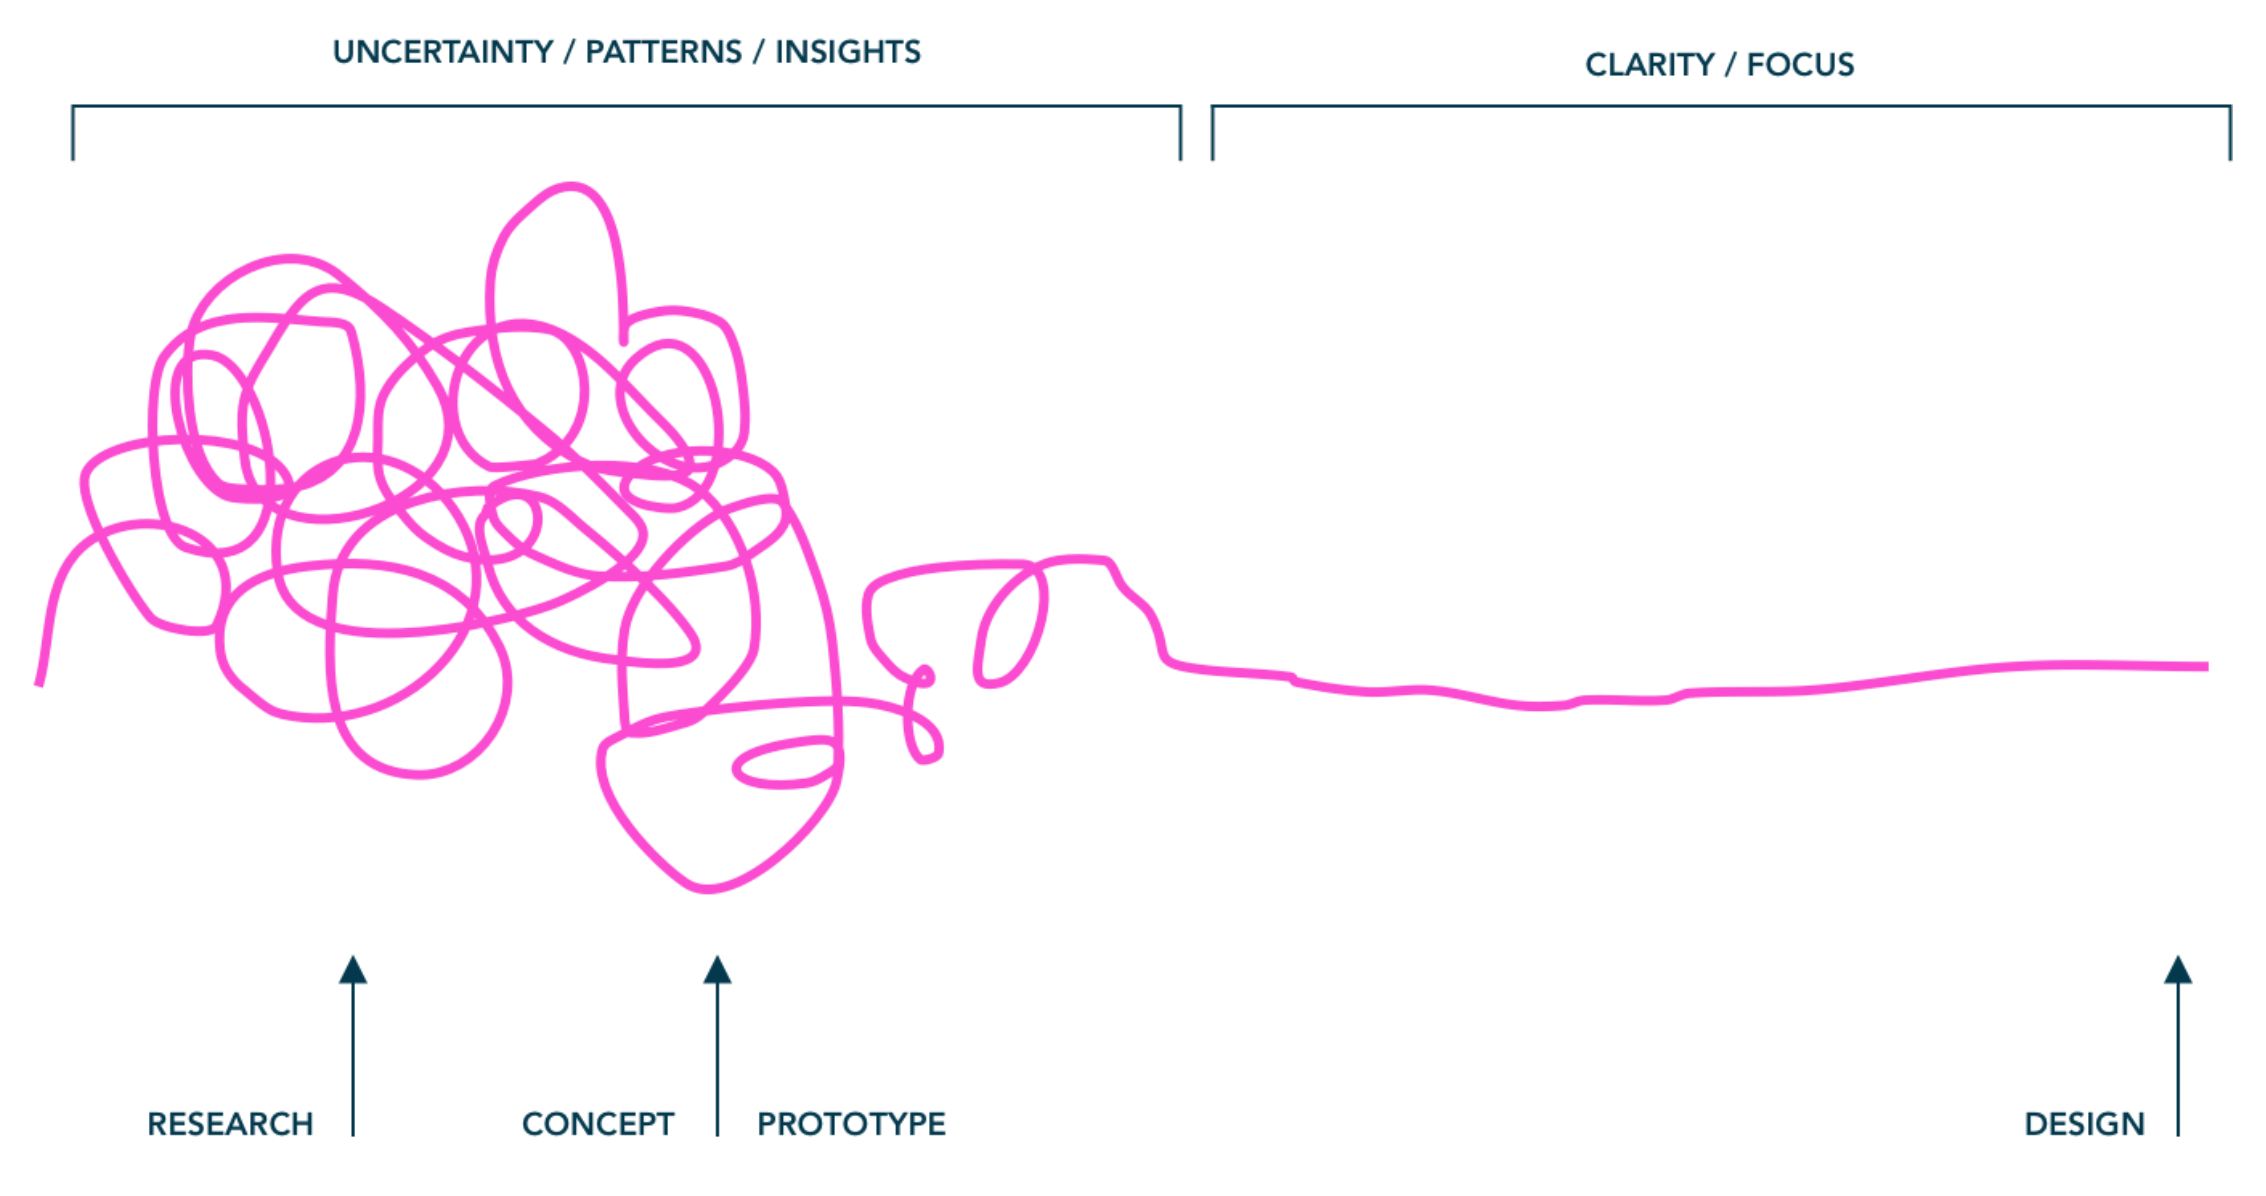
The British design council suggested in 2005 that designers share similar approaches in their process, which they mapped out as the Double Diamond. The Double Diamond consists of a problem space and a solution space. The shape of the diamond is to represent divergent (thinking broadly) thinking and convergent (narrowing things down) thinking.
With designers on different projects, I mapped the journey of a design project from start to finish.
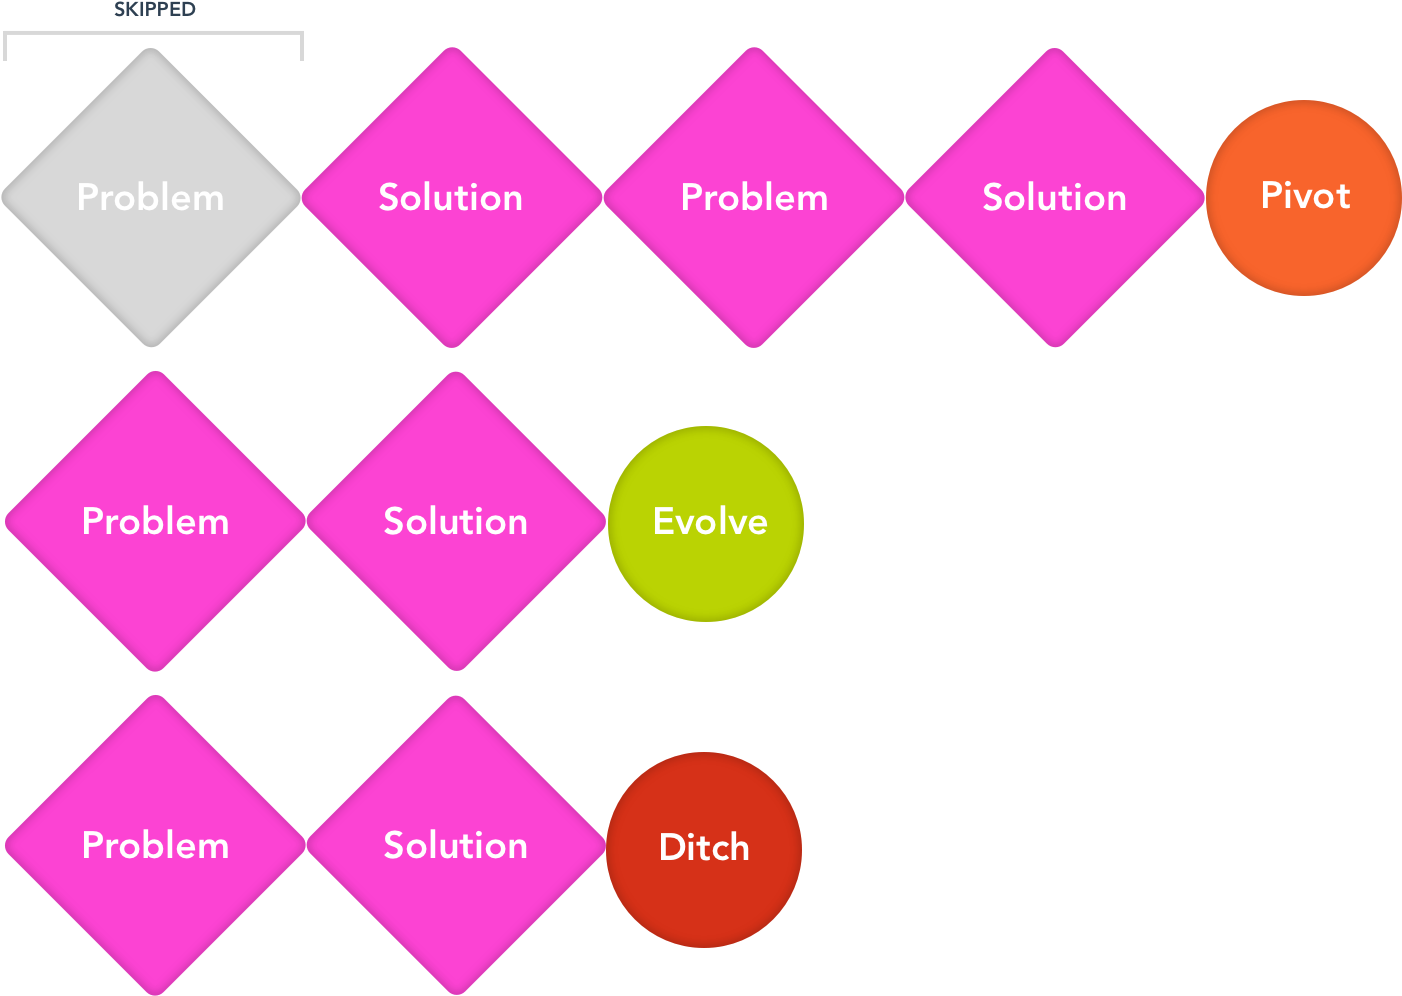
Here are examples of 3 projects:
- Team 1 completely missed out the problem stage, as they didn’t have a researcher at the time. Time passes and eventually the project pivots.
- Team 2 followed a Lean UX process and their project evolved.
- Whereas Team 3 used a Google sprint and their project got ditched.
So, some projects evolve or pivot and some get ditched, but we don’t record why?
Looking Beyond The Double Diamond
Often projects come to a design team in the form of a brief. This will be part of the business’s overall strategy. Market research and predictions of future trends inform this strategy space.
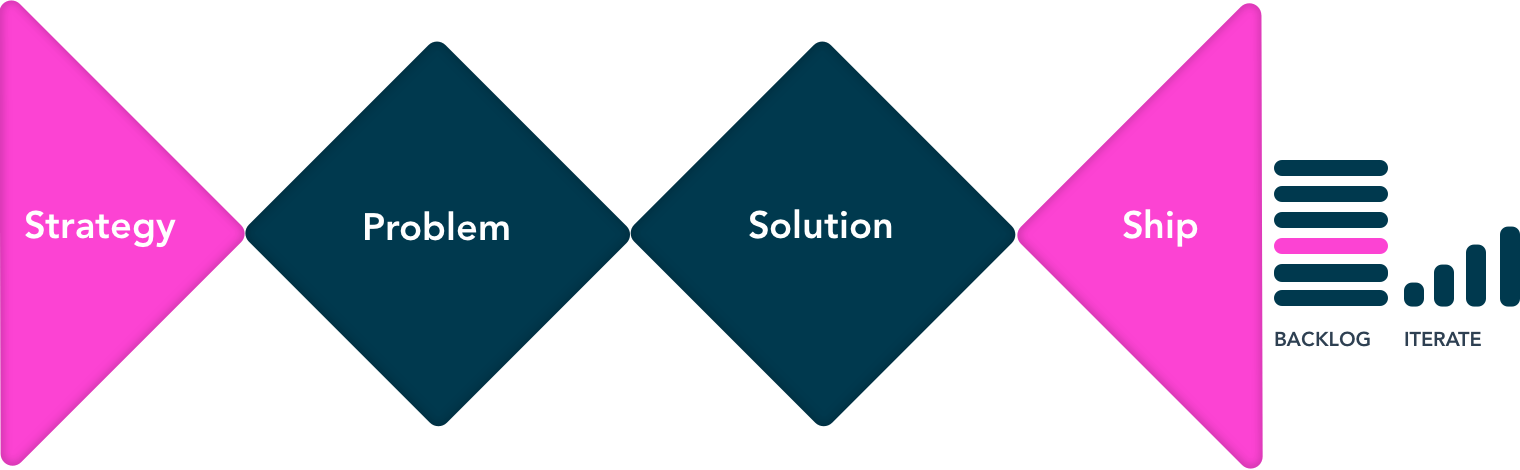
The ship and backlog space are often managed outside of the design team and very few designers I spoke to understood how work got prioritized here.
The View From A Stakeholder
Stakeholders are likely to be looking after many projects, which live in the strategy chain.
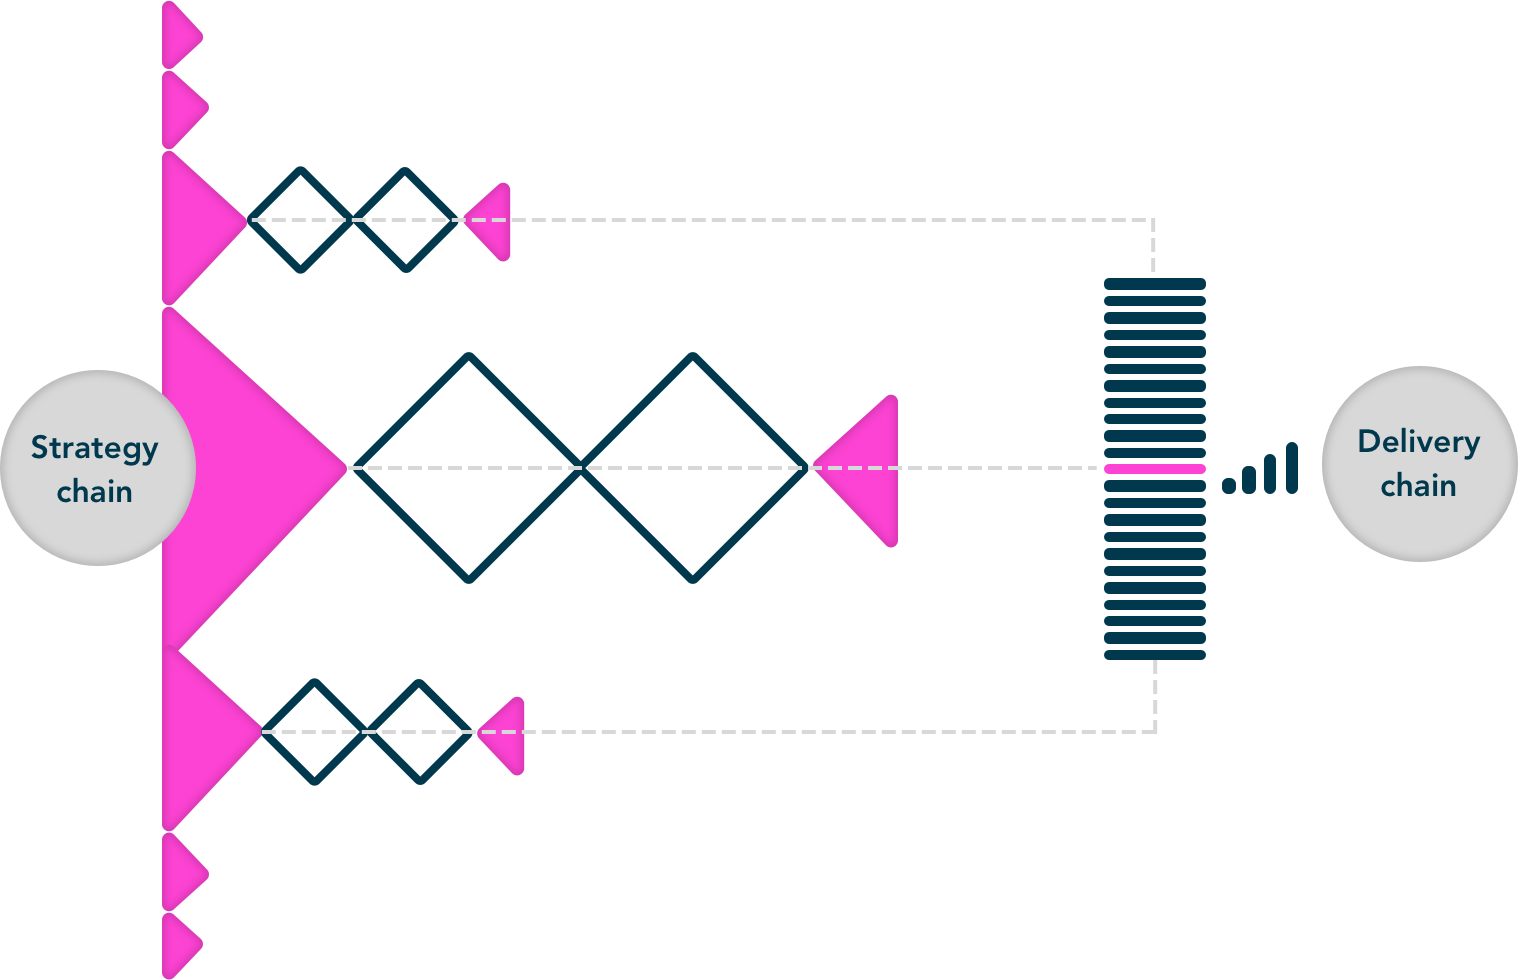
Projects in the strategy chain will be intrinsically linked, and require a holistic view of a business. So it’s not surprising that stakeholders just want to get things through to the delivery chain.
Strategically the business will look into future trends and consider finance and risk to the business. There will be a lot of technical input too, can we build this with our current infrastructure? Shall we purchase a 3rd party solution? How can we reduce the risk and cost to the business?
So what ends up happening is. Projects balloon, time in the problem and solution space increases.
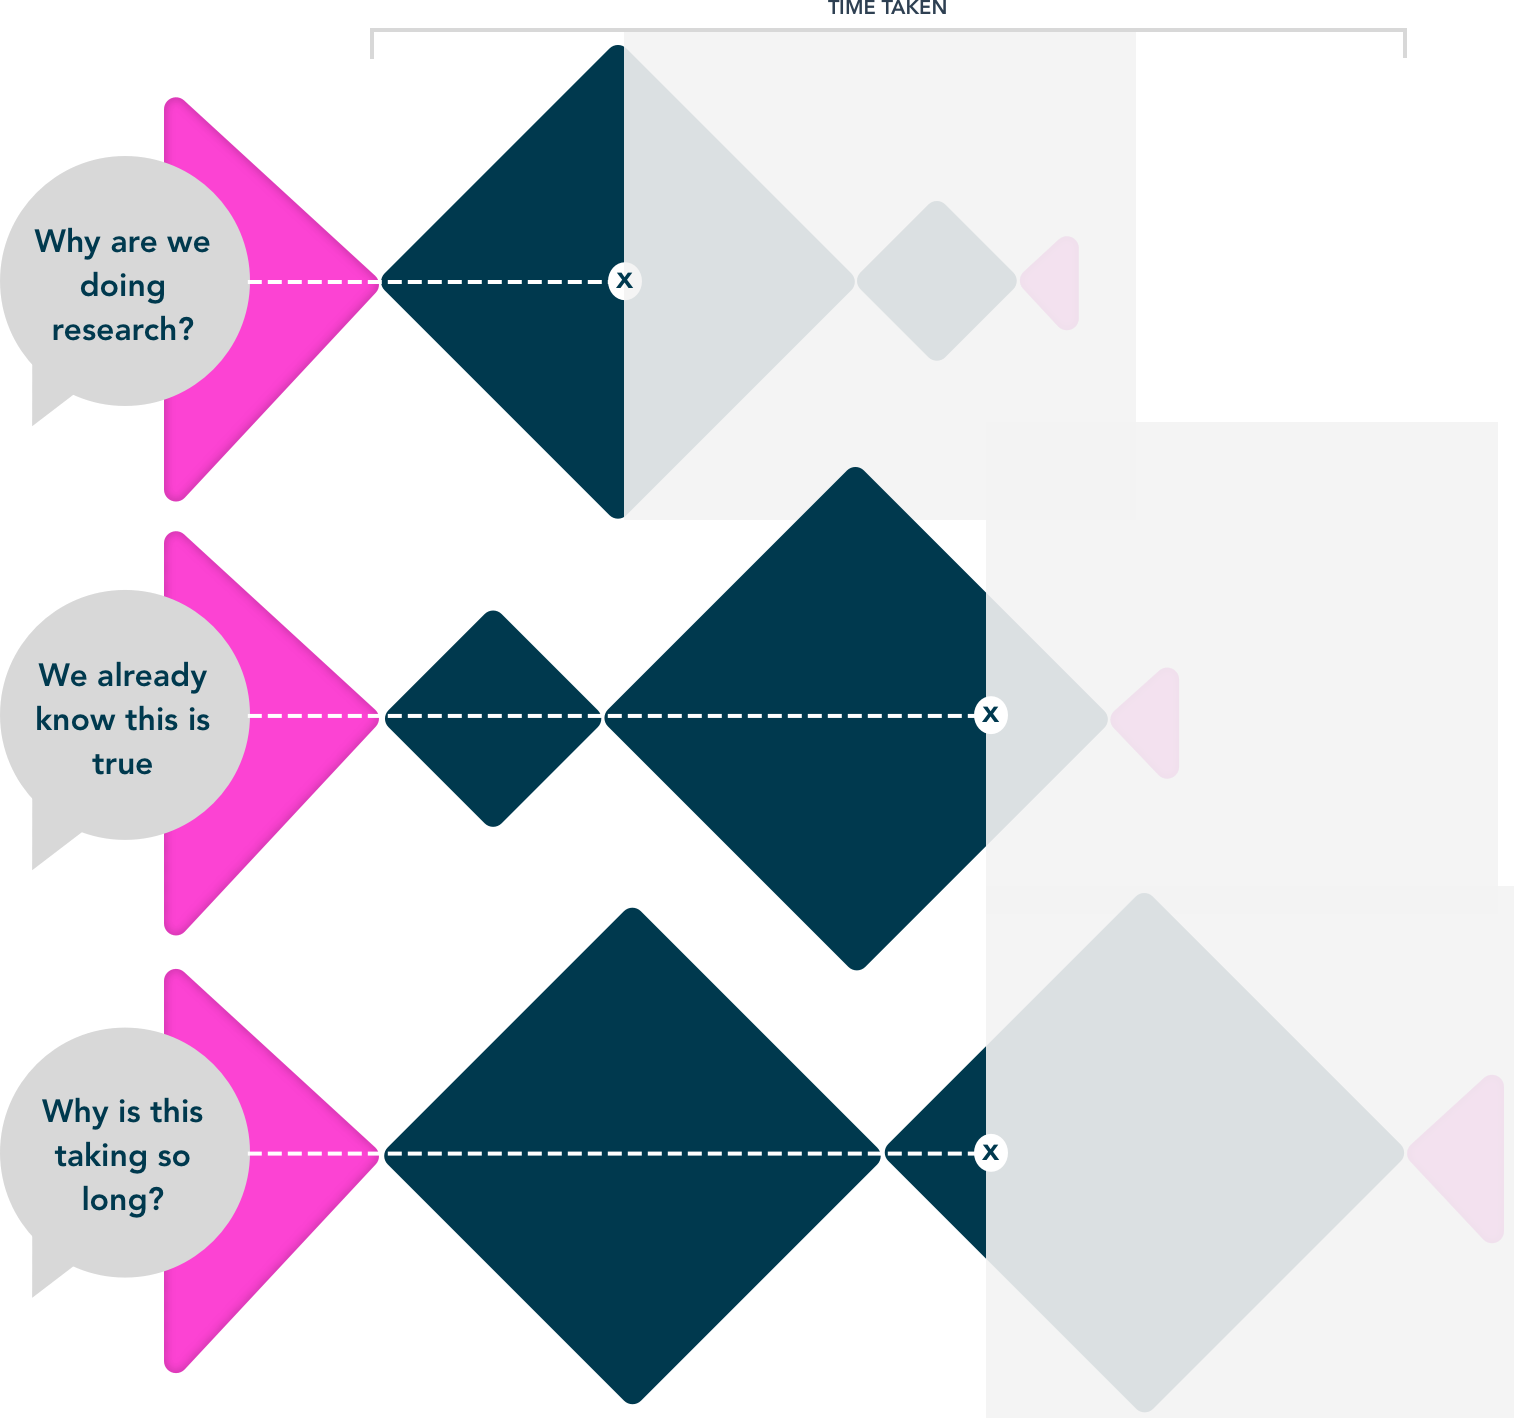
Designers get asked questions in show-and-tells and presentations. Like “Why are we doing research?”, “We already know this is true”, “Why is this taking so long?”
Ultimately design projects often die in these scenarios. Or can lead to poor outcomes.
A solution could be better communication, clearer strategies, shouldn’t all this be managed better in the boardroom? Perhaps but, teams change, stakeholders come and go. We fight the same fights over and over. We don’t have a common language like Fahrenheit to describe design impact.
"People value data at scale, data makes decision making easier, as there is something to hang the decision off."
DIET can give you that data.
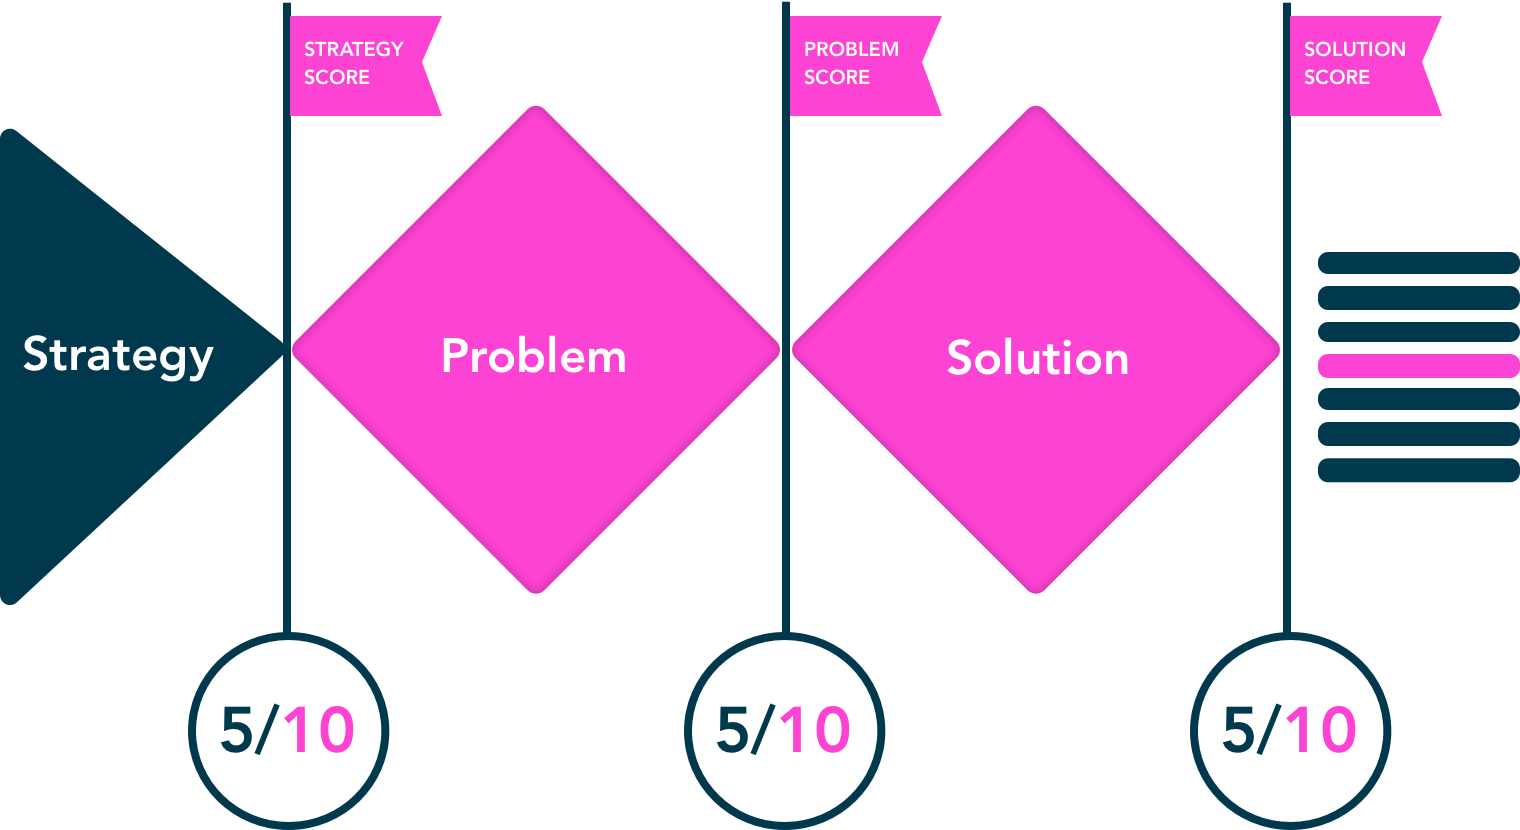
How DIET Works
At each stage of a project, the team answers 5 questions and is given a score out of 10. The questions are based on the foundations that designers need to be impactful with their work
Stage One
The strategy stage is for when you first hear about a project.
- We understand the business need/outcome.
- We understand the user needs.
- The subject matter experts & stakeholders are involved.
- The constraints (financial, time & tech) of the project are clear.
- Do we have the skills needed?
Stage Two
The problem stage is when you have completed your research on this particular problem.
- We know how people currently solve the problem.
- The problem resonates with our users.
- We are solving the right problem.
- The subject matter experts & stakeholders are involved?
- Do we have the skills needed?
Stage Three
The solution stage is when you have designed and tested your solution.
- Our solution solved the problem.
- Our solution is commercially viable.
- Our solution is going to be put live.
- Have we recorded our learnings?
- Have we shared our story?
To be impactful we need to work within our constraints, for our projects to be viable. If we are consistently designing stuff that can’t go live, we just build design debt and frustration.
Here are examples of two projects that have DIET scores:
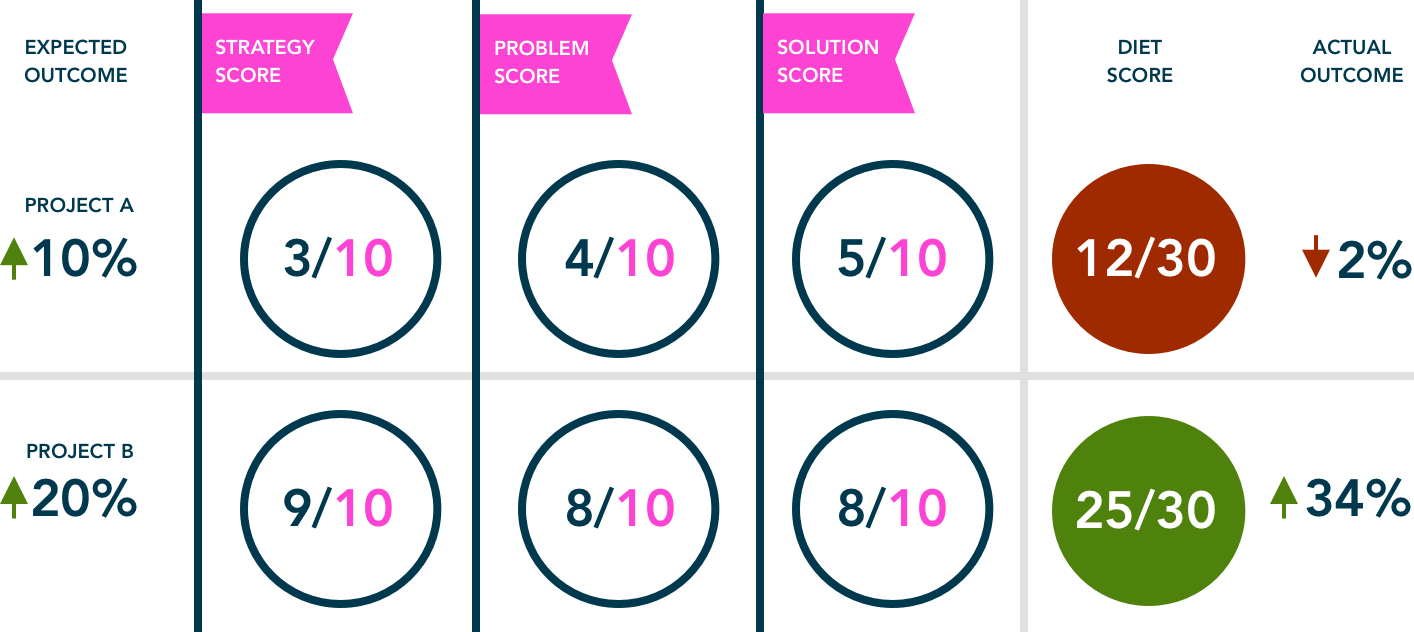
Project A had low scores all the way through and resulted in a poor outcome. Project B scored highly and the outcome is good.
Having a score from teams of predicted impact and matching that against actual impact. It gives us a base to show how, why and even if our design foundations work. Once you know a constant exists, you can make predictions about things yet to be discovered.
Over time, we have a constant to measure from. We can use this constant to learn where and why design impact succeeds and why it fails.
- Is attrition rate (staff turnover) linked to low scores?
- Do low-scoring projects take more time?
- Do low-scoring projects mean poor team health?
How To Use DIET
- At each stage of the project (Strategy, Problem & Solution);
- Every two weeks on a Monday or at the start of a sprint cycle;
- In the retro at the end of the project.
To get started with DIET, you’ll need a copy of our DIET score Google Sheet to record your scores. You can then start with scoring the strategy.
What We Have Learned
The feedback loop is large and the effort to constantly keep teams tracking scores is challenging. However, we have seen these benefits.
- DIET acts as a good early warning signal;
- DIET helps teams share knowledge earlier and on a regular basis;
- DIET gives people the confidence to speak to their managers.
We have a long way to go and are still learning. The project is open source and we’d love to hear your thoughts and get your input to learn more.
One Voice For Design
Good communication across all levels is a common trait in successful teams. Having a tool which gives a constant to communicate design impact at scale gives consistency to our communications. Is DIET a way to do this?
Further Reading
- When Friction Is A Good Thing: Designing Sustainable E-Commerce Experiences
- How Developers Can Strengthen Their Mental Health Amidst High-Pressure Projects
- Getting To The Bottom Of Minimum WCAG-Conformant Interactive Element Size
- Building A User Segmentation Matrix To Foster Cross-Org Alignment


