How We Improved Our Core Web Vitals (Case Study)

Email Newsletter
Weekly tips on front-end & UX.
Trusted by 182,000+ folks.


 Celebrating 10 million developers
 Custom Web Forms for Angular, React, & Vue. Your backend.

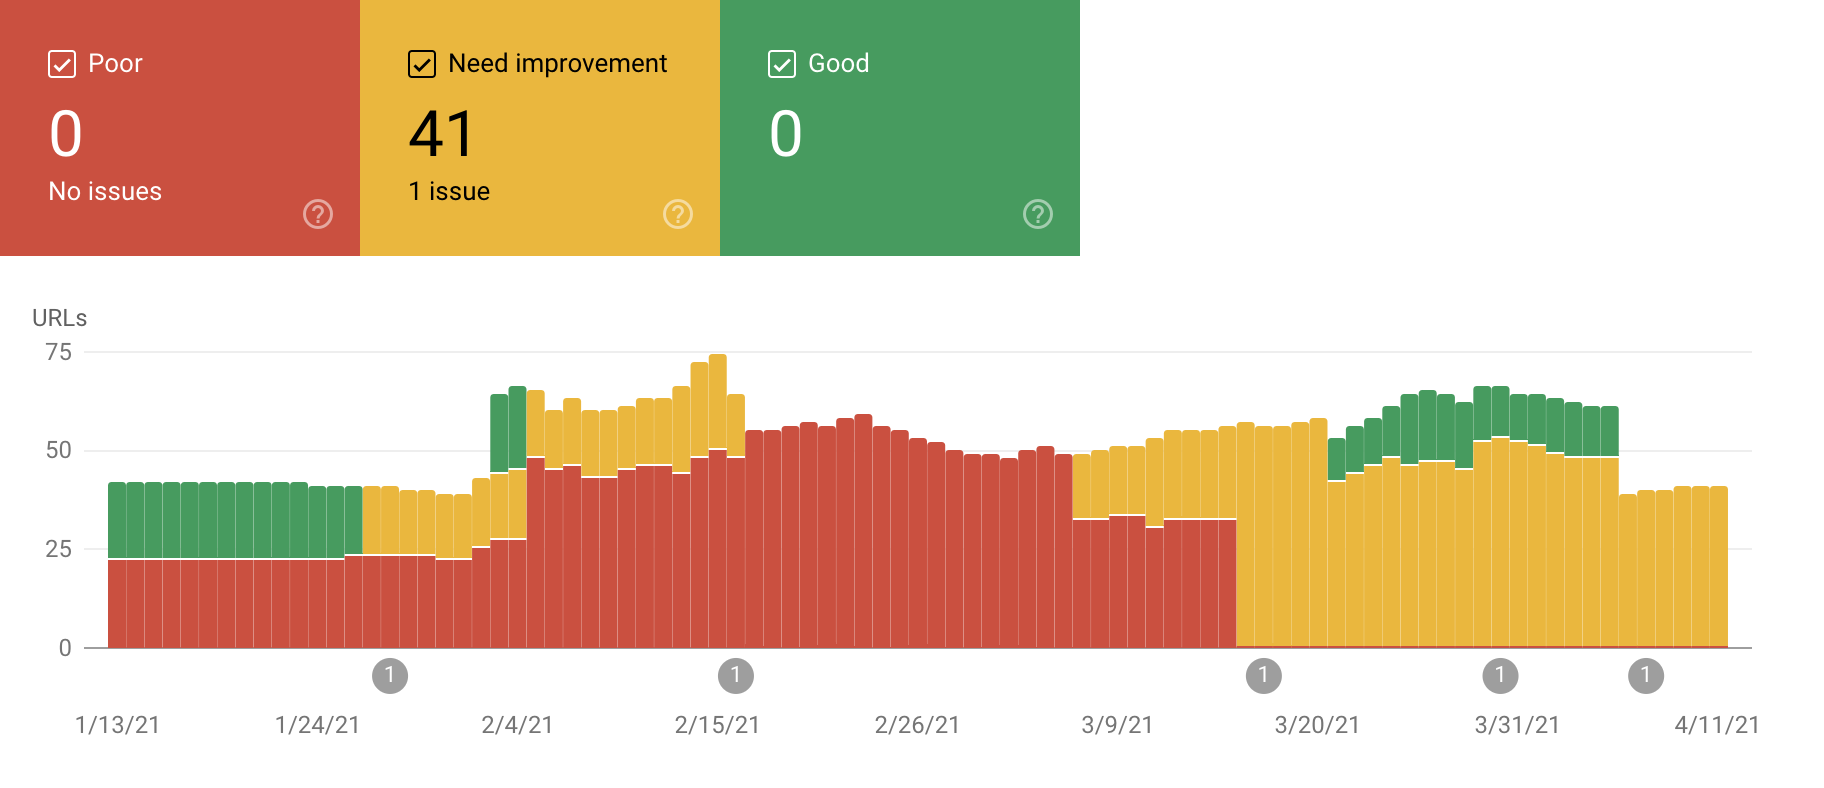
Last year, Google started emphasizing the importance of Core Web Vitals and how they reflect a person’s real experience when visiting sites around the web. Performance is a core feature of our company, Instant Domain Search—it’s in the name. Imagine our surprise when we found that our vitals scores were not great for a lot of people. Our fast computers and fiber internet masked the experience real people have on our site. It wasn’t long before a sea of red “poor” and yellow “needs improvement” notices in our Google Search Console needed our attention. Entropy had won, and we had to figure out how to clean up the jank—and make our site faster.
I founded Instant Domain Search in 2005 and kept it as a side-hustle while I worked on a Y Combinator company (Snipshot, W06), before working as a software engineer at Facebook. We’ve recently grown to a small group based mostly in Victoria, Canada and we are working through a long backlog of new features and performance improvements. Our poor web vitals scores, and the looming Google Update, brought our focus to finding and fixing these issues.
When the first version of the site was launched, I’d built it with PHP, MySQL, and XMLHttpRequest. Internet Explorer 6 was fully supported, Firefox was gaining share, and Chrome was still years from launch. Over time, we’ve evolved through a variety of static site generators, JavaScript frameworks, and server technologies. Our current front-end stack is React served with Next.js and a backend service built-in Rust to answer our domain name searches. We try to follow best practice by serving as much as we can over a CDN, avoiding as many third-party scripts as possible, and using simple SVG graphics instead of bitmap PNGs. It wasn’t enough.
Next.js lets us build our pages and components in React and TypeScript. When paired with VS Code the development experience is amazing. Next.js generally works by transforming React components into static HTML and CSS. This way, the initial content can be served from a CDN, and then Next can “hydrate” the page to make elements dynamic. Once the page is hydrated, our site turns into a single-page app where people can search for and generate domain names. We do not rely on Next.js to do much server-side work, the majority of our content is statically exported as HTML, CSS, and JavaScript to be served from a CDN.
When someone starts searching for a domain name, we replace the page content with search results. To make the searches as fast as possible, the front-end directly queries our Rust backend which is heavily optimized for domain lookups and suggestions. Many queries we can answer instantly, but for some TLDs we need to do slower DNS queries which can take a second or two to resolve. When some of these slower queries resolve, we will update the UI with whatever new information comes in. The results pages are different for everyone, and it can be hard for us to predict exactly how each person experiences the site.
The Chrome DevTools are excellent, and a good place to start when chasing performance issues. The Performance view shows exactly when HTTP requests go out, where the browser spends time evaluating JavaScript, and more:

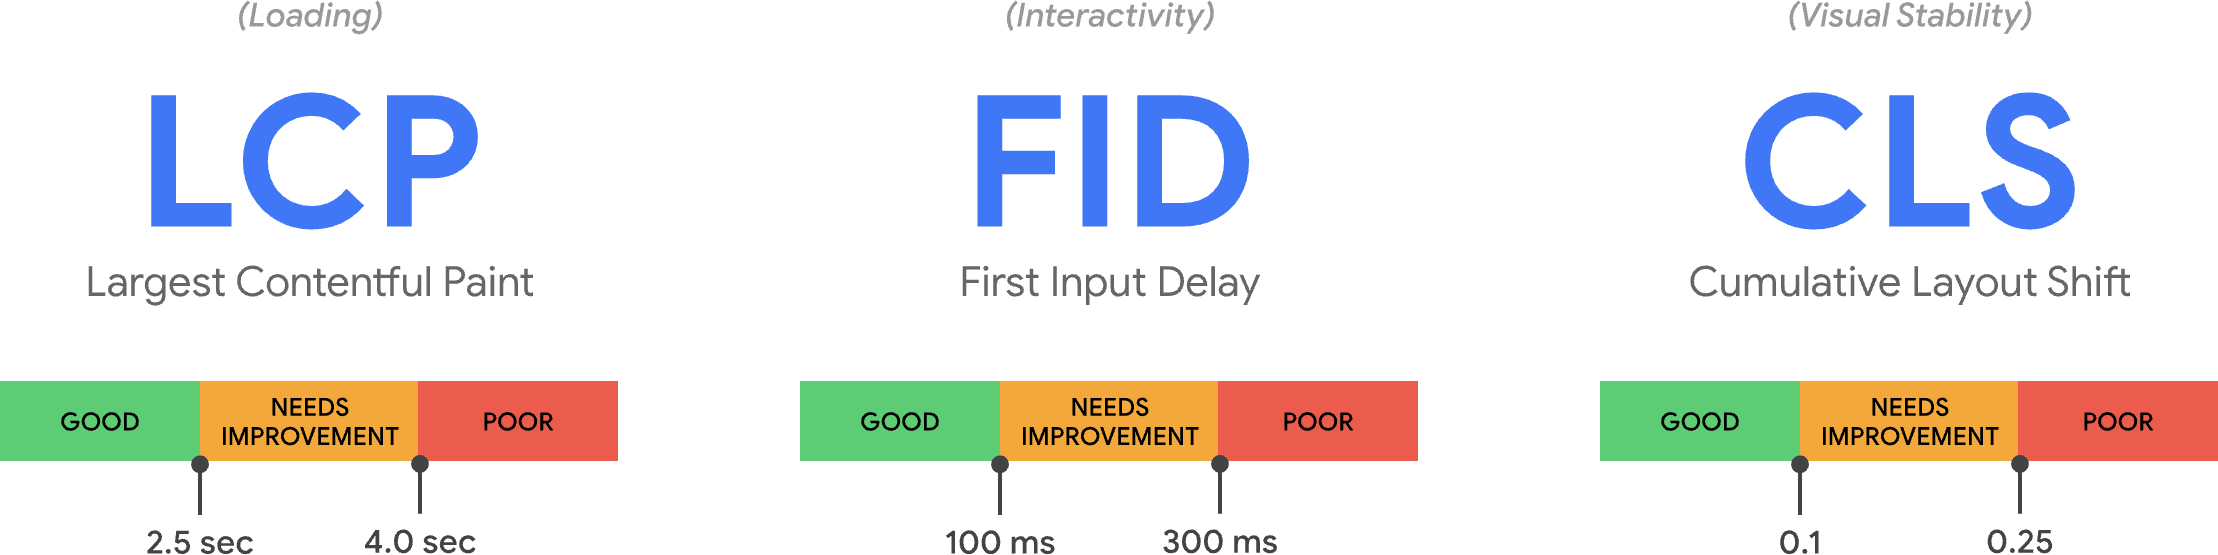
There are three Core Web Vitals metrics that Google will use to help rank sites in their upcoming search algorithm update. Google bins experiences into “Good”, “Needs Improvement”, and “Poor” based on the LCP, FID, and CLS scores real people have on the site:
- LCP, or Largest Contentful Paint, defines the time it takes for the largest content element to become visible.
- FID, or First Input Delay, relates to a site’s responsiveness to interaction—the time between a tap, click, or keypress in the interface and the response from the page.
- CLS, or Cumulative Layout Shift, tracks how elements move or shift on the page absent of actions like a keyboard or click event.

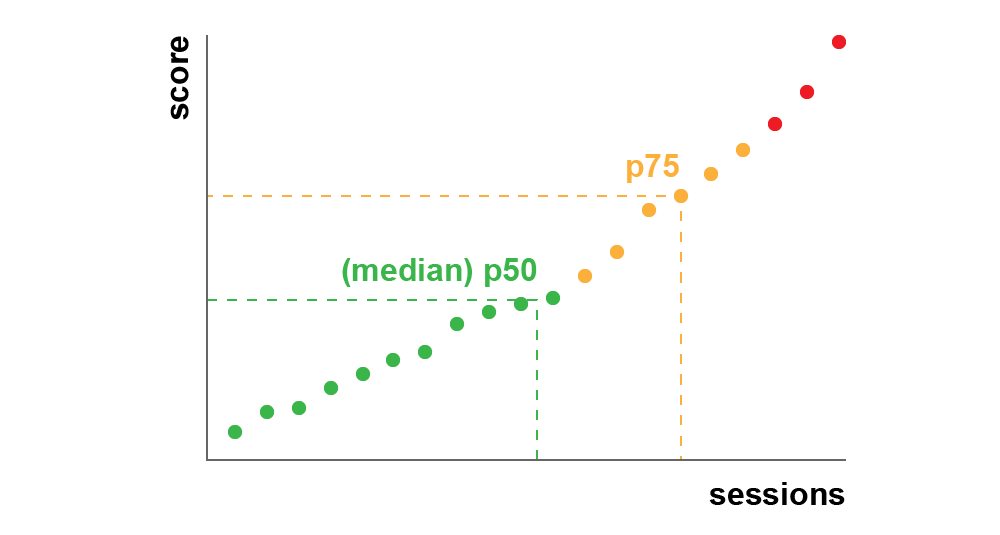
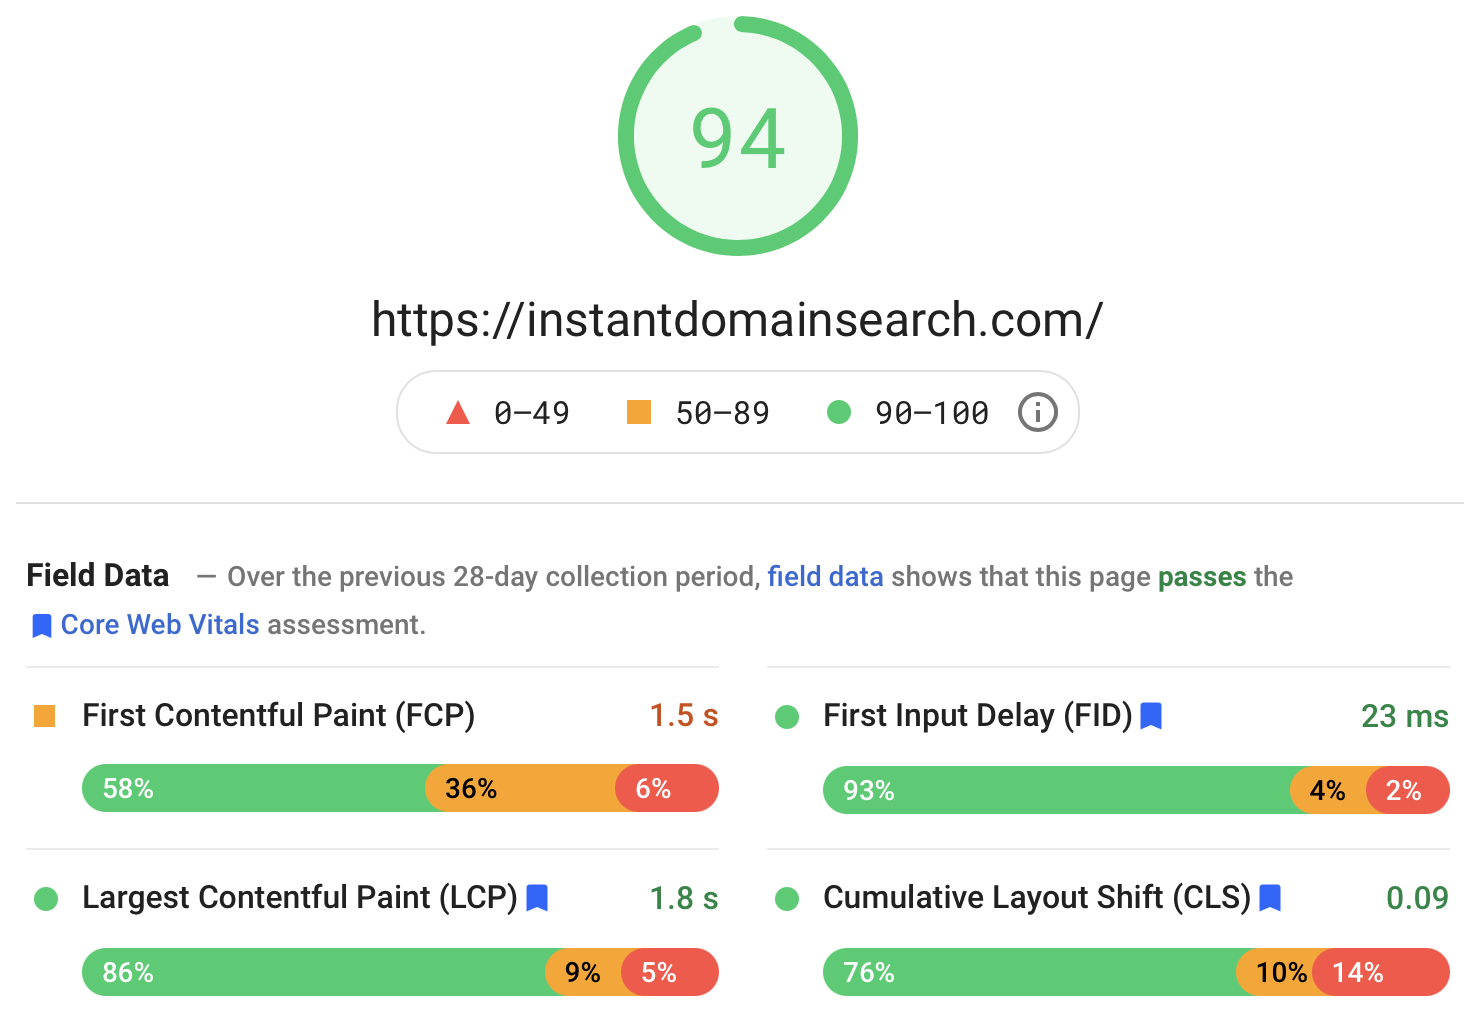
Chrome is set up to track these metrics across all logged-in Chrome users, and sends anonymous statistics summarizing a customer’s experience on a site back to Google for evaluation. These scores are accessible via the Chrome User Experience Report, and are shown when you inspect a URL with the PageSpeed Insights tool. The scores represent the 75th percentile experience for people visiting that URL over the previous 28 days. This is the number they will use to help rank sites in the update.
A 75th percentile (p75) metric strikes a reasonable balance for performance goals. Taking an average, for example, would hide a lot of bad experiences people have. The median, or 50th percentile (p50), would mean that half of the people using our product were having a worse experience. The 95th percentile (p95), on the other hand, is hard to build for as it captures too many extreme outliers on old devices with spotty connections. We feel that scoring based on the 75th percentile is a fair standard to meet.
To get our scores under control, we first turned to Lighthouse for some excellent tooling built into Chrome and hosted at web.dev/measure/, and at PageSpeed Insights. These tools helped us find some broad technical issues with our site. We saw that the way Next.js was bundling our CSS and slowed our initial rendering time which affected our FID. The first easy win came from an experimental Next.js feature, optimizeCss, which helped improve our general performance score significantly.
Lighthouse also caught a cache misconfiguration that prevented some of our static assets from being served from our CDN. We are hosted on Google Cloud Platform, and the Google Cloud CDN requires that the Cache-Control header contains “public”. Next.js does not allow you to configure all of the headers it emits, so we had to override them by placing the Next.js server behind Caddy, a lightweight HTTP proxy server implemented in Go. We also took the opportunity to make sure we were serving what we could with the relatively new stale-while-revalidate support in modern browsers which allows the CDN to fetch content from the origin (our Next.js server) asynchronously in the background.
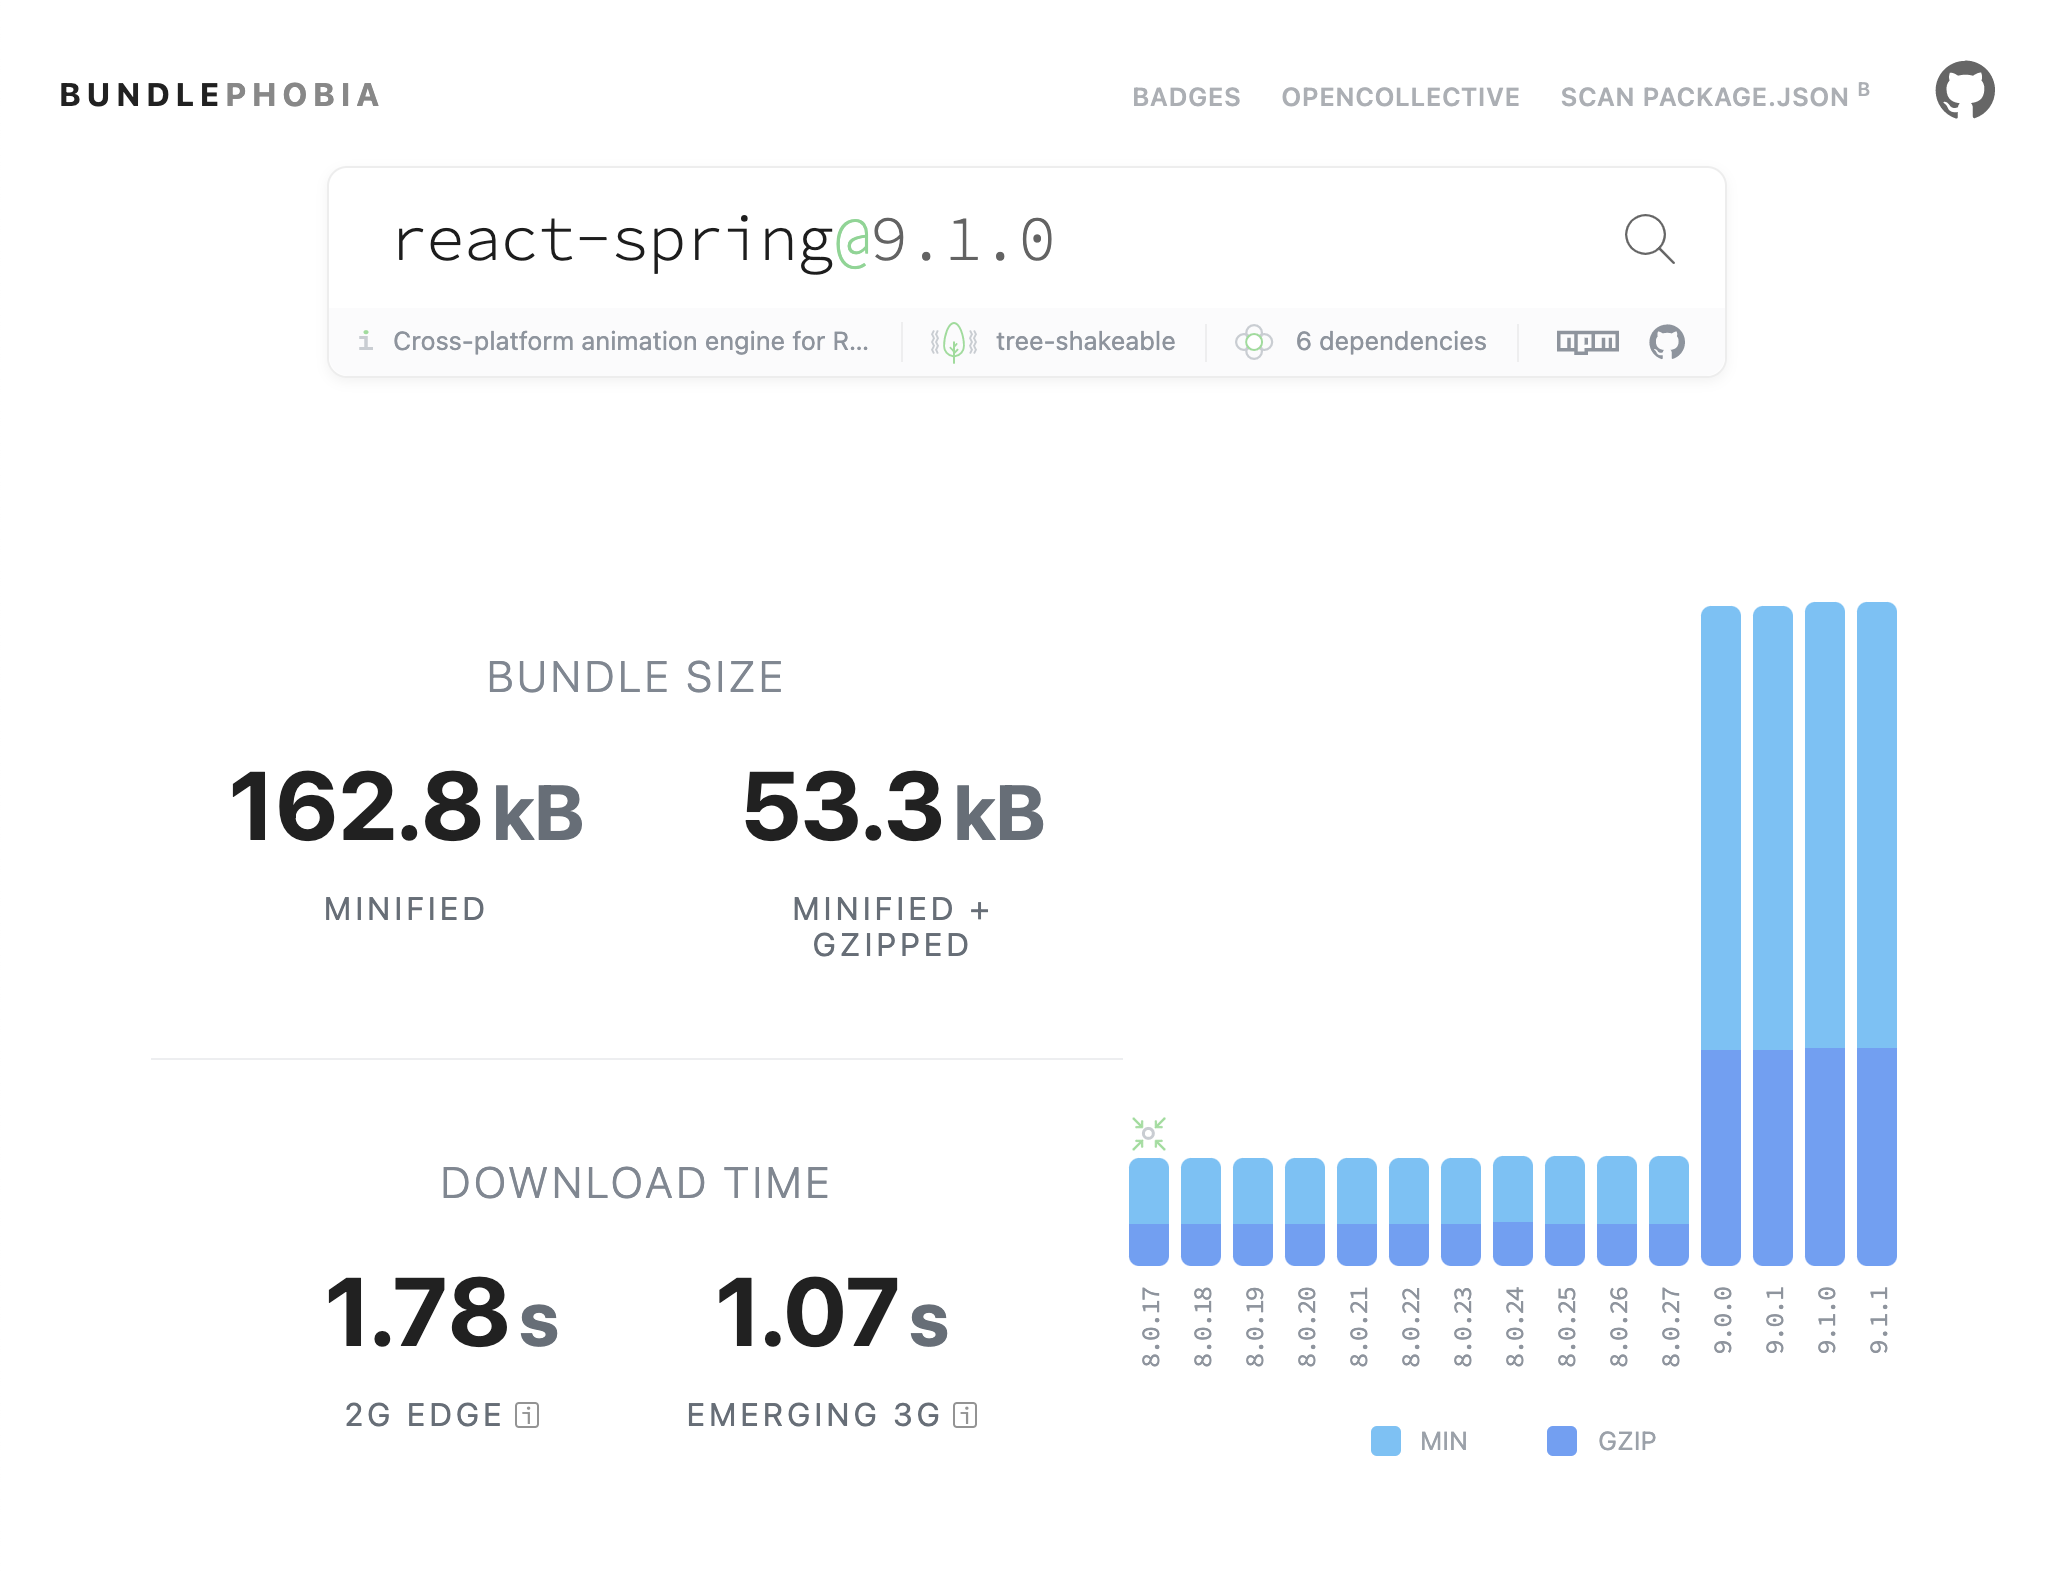
It’s easy—maybe too easy—to add almost anything you need to your product from npm. It doesn’t take long for bundle sizes to grow. Big bundles take longer to download on slow networks, and the 75th percentile mobile phone will spend a lot of time blocking the main UI thread while it tries to make sense of all the code it just downloaded. We liked BundlePhobia which is a free tool that shows how many dependencies and bytes an npm package will add to your bundle. This led us to eliminate or replace a number of react-spring powered animations with simpler CSS transitions:
Through the use of BundlePhobia and Lighthouse, we found that third-party error logging and analytics software contributed significantly to our bundle size and load time. We removed and replaced these tools with our own client-side logging that take advantage of modern browser APIs like sendBeacon and ping. We send logging and analytics to our own Google BigQuery infrastructure where we can answer the questions we care about in more detail than any of the off-the-shelf tools could provide. This also eliminates a number of third-party cookies and gives us far more control over how and when we send logging data from clients.
Our CLS score still had the most room for improvement. The way Google calculates CLS is complicated—you’re given a maximum “session window” with a 1-second gap, capped at 5 seconds from the initial page load, or from a keyboard or click interaction, to finish moving things around the site. If you’re interested in reading more deeply into this topic, here’s a great guide on the topic. This penalizes many types of overlays and popups that appear just after you land on a site. For instance, ads that shift content around or upsells that might appear when you start scrolling past ads to reach content. This article provides an excellent explanation of how the CLS score is calculated and the reasoning behind it.
We are fundamentally opposed to this kind of digital clutter so we were surprised to see how much room for improvement Google insisted we make. Chrome has a built-in Web Vitals overlay that you can access by using the Command Menu to “Show Core Web Vitals overlay”. To see exactly which elements Chrome considers in its CLS calculation, we found the Chrome Web Vitals extension’s “Console Logging” option in settings more helpful. Once enabled, this plugin shows your LCP, FID, and CLS scores for the current page. From the console, you can see exactly which elements on the page are connected to these scores. Our CLS scores had the most room for improvement.

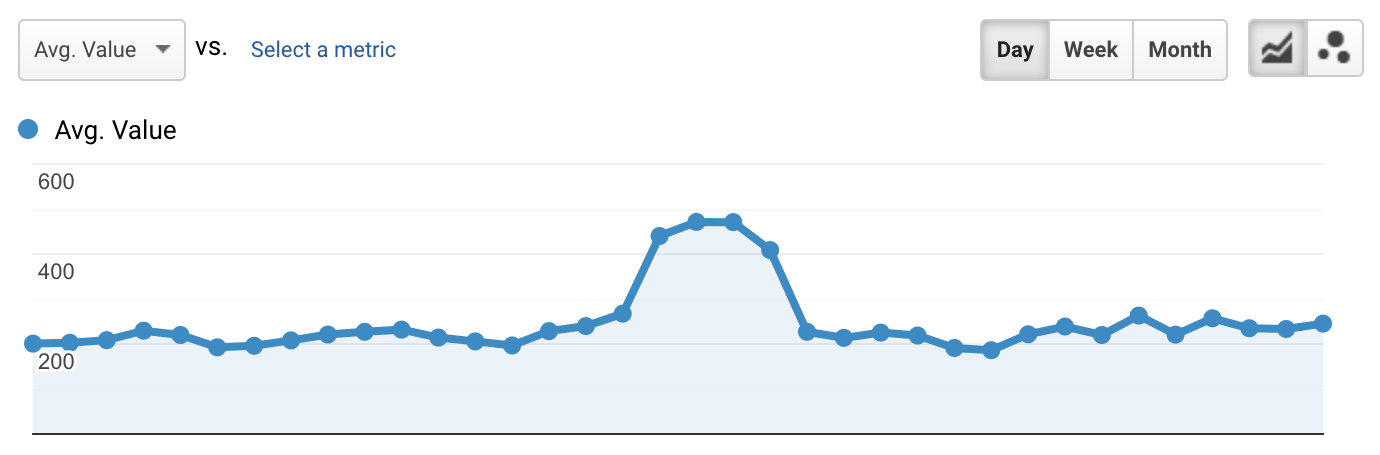
Of the three metrics, CLS is the only one that accumulates as you interact with a page. The Web Vitals extension has a logging option that will show exactly which elements cause CLS while you are interacting with a product. Watch how the CLS metrics add when we scroll on Smashing Magazine’s home page:
Google will continue to adjust how it calculates CLS over time, so it’s important to stay informed by following Google’s web development blog. When using tools like the Chrome Web Vitals extension, it’s important to enable CPU and network throttling to get a more realistic experience. You can do that with the developer tools by simulating a mobile CPU.

The best way to track progress from one deploy to the next is to measure page experiences the same way Google does. If you have Google Analytics set up, an easy way to do this is to install Google’s web-vitals module and hook it up to Google Analytics. This provides a rough measure of your progress and makes it visible in a Google Analytics dashboard.
This is where we hit a wall. We could see our CLS score, and while we’d improved it significantly, we still had work to do. Our CLS score was roughly 0.23 and we needed to get this below 0.1—and preferably down to 0. At this point, though, we couldn’t find something that told us exactly which components on which pages were still affecting the score. We could see that Chrome exposed a lot of detail in their Core Web Vitals tools, but that the logging aggregators threw away the most important part: exactly which page element caused the problem.

To capture all of the detail we need, we built a serverless function to capture web vitals data from browsers. Since we don’t need to run real-time queries on the data, we stream it into Google BigQuery’s streaming API for storage. This architecture means we can inexpensively capture about as many data points as we can generate.
After learning some lessons while working with Web Vitals and BigQuery, we decided to bundle up this functionality and release these tools as open-source at vitals.dev.
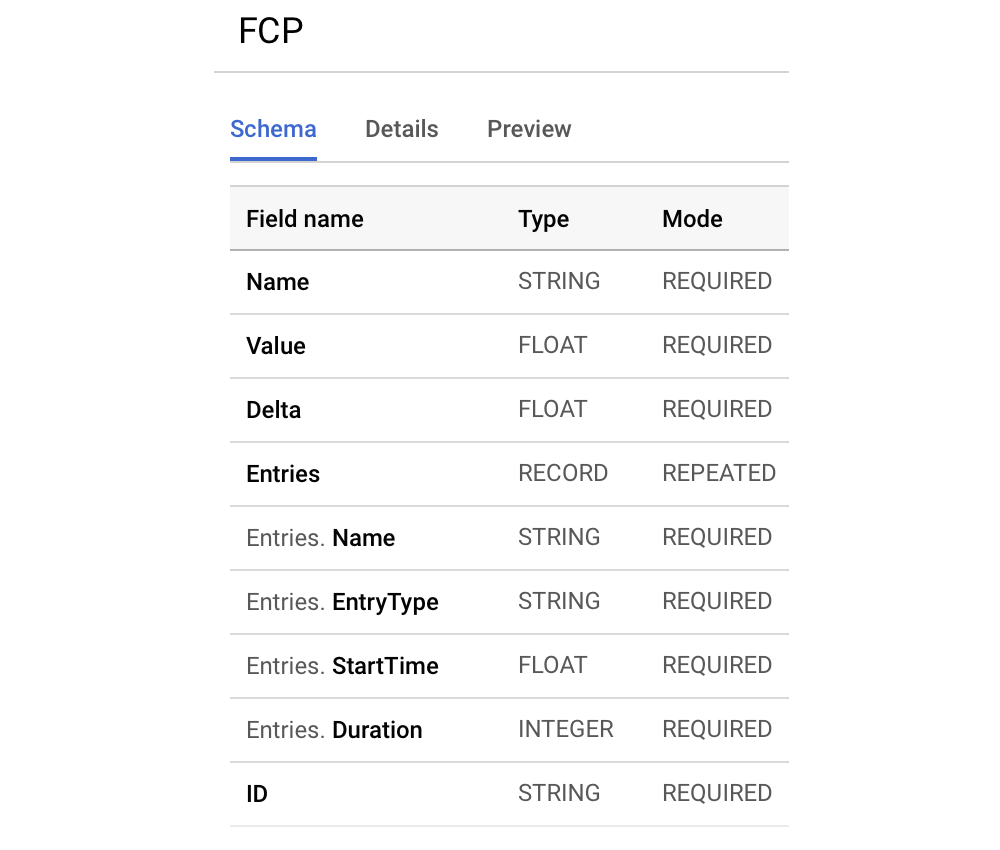
Using Instant Vitals is a quick way to get started tracking your Web Vitals scores in BigQuery. Here’s an example of a BigQuery table schema that we create:
Integrating with Instant Vitals is easy. You can get started by integrating with the client library to send data to your backend or serverless function:
import { init } from "@instantdomain/vitals-client";

init({ endpoint: "/api/web-vitals" });
Then, on your server, you can integrate with the server library to complete the circuit:
import fs from "fs";

import { init, streamVitals } from "@instantdomain/vitals-server";

// Google libraries require service key as path to file
const GOOGLE_SERVICE_KEY = process.env.GOOGLE_SERVICE_KEY;
process.env.GOOGLE_APPLICATION_CREDENTIALS = "/tmp/goog_creds";
fs.writeFileSync(
  process.env.GOOGLE_APPLICATION_CREDENTIALS,
  GOOGLE_SERVICE_KEY
);

const DATASET_ID = "web_vitals";
init({ datasetId: DATASET_ID }).then().catch(console.error);

// Request handler
export default async (req, res) => {
  const body = JSON.parse(req.body);
  await streamVitals(body, body.name);
  res.status(200).end();
};
Simply call streamVitalswith the body of the request and the name of the metric to send the metric to BigQuery. The library will handle creating the dataset and tables for you.
After collecting a day’s worth of data, we ran this query like this one:
SELECT
  `<project_name>.web_vitals.CLS`.Value,
  Node
FROM
  `<project_name>.web_vitals.CLS`
JOIN
  UNNEST(Entries) AS Entry
JOIN
  UNNEST(Entry.Sources)
WHERE
  Node != ""
ORDER BY
  value
LIMIT
  10
This query produces results like this:
| Value | Node |
|---|---|
4.6045324800736724E-4 | /html/body/div[1]/main/div/div/div[2]/div/div/blockquote |
7.183070668914928E-4 | /html/body/div[1]/header/div/div/header/div |
0.031002668277977697 | /html/body/div[1]/footer |
0.035830703317463526 | /html/body/div[1]/main/div/div/div[2] |
0.035830703317463526 | /html/body/div[1]/footer |
0.035830703317463526 | /html/body/div[1]/main/div/div/div[2] |
0.035830703317463526 | /html/body/div[1]/main/div/div/div[2] |
0.035830703317463526 | /html/body/div[1]/footer |
0.035830703317463526 | /html/body/div[1]/footer |
0.03988482067913317 | /html/body/div[1]/footer |
This shows us which elements on which pages have the most impact on CLS. It created a punch list for our team to investigate and fix. On Instant Domain Search, it turns out that slow or bad mobile connections will take more than 500ms to load some of our search results. One of the worst contributors to CLS for these users was actually our footer.
The layout shift score is calculated as a function of the size of the element moving, and how far it goes. In our search results view, if a device takes more than a certain amount of time to receive and render search results, the results view would collapse to a zero-height, bringing the footer into view. When the results come in, they push the footer back to the bottom of the page. A big DOM element moving this far added a lot to our CLS score. To work through this properly, we need to restructure the way the search results are collected and rendered. We decided to just remove the footer in the search results view as a quick hack that’d stop it from bouncing around on slow connections.
We now review this report regularly to track how we are improving — and use it to fight declining results as we move forward. We have witnessed the value of extra attention to newly launched features and products on our site and have operationalized consistent checks to be sure core vitals are acting in favor of our ranking. We hope that by sharing Instant Vitals we can help other developers tackle their Core Web Vitals scores too.
Google provides excellent performance tools built into Chrome, and we used them to find and fix a number of performance issues. We learned that the field data provided by Google offered a good summary of our p75 progress, but did not have actionable detail. We needed to find out exactly which DOM elements were causing layout shifts and input delays. Once we started collecting our own field data—with XPath queries—we were able to identify specific opportunities to improve everyone’s experience on our site. With some effort, we brought our real-world Core Web Vitals field scores down into an acceptable range in preparation for June’s Page Experience Update. We’re happy to see these numbers go down and to the right!
Further Reading
- How To Monitor And Optimize Google Core Web Vitals
- Performance Game Changer: Browser Back/Forward Cache
- Five-Second Testing: Taking A Closer Look At First Impressions (Case Study)
- The Era Of Platform Primitives Is Finally Here


