Creating An Interactive Gantt Chart Component With Vanilla JavaScript (Part 1)

Email Newsletter
Weekly tips on front-end & UX.
Trusted by 182,000+ folks.

 Celebrating 10 million developers


 Custom Web Forms for Angular, React, & Vue. Your backend.
If you work with time data in your app, a graphical visualization as a calendar or Gantt chart is often very useful. At first glance, developing your own chart component seems quite complicated. Therefore, in this article, I will develop the foundation for a Gantt chart component whose appearance and functionality you can customize for any use case.
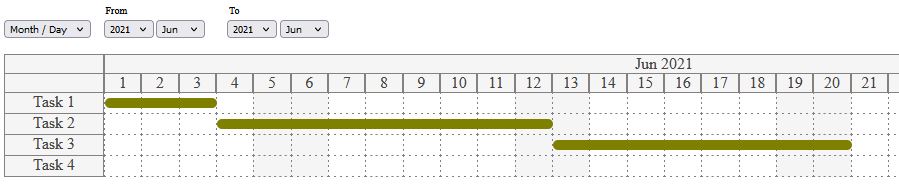
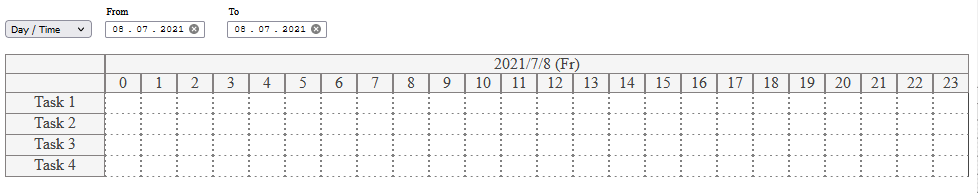
These are the basic features of the Gantt chart that I would like to implement:
- The user can choose between two views: year/month or month/day.
- The user can define the planning horizon by selecting a start date and an end date.
- The chart renders a given list of jobs that can be moved by drag and drop. The changes are reflected in the state of the objects. *
Below you can see the resulting Gantt chart in both views. In the monthly version, I have included three jobs as an example.
Below you can see the resulting Gantt chart in both views. In the monthly version, I have included three jobs as an example.
Sample Files And Instructions For Running The Code
You can find the full code snippets of this article in the following files:
Since the code contains JavaScript modules, you can only run the example from an HTTP server and not from the local file system. For testing on your local PC, I’d recommend the module live-server, which you can install via npm.
Basic Structure Of The Web Component
I decided to implement the Gantt chart as a web component. This allows us to create a custom HTML element, in my case <gantt-chart></gantt-chart>, which we can easily reuse anywhere on any HTML page.
You can find some basic information about developing web components in the MDN Web Docs. The following listing shows the structure of the component. It is inspired by the “counter” example from Alligator.io.
The component defines a template containing the HTML code needed to display the Gantt chart. For the complete CSS specifications, please refer to the sample files. The specific selection fields for year, month or date cannot be defined here yet, as they depend on the selected level of the view.
The selection elements are projected in by one of the two renderer classes instead. The same applies to the rendering of the actual Gantt chart into the element with the ID gantt-container, which is also handled by the responsible renderer class.
The class VanillaGanttChart now describes the behavior of our new HTML element. In the constructor, we first define our rough template as the shadow DOM of the element.
The component must be initialized with two arrays, jobs, and resources. The jobs array contains the tasks that are displayed in the chart as movable green bars. The resources array defines the individual rows in the chart where tasks can be assigned. In the screenshots above, for example, we have 4 resources labeled Task 1 to Task 4. The resources can therefore represent the individual tasks, but also people, vehicles, and other physical resources, allowing for a variety of use cases.
Currently, the YearMonthRenderer is used as the default renderer. As soon as the user selects a different level, the renderer is changed in the changeLevel method: First, the renderer-specific DOM elements and listeners are deleted from the Shadow DOM using the clear method of the old renderer. Then the new renderer is initialized with the existing jobs and resources and the rendering is started.
import {YearMonthRenderer} from './YearMonthRenderer.js';
import {DateTimeRenderer} from './DateTimeRenderer.js';
const template = document.createElement('template');
template.innerHTML =
`<style> … </style>
<div id="gantt-settings">
<select name="select-level" id="select-level">
<option value="year-month">Month / Day</option>
<option value="day">Day / Time</option>
</select>
<fieldset id="select-from">
<legend>From</legend>
</fieldset>
<fieldset id="select-to">
<legend>To</legend>
</fieldset>
</div>
<div id="gantt-container">
</div>`;
export default class VanillaGanttChart extends HTMLElement {
constructor() {
super();
this.attachShadow({ mode: 'open' });
this.shadowRoot.appendChild(template.content.cloneNode(true));
this.levelSelect = this.shadowRoot.querySelector('#select-level');
}
_resources = [];
_jobs = [];
_renderer;
set resources(list){…}
get resources(){…}
set jobs(list){…}
get jobs(){…}
get level() {…}
set level(newValue) {…}
get renderer(){…}
set renderer(r){…}
connectedCallback() {
this.changeLevel = this.changeLevel.bind(this);
this.levelSelect.addEventListener('change', this.changeLevel);
this.level = "year-month";
this.renderer = new YearMonthRenderer(this.shadowRoot);
this.renderer.dateFrom = new Date(2021,5,1);
this.renderer.dateTo = new Date(2021,5,24);
this.renderer.render();
}
disconnectedCallback() {
if(this.levelSelect)
this.levelSelect.removeEventListener('change', this.changeLevel);
if(this.renderer)
this.renderer.clear();
}
changeLevel(){
if(this.renderer)
this.renderer.clear();
var r;
if(this.level == "year-month"){
r = new YearMonthRenderer(this.shadowRoot);
}else{
r = new DateTimeRenderer(this.shadowRoot);
}
r.dateFrom = new Date(2021,5,1);
r.dateTo = new Date(2021,5,24);
r.resources = this.resources;
r.jobs = this.jobs;
r.render();
this.renderer = r;
}
}
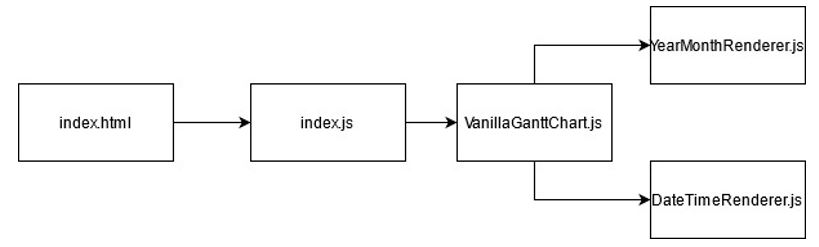
window.customElements.define('gantt-chart', VanillaGanttChart);Before we get deeper into the rendering process, I would like to give you an overview of the connections between the different scripts:
- index.html is your web page where you can use the tag
<gantt-chart></gantt-chart> - index.js is a script in which you initialize the instance of the web component that is associated with the Gantt chart used in index.html with the appropriate jobs and resources (of course you can also use multiple Gantt charts and thus multiple instances of the web component)
- The component
VanillaGanttChartdelegates rendering to the two renderer classesYearMonthRendererandDateTimeRenderer.
Rendering Of The Gantt Chart With JavaScript And CSS Grid
In the following, we discuss the rendering process using the YearMonthRenderer as an example. Please note that I have used a so-called constructor function instead of the class keyword to define the class. This allows me to distinguish between public properties (this.render and this.clear) and private variables (defined with var).
The rendering of the chart is broken down into several sub-steps:
initSettings
Rendering of the controls which are used to define the planning horizon.initGantt
Rendering of the Gantt chart, basically in four steps:
initFirstRow(draws 1 row with month names)initSecondRow(draws 1 row with days of the month)initGanttRows(draws 1 row for each resource with grid cells for each day of the month)initJobs(positions the draggable jobs in the chart)
export function YearMonthRenderer(root){

    var shadowRoot = root;
    var names = ["Jan", "Feb", "Mar", "Apr", "May", "Jun", "Jul", "Aug", "Sep", "Oct", "Nov", "Dec"];

    this.resources=[];
    this.jobs = [];

    this.dateFrom = new Date();
    this.dateTo = new Date();

    //select elements
    var monthSelectFrom;
    var yearSelectFrom;
    var monthSelectTo;
    var yearSelectTo;

    var getYearFrom = function() {…}
    var setYearFrom = function(newValue) {…}

    var getYearTo = function() {…}
    var setYearTo = function(newValue) {…}

    var getMonthFrom = function() {…}
    var setMonthFrom = function(newValue) {…}

    var getMonthTo = function() {…}
    var setMonthTo = function(newValue) {…}

    this.render = function(){
      this.clear();
      initSettings();
      initGantt();
    }

    //remove select elements and listeners, clear gantt-container
    this.clear = function(){…}

    //add HTML code for the settings area (select elements) to the shadow root, initialize associated DOM elements and assign them to the properties monthSelectFrom, monthSelectTo etc., initialize listeners for the select elements
    var initSettings = function(){…}

    //add HTML code for the gantt chart area to the shadow root, position draggable jobs in the chart
    var initGantt = function(){…}

    //used by initGantt: draw time axis of the chart, month names
    var initFirstRow = function(){…}

    //used by initGantt: draw time axis of the chart, days of month
    var initSecondRow = function(){…}

    //used by initGantt: draw the remaining grid of the chart
    var initGanttRows = function(){…}.bind(this);

    //used by initGantt: position draggable jobs in the chart cells
    var initJobs = function(){…}.bind(this);

   //drop event listener for jobs
   var onJobDrop = function(ev){…}.bind(this);

   //helper functions, see example files
   ...
}
Rendering The Grid
I recommend CSS Grid for drawing the diagram area because it makes it very easy to create multi-column layouts that adapt dynamically to the screen size.
In the first step, we have to determine the number of columns of the grid. In doing so, we refer to the first row of the chart which (in the case of the YearMonthRenderer) represents the individual months.
Consequently, we need:
- one column for the names of the resources, e.g. with a fixed width of 100px.
- one column for each month, of the same size and using the full space available.
This can be achieved with the setting 100px repeat(${n_months}, 1fr) for the property gridTemplateColumns of the chart container.
This is the initial part of the initGantt method:
var container = shadowRoot.querySelector("#gantt-container");
container.innerHTML = "";

var first_month = new Date(getYearFrom(), getMonthFrom(), 1);
var last_month = new Date(getYearTo(), getMonthTo(), 1);

//monthDiff is defined as a helper function at the end of the file
var n_months =  monthDiff(first_month, last_month)+1;

container.style.gridTemplateColumns = `100px repeat(${n_months},1fr)`;
In the following picture you can see a chart for two months with n_months=2:
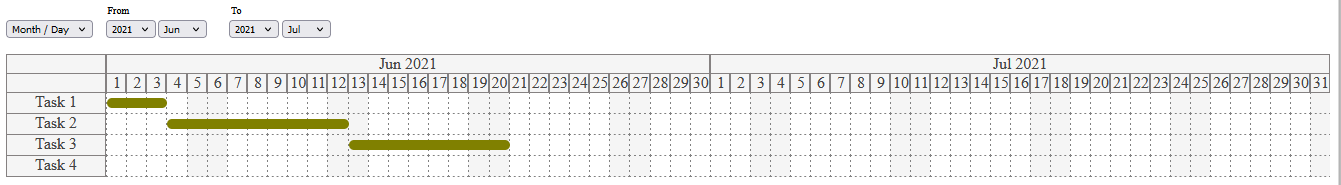
n_months=2. (Large preview)After we have defined the outer columns, we can start filling the grid. Let’s stay with the example from the picture above. In the first row, I insert 3 divs with the classes gantt-row-resource and gantt-row-period. You can find them in the following snippet from the DOM inspector.
In the second row, I use the same three divs to keep the vertical alignment. However, the month divs get child elements for the individual days of the month.
<div id="gantt-container"
  style="grid-template-columns: 100px repeat(2, 1fr);">
  <div class="gantt-row-resource"></div>
  <div class="gantt-row-period">Jun 2021</div>
  <div class="gantt-row-period">Jul 2021</div>
  <div class="gantt-row-resource"></div>
  <div class="gantt-row-period">
    <div class="gantt-row-period">1</div>
    <div class="gantt-row-period">2</div>
    <div class="gantt-row-period">3</div>
    <div class="gantt-row-period">4</div>
    <div class="gantt-row-period">5</div>
    <div class="gantt-row-period">6</div>
    <div class="gantt-row-period">7</div>
    <div class="gantt-row-period">8</div>
    <div class="gantt-row-period">9</div>
    <div class="gantt-row-period">10</div>
  ...
  </div>
  ...
</div>
For the child elements to be arranged horizontally as well, we need the setting display: grid for the class gantt-row-period. In addition, we do not know exactly how many columns are required for the individual months (28, 30, or 31). Therefore, I use the setting grid-auto-columns. With the value minmax(20px, 1fr); I can ensure that a minimum width of 20px is maintained and that otherwise the available space is fully utilized:
#gantt-container {
  display: grid;
}

.gantt-row-resource {
  background-color: whitesmoke;
  color: rgba(0, 0, 0, 0.726);
  border: 1px solid rgb(133, 129, 129);
  text-align: center;
}

.gantt-row-period {
  display: grid;
  grid-auto-flow: column;
  grid-auto-columns: minmax(20px, 1fr);
  background-color: whitesmoke;
  color: rgba(0, 0, 0, 0.726);
  border: 1px solid rgb(133, 129, 129);
  text-align: center;
}
The remaining rows are generated according to the second row, however as empty cells.
Here is the JavaScript code for generating the individual grid cells of the first row. The methods initSecondRow and initGanttRows have a similar structure.
var initFirstRow = function(){

  if(checkElements()){
        var container = shadowRoot.querySelector("#gantt-container");

        var first_month = new Date(getYearFrom(), getMonthFrom(), 1);
        var last_month = new Date(getYearTo(), getMonthTo(), 1);

        var resource = document.createElement("div");
        resource.className = "gantt-row-resource";
        container.appendChild(resource);

        var month = new Date(first_month);

        for(month; month <= last_month; month.setMonth(month.getMonth()+1)){
          var period = document.createElement("div");
          period.className = "gantt-row-period";
          period.innerHTML = names[month.getMonth()] + " " + month.getFullYear();
          container.appendChild(period);
        }
  }
}
Rendering The Jobs
Now each job has to be drawn into the diagram at the correct position. For this I make use of the HTML data attributes: every grid cell in the main chart area is associated with the two attributes data-resource and data-date indicating the position on the horizontal and vertical axis of the chart (see function initGanttRows in the files YearMonthRenderer.js and DateTimeRenderer.js).
As an example, let’s look at the first four grid cells in the first row of the chart (we are still using the same example as in the pictures above):
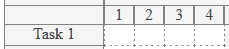
In the DOM inspector you can see the values of the data attributes that I have assigned to the individual cells:
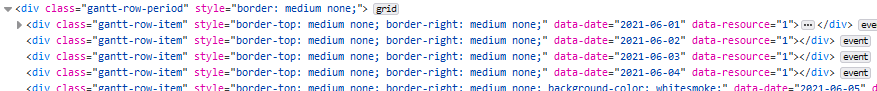
Let’s now see what this means for the function initJobs. With the help of the function querySelector, it is now quite easy to find the grid cell into which a job should be placed.
The next challenge is to determine the correct width for a job element. Depending on the selected view, each grid cell represents a unit of one day (level month/day) or one hour (level day/time). Since each job is the child element of a cell, the job duration of 1 unit (day or hour) corresponds to a width of 1*100%, the duration of 2 units corresponds to a width of 2*100%, and so on. This makes it possible to use the CSS calc function to dynamically set the width of a job element, as shown in the following listing.
var initJobs = function(){

    this.jobs.forEach(job => {

        var date_string = formatDate(job.start);

        var ganttElement = shadowRoot.querySelector(`div[data-resource="${job.resource}"][data-date="${date_string}"]`);

        if(ganttElement){

          var jobElement = document.createElement("div");
          jobElement.className="job";
          jobElement.id = job.id;

          //helper function dayDiff - get difference between start and end in days
          var d = dayDiff(job.start, job.end);

          //d --> number of grid cells covered by job + sum of borderWidths
          jobElement.style.width = "calc("+(d*100)+"% + "+ d+"px)";
          jobElement.draggable = "true";

          jobElement.ondragstart = function(ev){
              //the id is used to identify the job when it is dropped
              ev.dataTransfer.setData("job", ev.target.id);
          };

          ganttElement.appendChild(jobElement);
        }
    });
  }.bind(this);
In order to make a job draggable, there are three steps required:
- Set the property
draggableof the job element totrue(see listing above). - Define an event handler for the event
ondragstartof the job element (see listing above). - Define an event handler for the event
ondropfor the grid cells of the Gantt chart, which are the possible drop targets of the job element (see functioninitGanttRowsin the fileYearMonthRenderer.js).
The event handler for the event ondrop is defined as follows:
var onJobDrop = function(ev){

      // basic null checks
      if (checkElements()) {

        ev.preventDefault();

        // drop target = grid cell, where the job is about to be dropped
        var gantt_item = ev.target;

        // prevent that a job is appended to another job and not to a grid cell
        if (ev.target.classList.contains("job")) {
          gantt_item = ev.target.parentNode;
        }

        // identify the dragged job
        var data = ev.dataTransfer.getData("job");
        var jobElement = shadowRoot.getElementById(data);

        // drop the job
        gantt_item.appendChild(jobElement);

        // update the properties of the job object
        var job = this.jobs.find(j => j.id == data );

        var start = new Date(gantt_item.getAttribute("data-date"));
        var end = new Date(start);
        end.setDate(start.getDate()+dayDiff(job.start, job.end));

        job.start = start;
        job.end = end;
        job.resource = gantt_item.getAttribute("data-resource");
      }
    }.bind(this);
All changes to the job data made by drag and drop are thus reflected in the list jobs of the Gantt chart component.
Integrating The Gantt Chart Component In Your Application
You can use the tag <gantt-chart></gantt-chart> anywhere in the HTML files of your application (in my case in the file index.html) under the following conditions:
- The script
VanillaGanttChart.jsmust be integrated as a module so that the tag is interpreted correctly. - You need a separate script in which the Gantt chart is initialized with
jobsandresources(in my case the fileindex.js).
<!DOCTYPE html>
<html>
 <head>
   <meta charset="UTF-8"/>
   <title>Gantt chart - Vanilla JS</title>
   <script type="module" src="VanillaGanttChart.js"></script>
 </head>

 <body>

  <gantt-chart id="g1"></gantt-chart>

  <script type="module" src="index.js"></script>
 </body>
</html>
For example, in my case the file index.js looks as follows:
import VanillaGanttChart from "./VanillaGanttChart.js";

var chart = document.querySelector("#g1");

chart.jobs = [
    {id: "j1", start: new Date("2021/6/1"), end: new Date("2021/6/4"), resource: 1},
    {id: "j2", start: new Date("2021/6/4"), end: new Date("2021/6/13"), resource: 2},
    {id: "j3", start: new Date("2021/6/13"), end: new Date("2021/6/21"), resource: 3},
];

chart.resources = [{id:1, name: "Task 1"}, {id:2, name: "Task 2"}, {id:3, name: "Task 3"}, {id:4, name: "Task 4"}];
However, there is still one requirement open: when the user makes changes by dragging jobs in the Gantt chart, the respective changes in the property values of the jobs should be reflected in the list outside the component.
We can achieve this with the use of JavaScript Proxy Objects: Each job is nested in a proxy object, which we provide with a so-called validator. It becomes active as soon as a property of the object is changed (function set of the validator) or retrieved (function get of the validator). In the set function of the validator, we can store code that is executed whenever the start time or the resource of a task is changed.
The following listing shows a different version of the file index.js. Now a list of proxy objects is assigned to the Gantt chart component instead of the original jobs. In the validator set I use a simple console output to show that I have been notified of a property change.
import VanillaGanttChart from "./VanillaGanttChart.js";

var chart = document.querySelector("#g1");

var jobs = [
    {id: "j1", start: new Date("2021/6/1"), end: new Date("2021/6/4"), resource: 1},
    {id: "j2", start: new Date("2021/6/4"), end: new Date("2021/6/13"), resource: 2},
    {id: "j3", start: new Date("2021/6/13"), end: new Date("2021/6/21"), resource: 3},
];
var p_jobs = [];

chart.resources = [{id:1, name: "Task 1"}, {id:2, name: "Task 2"}, {id:3, name: "Task 3"}, {id:4, name: "Task 4"}];

jobs.forEach(job => {

    var validator = {
        set: function(obj, prop, value) {

          console.log("Job " + obj.id + ": " + prop + " was changed to " + value);
          console.log();

          obj[prop] = value;
          return true;
        },

        get: function(obj, prop){

            return obj[prop];
        }
    };

    var p_job = new Proxy(job, validator);
    p_jobs.push(p_job);
});

chart.jobs = p_jobs;
Outlook
The Gantt chart is an example that shows how you can use the technologies of Web Components, CSS Grid, and JavaScript Proxy to develop a custom HTML element with a somewhat more complex graphical interface. You are welcome to develop the project further and/or use it in your own projects together with other JavaScript frameworks.
Again, you can find all sample files and instructions at the top of the article.
Further Reading
- Regexes Got Good: The History And Future Of Regular Expressions In JavaScript
- How To Build A Multilingual Website With Nuxt.js
- What Are CSS Container Style Queries Good For?
- An Introduction To CSS Scroll-Driven Animations: Scroll And View Progress Timelines


