Getting Your head Straight: A New CSS Performance Diagnostics Snippet

Email Newsletter
Weekly tips on front-end & UX.
Trusted by 182,000+ folks.
There are plenty of ways to detect performance bottlenecks and audit CSS. We can look into common performance bottlenecks and the complexity of stylesheets, the way we load assets, and the order in which it happens.
One helpful way to spot common problems easily is to use some sort of a performance diagnostics CSS — a dedicated stylesheet that highlights potential problems and errors.
Today, during his talk at Webexpo Prague 2021, Harry Roberts, a web performance consultant and front-end engineer, introduced a little helper that helps him spot common performance bottlenecks easily. And that is mostly related to the order of how assets are loaded in the <head>.
As Harry says,
“I spend a lot of my time looking through clients’ `` tags to ensure everything in there is in the best possible shape it can be. There are a lot of complex and often conflicting rules that constitute ‘good’ `` tags, and cross-referencing everything can soon grow unwieldy, so to make my life easier, I developed ct.css — a quick and dirty way of seeing inside of your ``.”
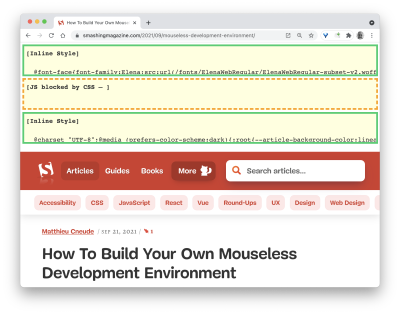
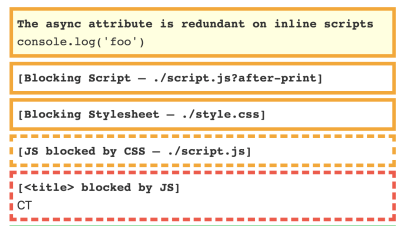
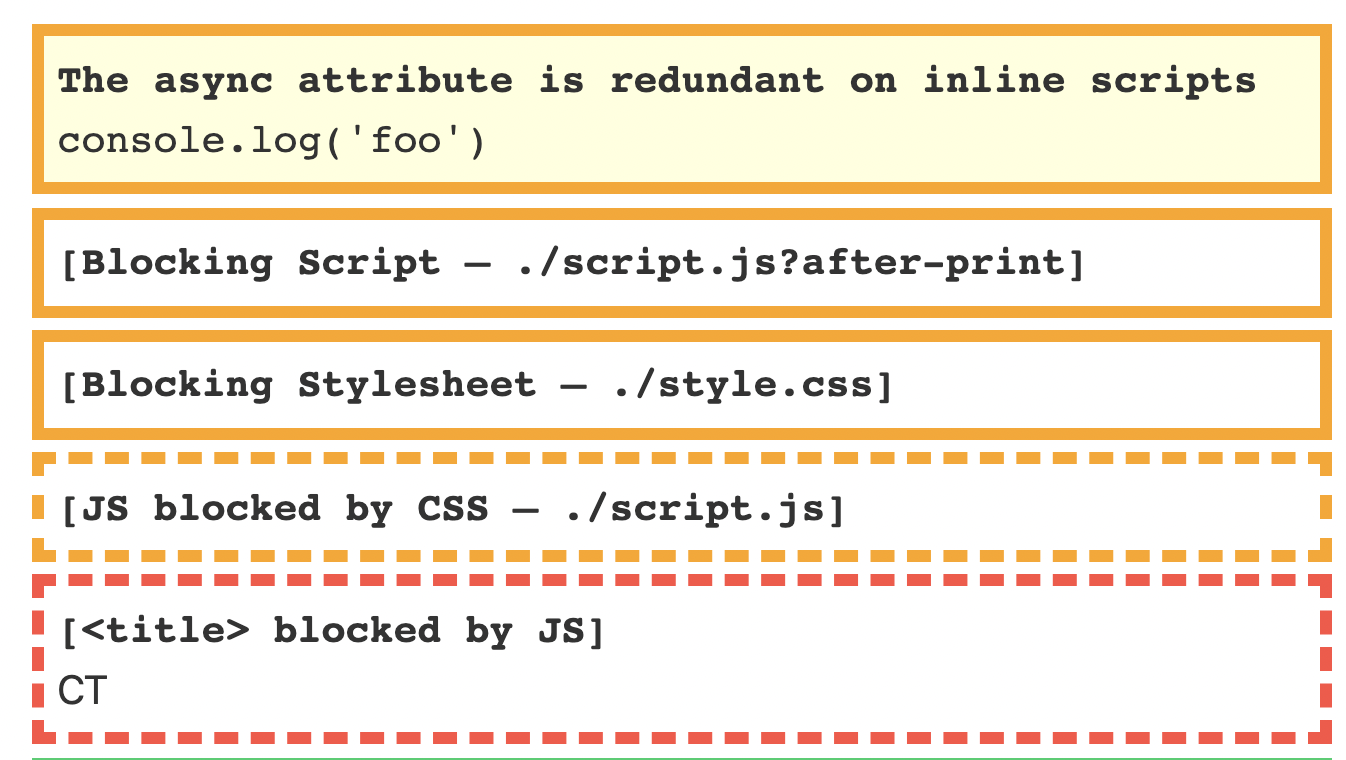
ct.css is a little diagnostic snippet, named after Computed Tomography (CT) scans, that exposes potential performance issues in your page’s <head> tags, and will disappear as soon as you’ve fixed them.
Harry has put all the insights he’s learned from his performance work to a perfect <head> order, and the tool exposes some of the issues that often result from a suboptimal arrangement of <head> tags.
With the bookmarklet in the browser’s toolbar, browse to a website of your choice, click or activate the bookmarklet, and the tool highlights useful pointers for you to double-check when working around performance bottlenecks. Just a little helper to make your work a bit easier, and find all those hidden issues faster.
If you just want to play with the snippet, you can get it at csswizardry.com/ct. Happy debugging, everyone!
Further Reading
- An Introduction To CSS Scroll-Driven Animations: Scroll And View Progress Timelines
- The Timeless Power Of Spreadsheets
- Three Approaches To Amplify Your Design Projects
- How To Monitor And Optimize Google Core Web Vitals