What’s New With DevTools: Cross-Browser Edition

Email Newsletter
Weekly tips on front-end & UX.
Trusted by 200,000+ folks.


Browser developer tools keep evolving, with new and improved features added all the time. It’s hard to keep track, especially when using more than one browser. With that much on offer, it is not surprising that we feel overwhelmed and use the features we already know instead of keeping up with what’s new.
It’s a shame though, as some of them can make us much more productive.
So, my goal with this article is to raise awareness on some of the newest features in Chrome, Microsoft Edge, Firefox and Safari. Hopefully, it will make you want to try them out, and maybe will help you get more comfortable next time you need to debug a browser-specific issue.
With that said, let’s jump right in.
Chrome DevTools
The Chrome DevTools team has been hard at work modernizing their (now 13 years old) codebase. They have been busy improving the build system, migrating to TypeScript, introducing new WebComponents, re-building their theme infrastructure, and way more. As a result, the tools are now easier to extend and change.
But on top of this less user-facing work, the team did ship a lot of features too. Let me go over a few of them here, related to CSS debugging.
Scroll-Snapping
CSS scroll-snapping offers web developers a way to control the position at which a scrollable container stops scrolling. It’s a useful feature for, e.g., long lists of photos where you want the browser to position each photo neatly within its scrollable container automatically for you.
If you want to learn more about scroll-snapping, you can read this MDN documentation, and take a look at Adam Argyle’s demos here.
The key properties of scroll-snapping are:
scroll-snap-type, which tells the browser the direction in which snapping happens, and how it happens;scroll-snap-align, which tells the browser where to snap.
Chrome DevTools introduced new features that help debug these key properties:
- if an element defines scroll-snapping by using
scroll-snap-type, the Elements panel shows a badge next to it.
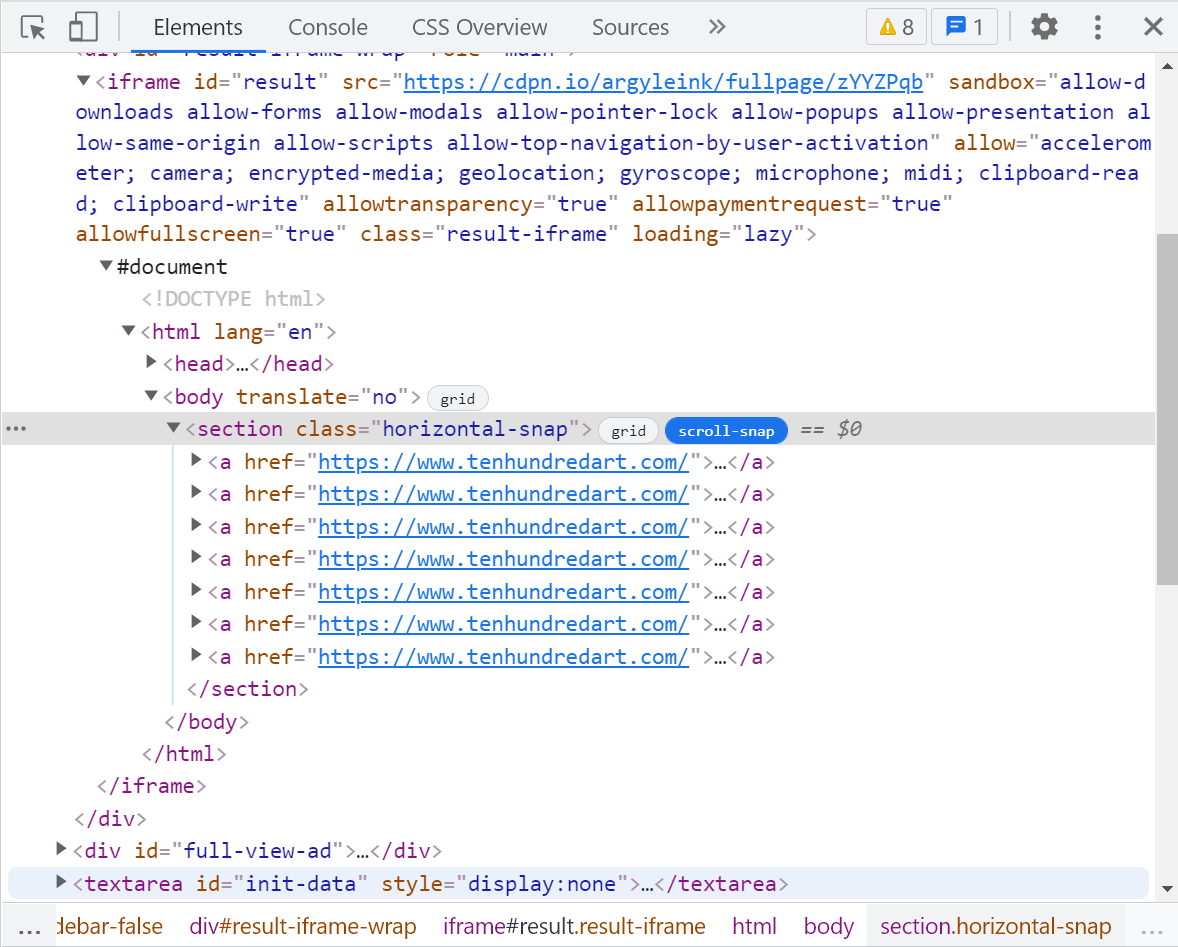
- You can click on the scroll-snap badge to enable a new overlay. When you do, several things are highlighted on the page:
- the scroll container,
- the items that scroll within the container,
- the position where items are aligned (marked by a blue dot).
This overlay makes it easy to understand if and how things snap into place after scrolling around. This can be very useful when, e.g., your items don’t have a background and boundaries between them are hard to see.

While scroll snapping isn’t a new CSS feature, adoption is rather low (less than 4% according to chromestatus.com), and since the specification changed, not every browser supports it the same way.
I hope that this DevTools feature will make people want to play more with it and ultimately adopt it for their sites.
Container Queries
If you have done any kind of web development in recent years, you have probably heard of container queries. It’s been one of the most requested CSS features for the longest time and has been a very complex problem for browser makers and spec writers to solve.
If you don’t know what container queries are, I would suggest going through Stephanie Eckles’ Primer On CSS Container Queries article first.
In a few words, they’re a way for developers to define the layout and style of elements depending on their container’s size. This ability is a huge advantage when creating reusable components since we can make them adapt to the place they are used in (rather than only adapt to the viewport size which media queries are good for).
Fortunately, things are moving in this space and Chromium now supports container queries and the Chrome DevTools team has started adding tooling that makes it easier to get started with them.
Container queries are not enabled by default in Chromium yet (to enable them, go to [chrome://flags]() and search for “container queries”), and it may still take a little while for them to be. Furthermore, the DevTools work to debug them is still in its early days. But some early features have already landed.
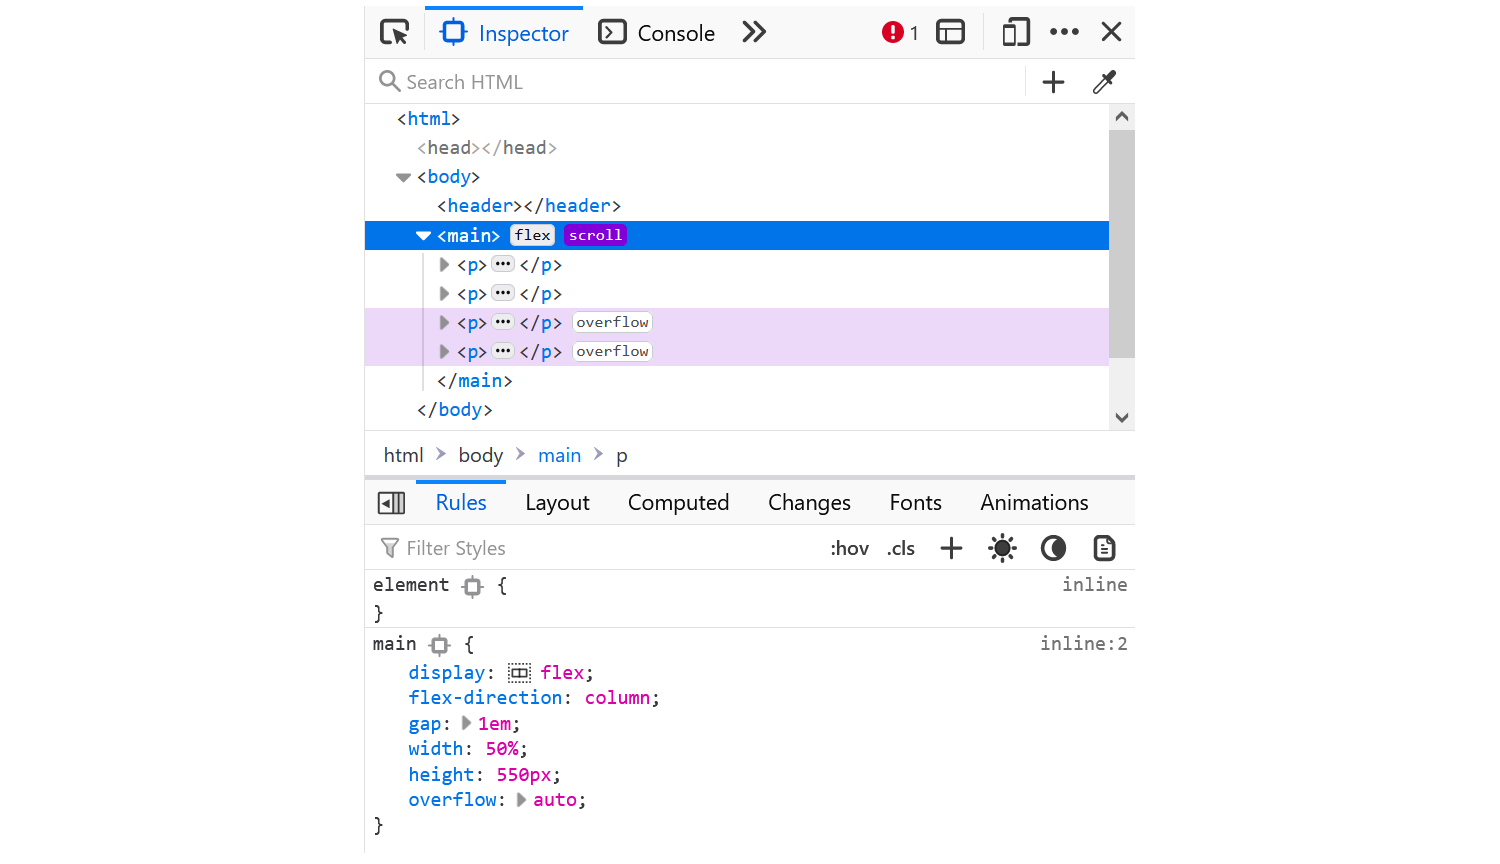
- When selecting an element in DevTools that has styles coming from a
@containerat-rule, then this rule appears in the Styles sidebar of the Elements panel. This is similar to how media queries styles are presented in DevTools and will make it straightforward to know where a certain style is coming from.

As the above screenshot shows, the Styles sidebar displays 2 rules that apply to the current element. The bottom one applies to the .media element at all times and provides its default style. And the top one is nested in a @container (max-width:300px) container query that only takes effect when the container is narrower than 300px.
- On top of this, just above the
@containerat-rule, the Styles pane displays a link to the element that the rule resolves to, and hovering over it displays extra information about its size. This way you know exactly why the container query matched.
The Chrome DevTools team is actively working on this feature and you can expect much more in the future.
Chromium Collaboration
Before going into features that other browsers have, let’s talk about Chromium for a little bit. Chromium is an open-source project that Chrome, Edge, Brave, and other browsers are built upon. It means all these browsers have access to the features of Chromium.
Two of the most active contributors to this project are Google and Microsoft and, when it comes to DevTools, they collaborated on a few interesting features that I’d like to go over now.
CSS Layout Debugging Tools
A few years ago, Firefox innovated in this space and shipped the first-ever grid and flexbox inspectors. Chromium-based browsers now also make it possible for web developers to debug grid and flexbox easily.
This collaborative project involved engineers, product managers and designers from Microsoft and Google, working towards a shared goal (learn more about the project itself in my BlinkOn talk).
Among other things, DevTools now has the following layout debugging features:
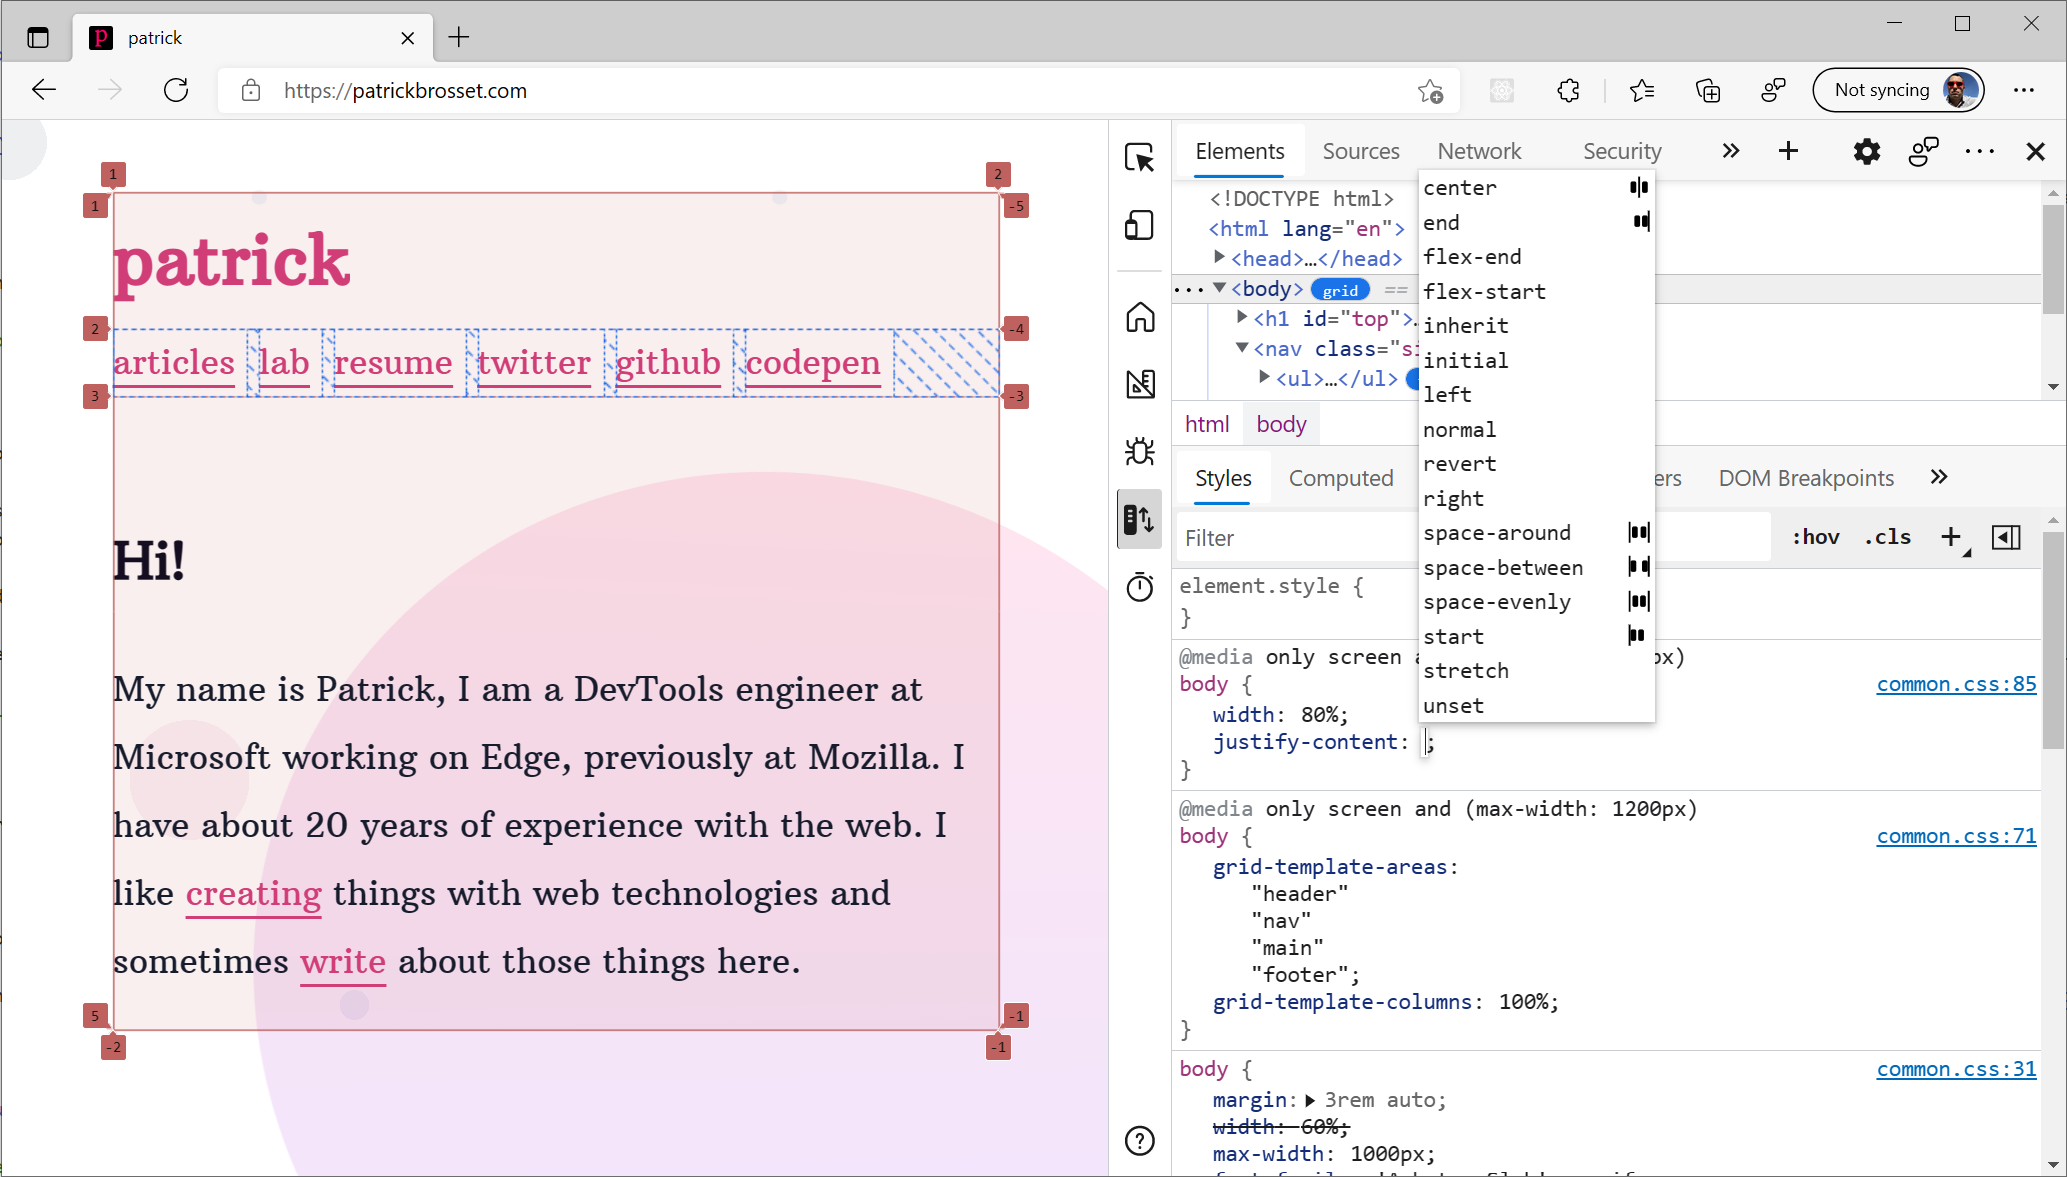
- Highlight multiple grid and flex layouts on the page, and customize if you want to see grid line names or numbers, grid areas, and so on.
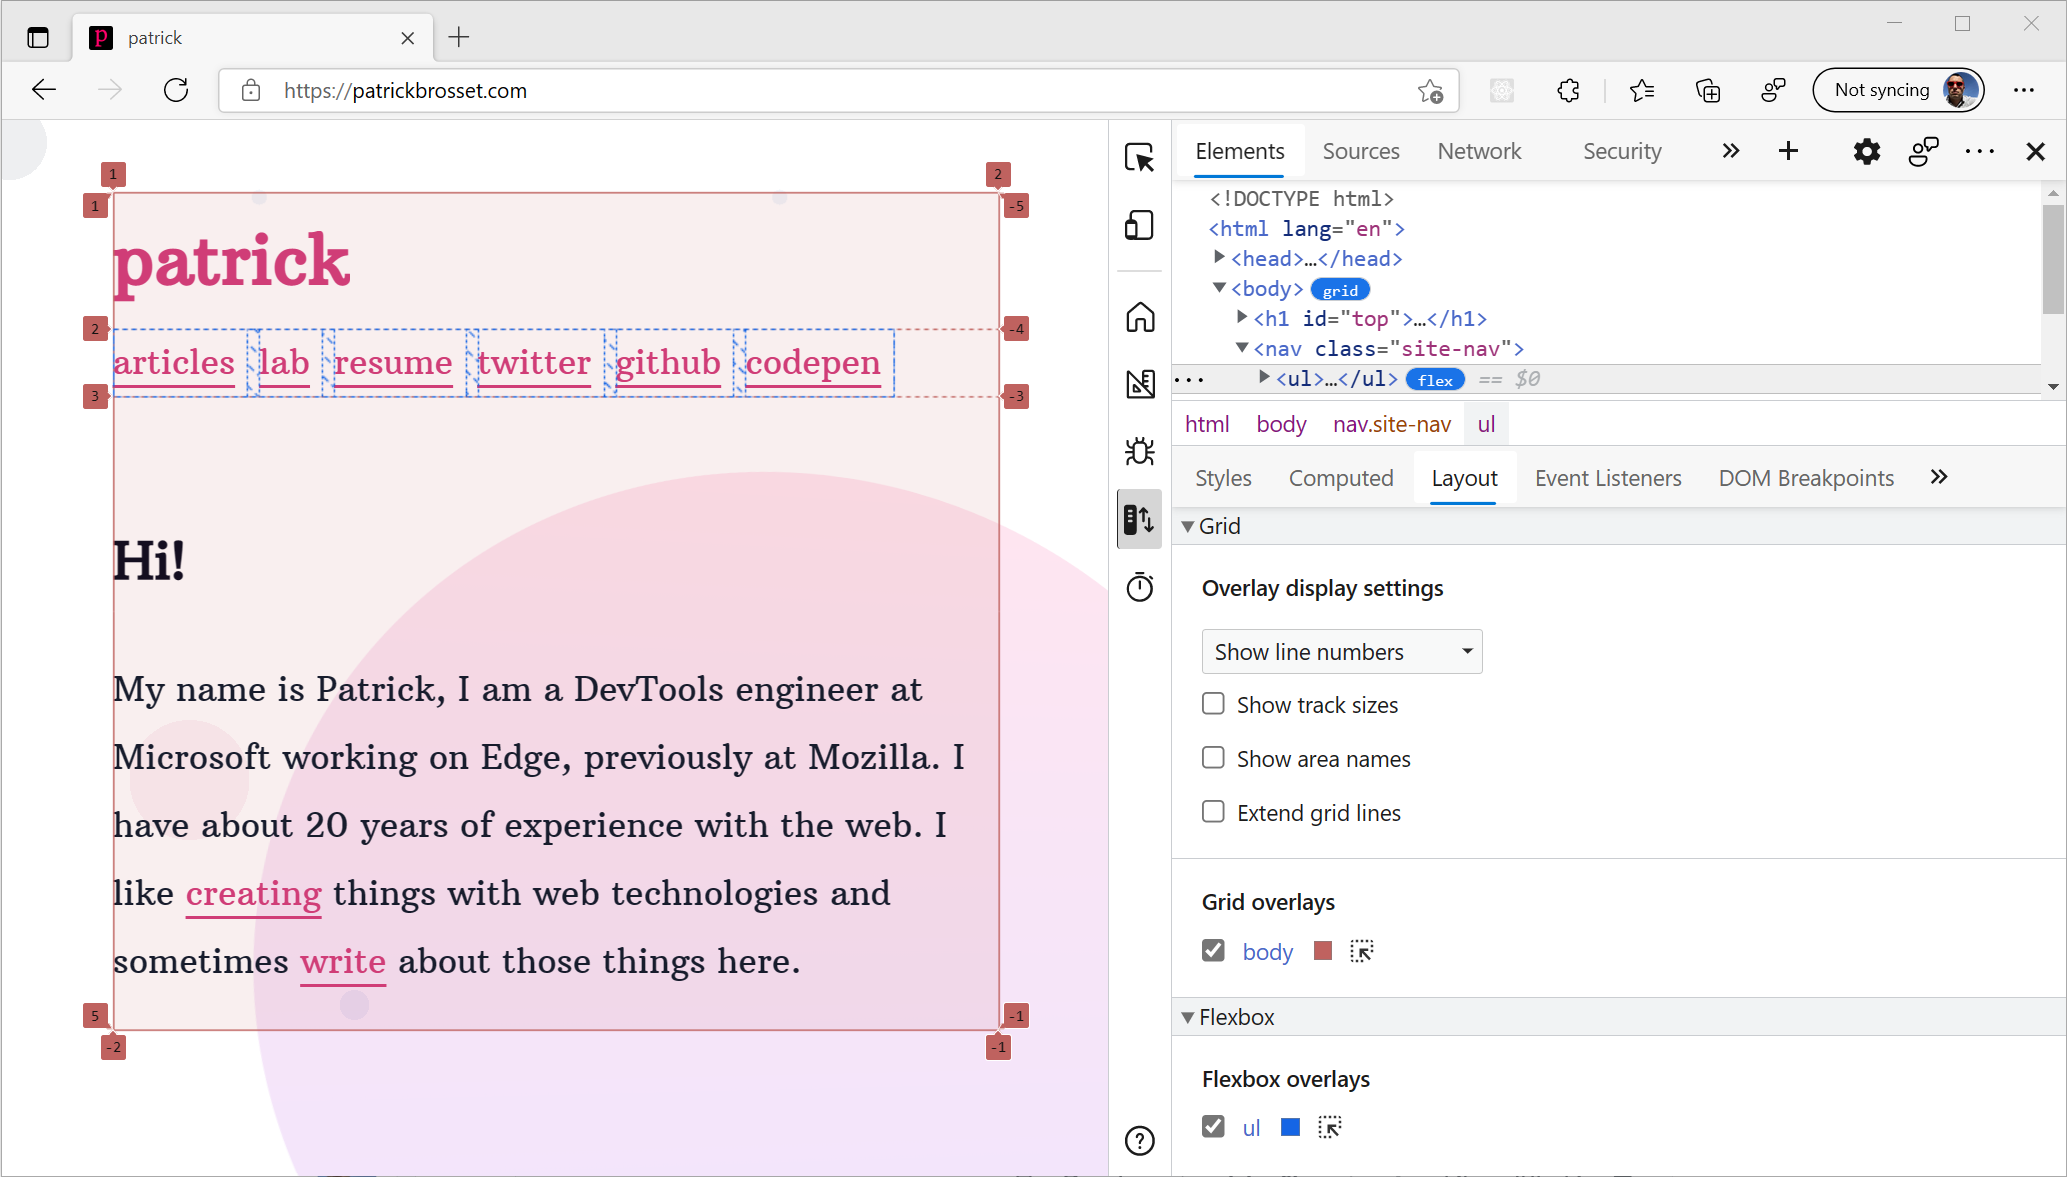
- Flex and grid editors to visually play around with the various properties.
- Alignment icons in the CSS autocomplete make it easier to choose properties and values.
- Highlight on property hover to understand what parts of the page a property applies to.
You can read more information about this on Microsoft’s and Google’s documentation sites.
Localization
This was another collaborative project involving Microsoft and Google which, now, makes it possible for all Chromium-based DevTools to be translated in languages other than English.
Originally, there was never a plan to localize DevTools, which means that this was a huge effort. It involved going over the entire codebase and making UI strings localizable.
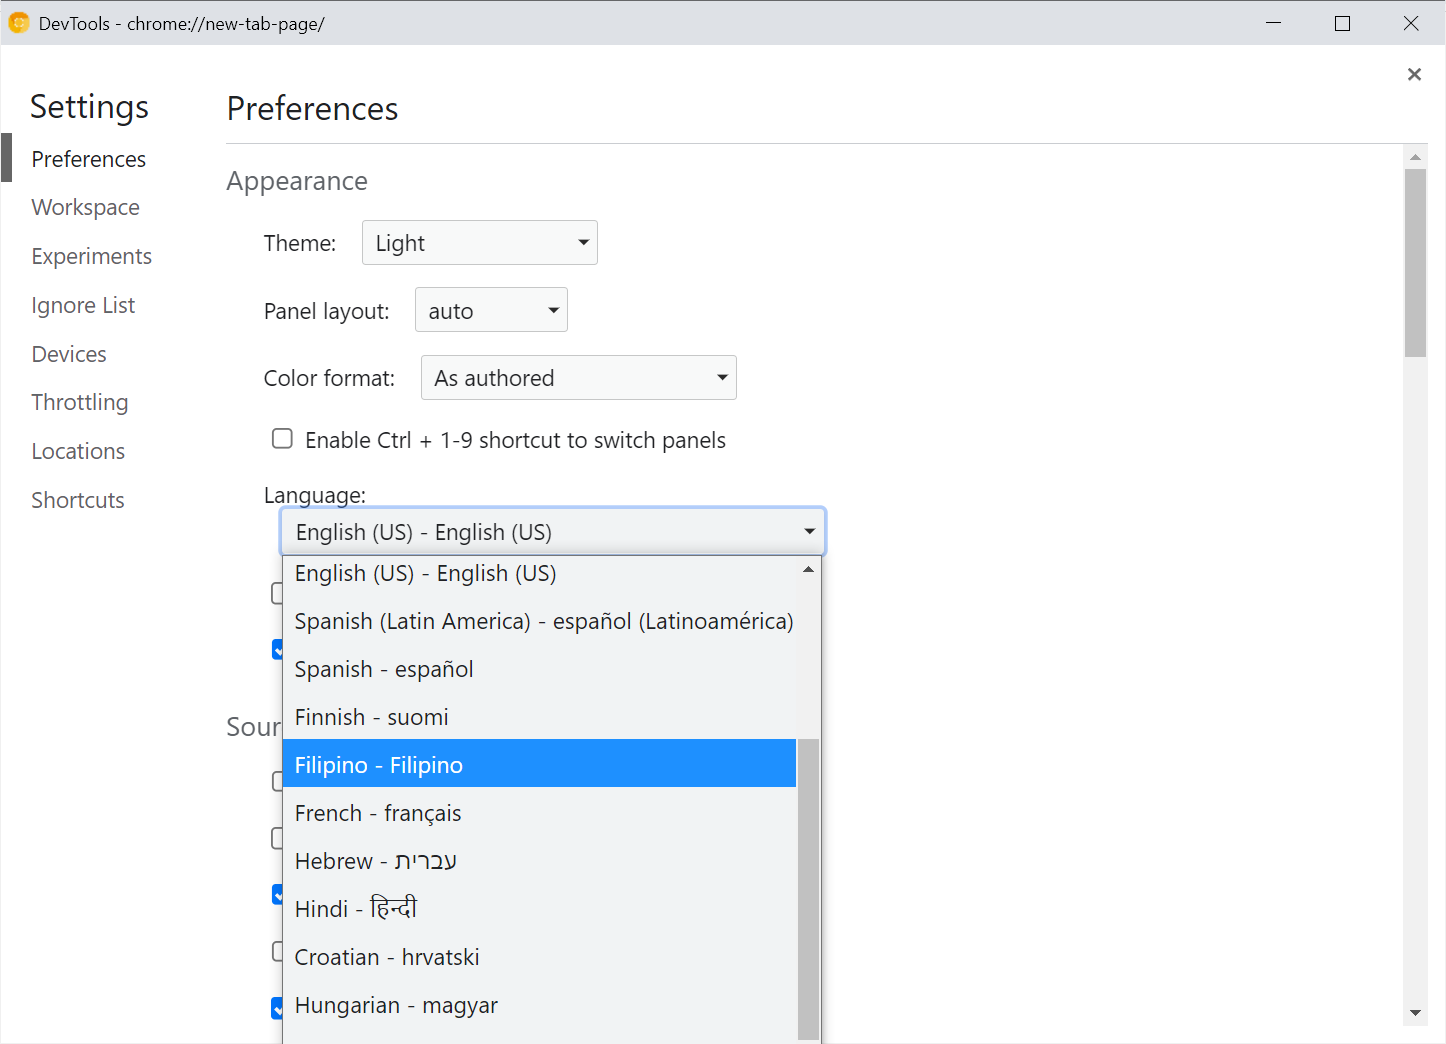
The result was worth it though. If English isn’t your first language and you’d feel more comfortable using DevTools in a different one, head over to the Settings (F1) and find the language drop-down.
Here is a screenshot of what it looks like in Chrome DevTools:
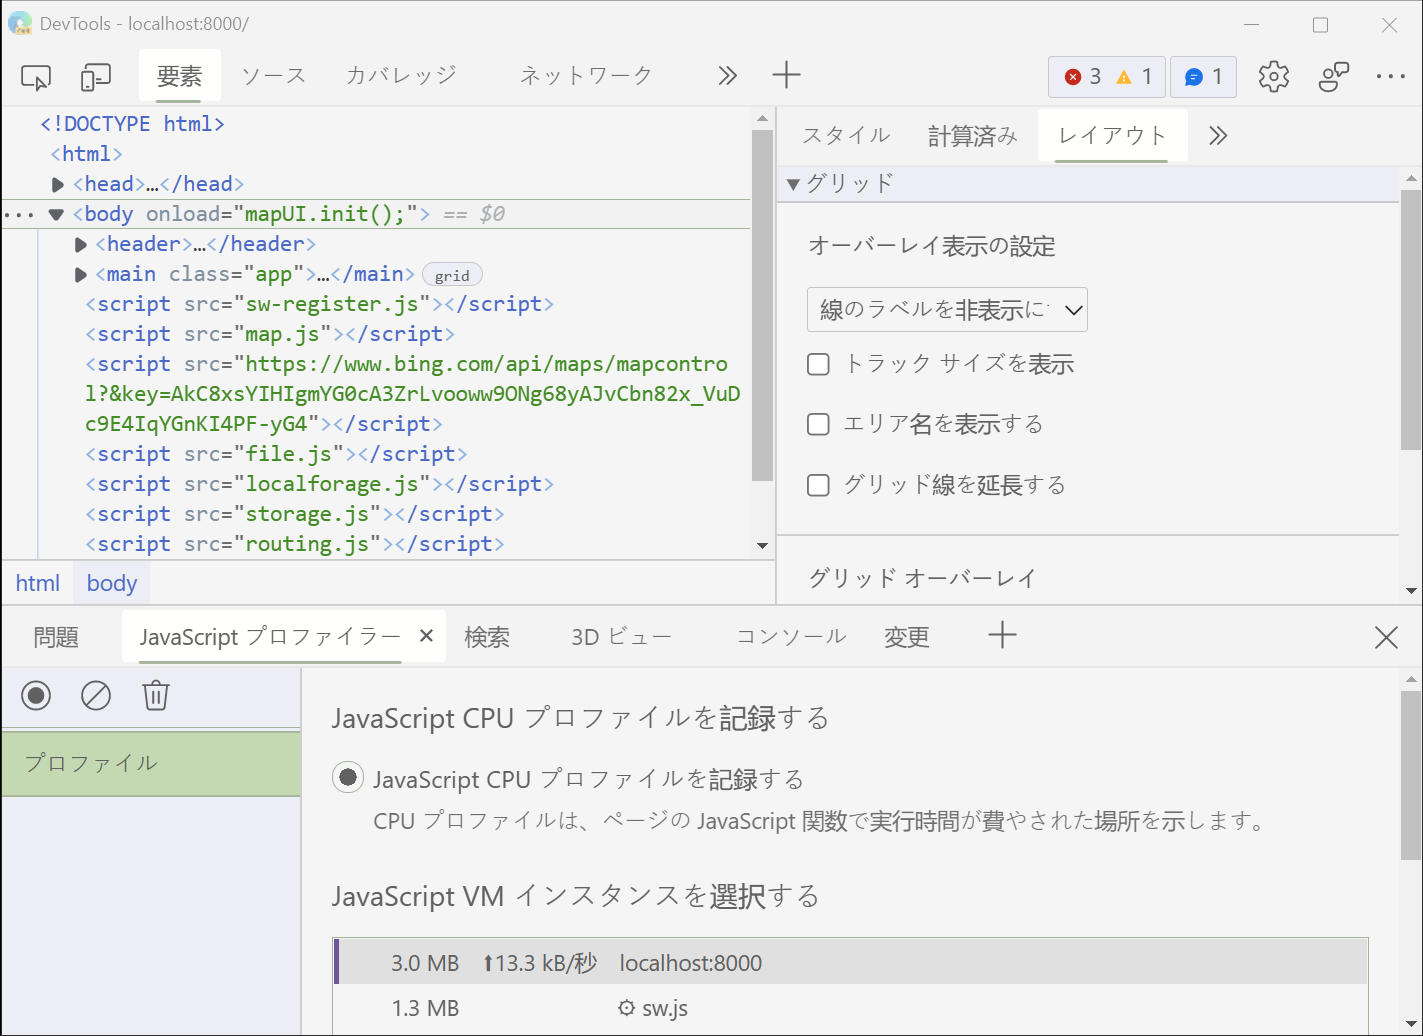
And here is how Edge looks in Japanese:
Edge DevTools
Microsoft switched to Chromium to develop Edge more than 2 years ago now. While, at the time, it caused a lot of discussions in the web community, not much has been written or said about it since then. The people working on Edge (including its DevTools) have been busy though, and the browser has a lot of unique features now.
Being based on the Chromium open source project does mean that Edge benefits from all of its features and bug fixes. Practically speaking, the Edge team ingests the changes made in the Chromium repository in their own repository.
But over the past year or so, the team started to create Edge-specific functionality based on the needs of Edge users and feedback. Edge DevTools now has a series of unique features that I will go over.
Opening, Closing, And Moving Tools
With almost 30 different panels, DevTools is a really complicated piece of software in any browser. But, you never really need access to all the tools at the same time. In fact, when starting DevTools for the first time, only a few panels are visible and you can add more later.
On the other hand though, it’s hard to discover the panels that aren’t shown by default, even if they could be really useful to you.
Edge added 3 small, yet powerful, features to address this:
- a close button on tabs to close the tools you don’t need anymore,
- a
+(plus) button at the end of the tab bar to open any tool, - a context menu option to move tools around.
The following GIF shows how closing and opening tools in both the main and drawer areas can be done in Edge.
You can also move tools between the main area and drawer area:
- right-clicking on a tab at the top shows a “Move to bottom” item, and
- right-clicking on a tab in the drawer shows a “Move to top” item.
Getting Contextual Help With The DevTools Tooltips
It is hard for beginners and seasoned developers alike to know all about DevTools. As I mentioned before, there are so many panels that it’s unlikely you know them all.
To address this, Edge added a way to go directly from the tools to their documentation on Microsoft’s website.
This new Tooltips feature works as a toggleable overlay that covers the tools. When enabled, panels are highlighted and contextual help is provided for each of them, with links to documentation.
You can start the Tooltips in 3 different ways:
- by using the Ctrl + Shift + H keyboard shortcut on Windows/Linux (Cmd + Shift + H on Mac);
- by going into the main (
...) menu, then going into Help, and selecting “Toggle the DevTools Tooltips”; - by using the command menu and typing “Tooltips”.
Customizing Colors
In code editing environments, developers love customizing their color themes to make the code easier to read and more pleasant to look at. Because web developers spend considerable amounts of time in DevTools too, it makes sense for it to also have customizable colors.
Edge just added a number of new themes to DevTools, on top of the already available dark and light themes. A total of 9 new themes were added. These come from VS Code and will therefore be familiar to people using this editor.
You can select the theme you want to use by going into the settings (using F1 or the gear icon in the top-right corner), or by using the command menu and typing theme.
Firefox DevTools
Similar to the Chrome DevTools team, the folks working on Firefox DevTools have been busy with a big architecture refresh aimed at modernizing their codebase. Additionally, their team is quite a bit smaller these days as Mozilla had to refocus over recent times. But, even though this means they had less time for adding new features, they still managed to release a few really interesting ones that I’ll go over now.
Debugging Unwanted Scrollbars
Have you ever asked yourself: “where is this scrollbar coming from?” I know I have, and now Firefox has a tool to debug this very problem.
In the Inspector panel, all elements that scroll have a scroll badge next to them, which is already useful when dealing with deeply nested DOM trees. On top of this, you can click this badge to reveal the element (or elements) that caused the scrollbar to appear.
You can find more documentation about it here.
Visualizing Tabbing Order
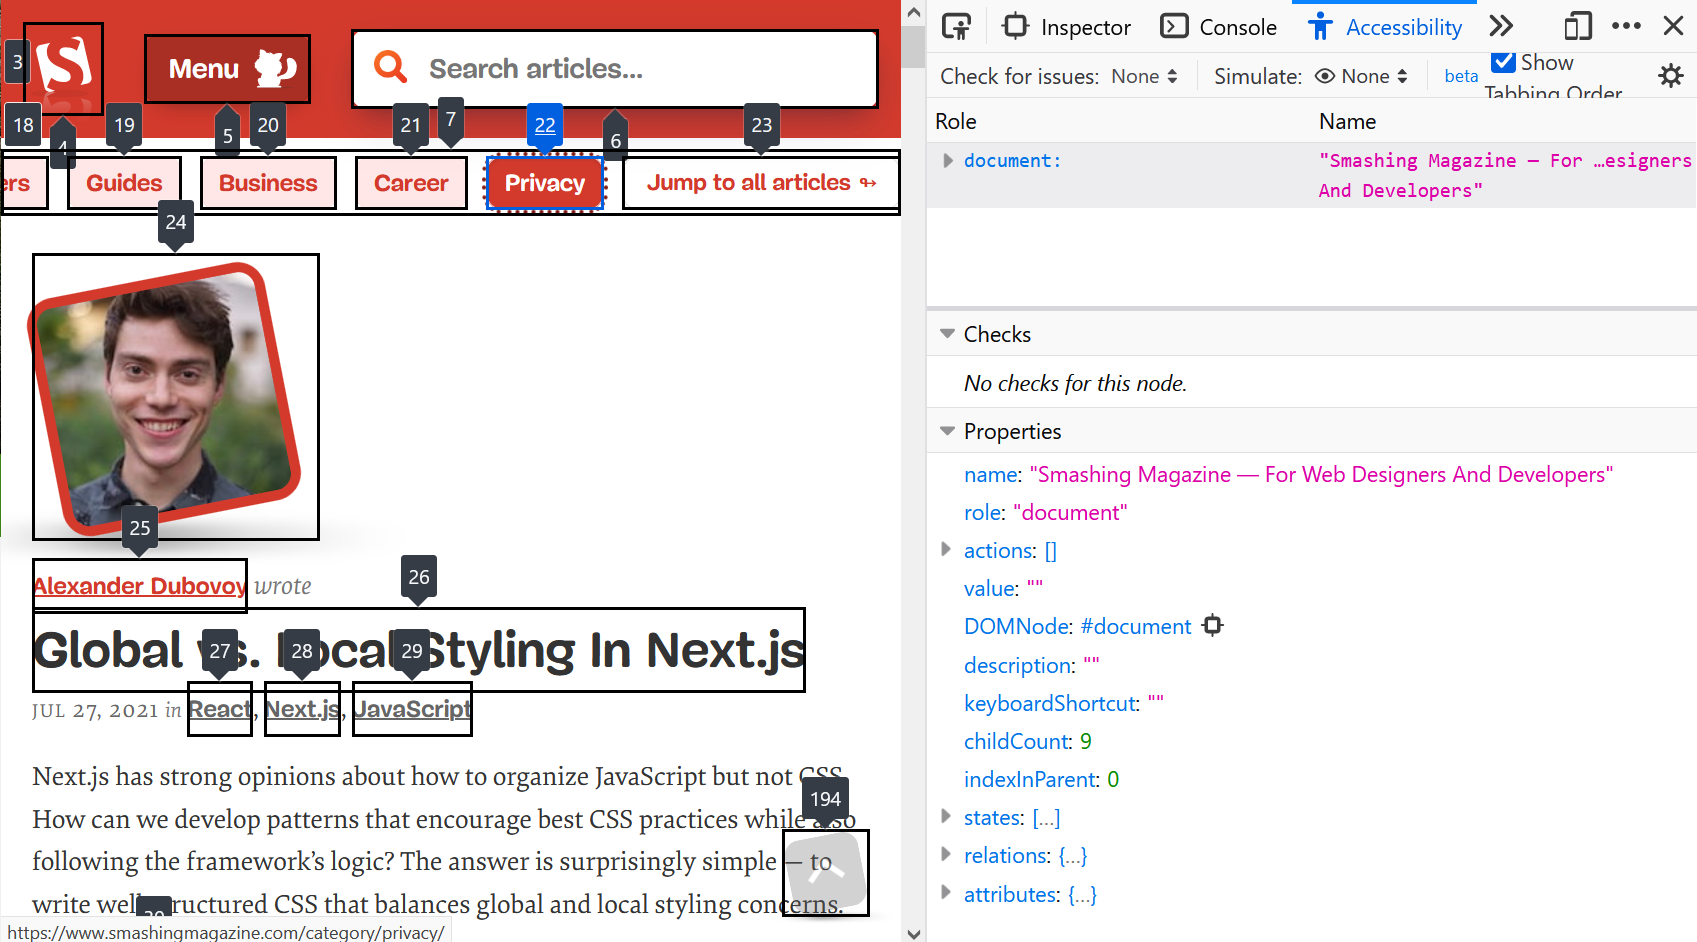
Navigating a web page with the keyboard requires using the tab key to move through focusable elements one by one. The order in which focusable elements get focused while using tab is an important aspect of the accessibility of your site and an incorrect order may be confusing to users. It’s especially important to pay attention to this as modern layout CSS techniques allow web developers to rearrange elements on a page very easily.
Firefox has a useful Accessibility Inspector panel that provides information about the accessibility tree, finds and reports various accessibility problems automatically, and lets you simulate different color vision deficiencies.
On top of these features, the panel now provides a new page overlay that displays the tabbing order for focusable elements.
To enable it, use the “Show Tabbing Order” checkbox in the toolbar.
You can find more documentation about it here.
A Brand New Performance Tool
Not many web development areas depend on tooling as much as performance optimization does. In this domain, Chrome DevTools’ Performance panel is best in class.
Over the past few years, Firefox engineers have been focusing on improving the performance of the browser itself, and to help them do this, they built a performance profiler tool. The tool was originally built to optimize the engine native code but supported analyzing JavaScript performance right from the start, too.
Today, this new performance tool replaces the old Firefox DevTools performance panel in pre-release versions (Nightly and Developer Edition). Take it for a spin when you get the chance.
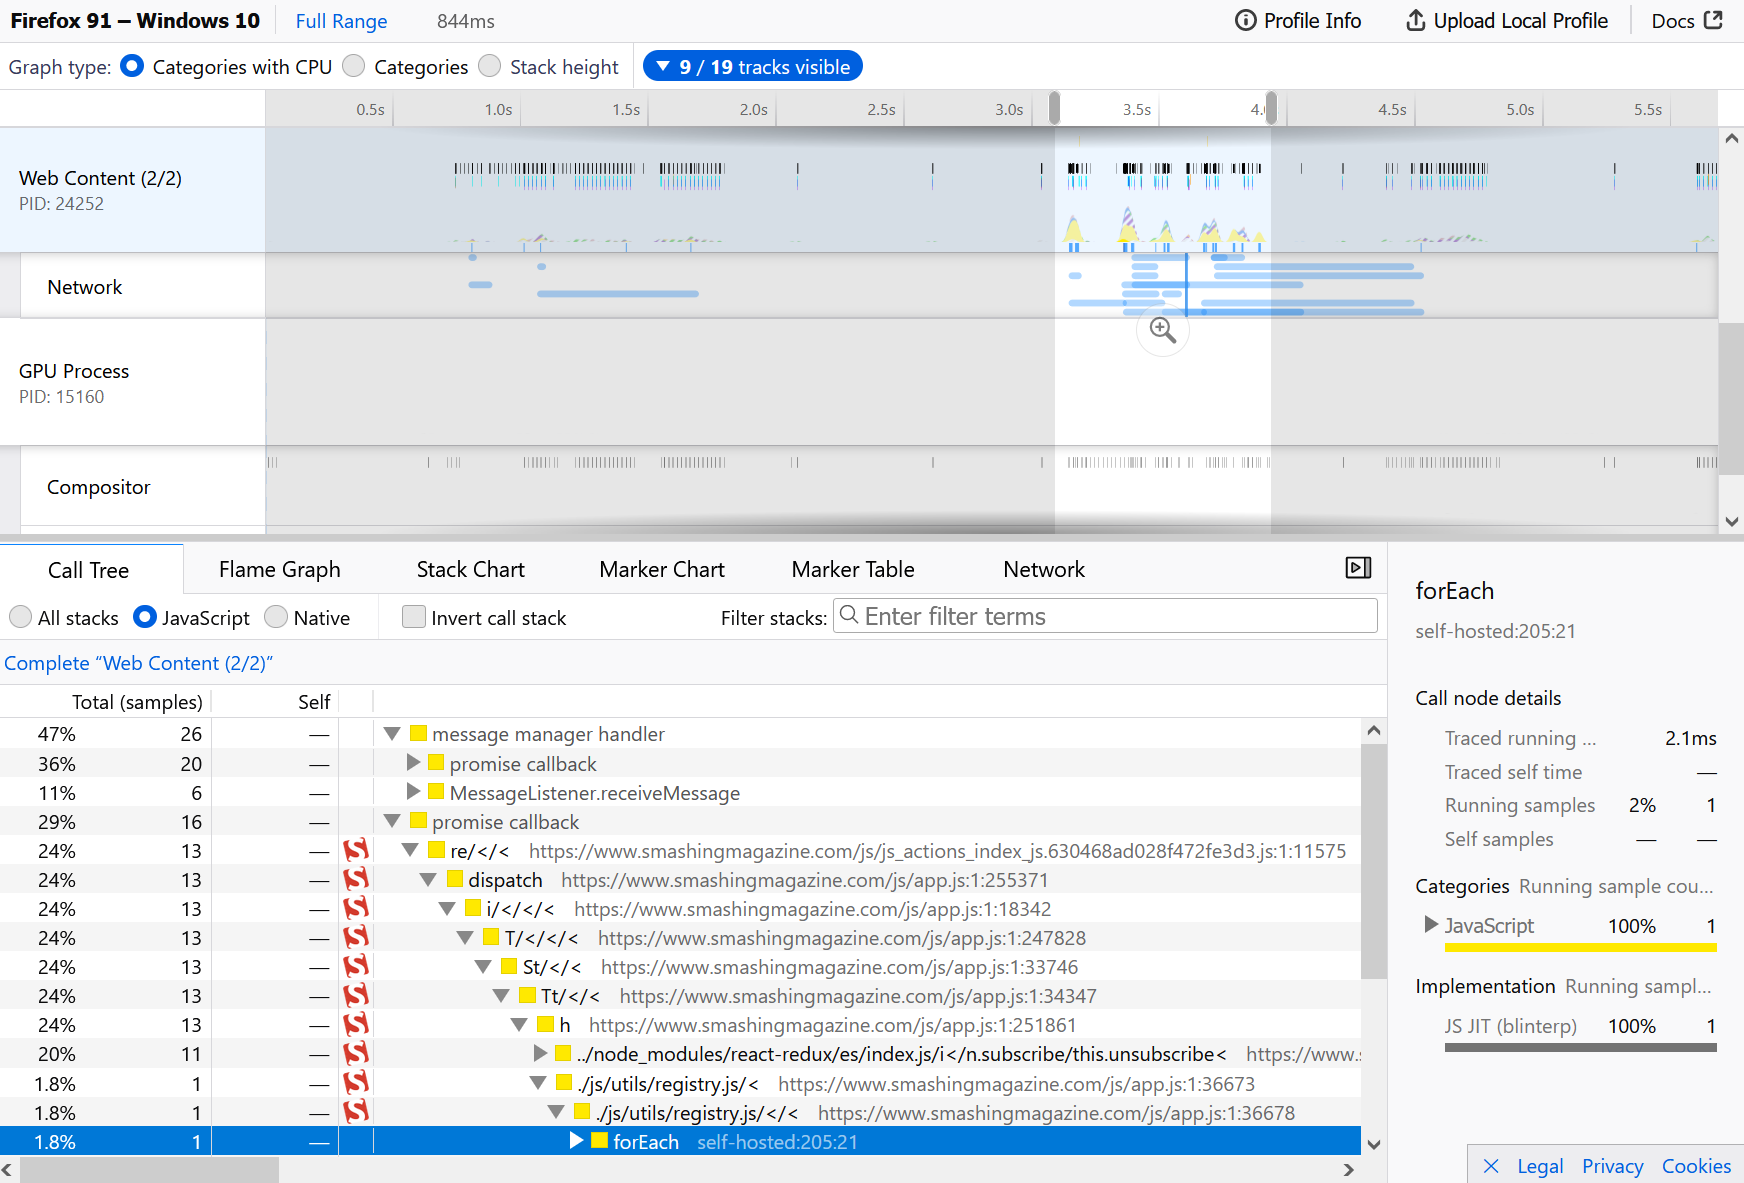
Among other things, the new Firefox profiler supports sharing profiles with others so they can help you improve the performance of your recorded use case.
You can read documentation about it here, and learn more about the project on their GitHub repository.
Safari Web Inspector
Last but not least, let’s go over a few of the recent Safari features.
The small team at Apple has been keeping itself very busy with a wide range of improvements and fixes around the tools. Learning more about the Safari Web Inspector can help you be more productive when debugging your sites on iOS or tvOS devices. Furthermore, it has a bunch of features that other DevTools don’t, and that not a lot of people know about.
CSS Grid Debugging
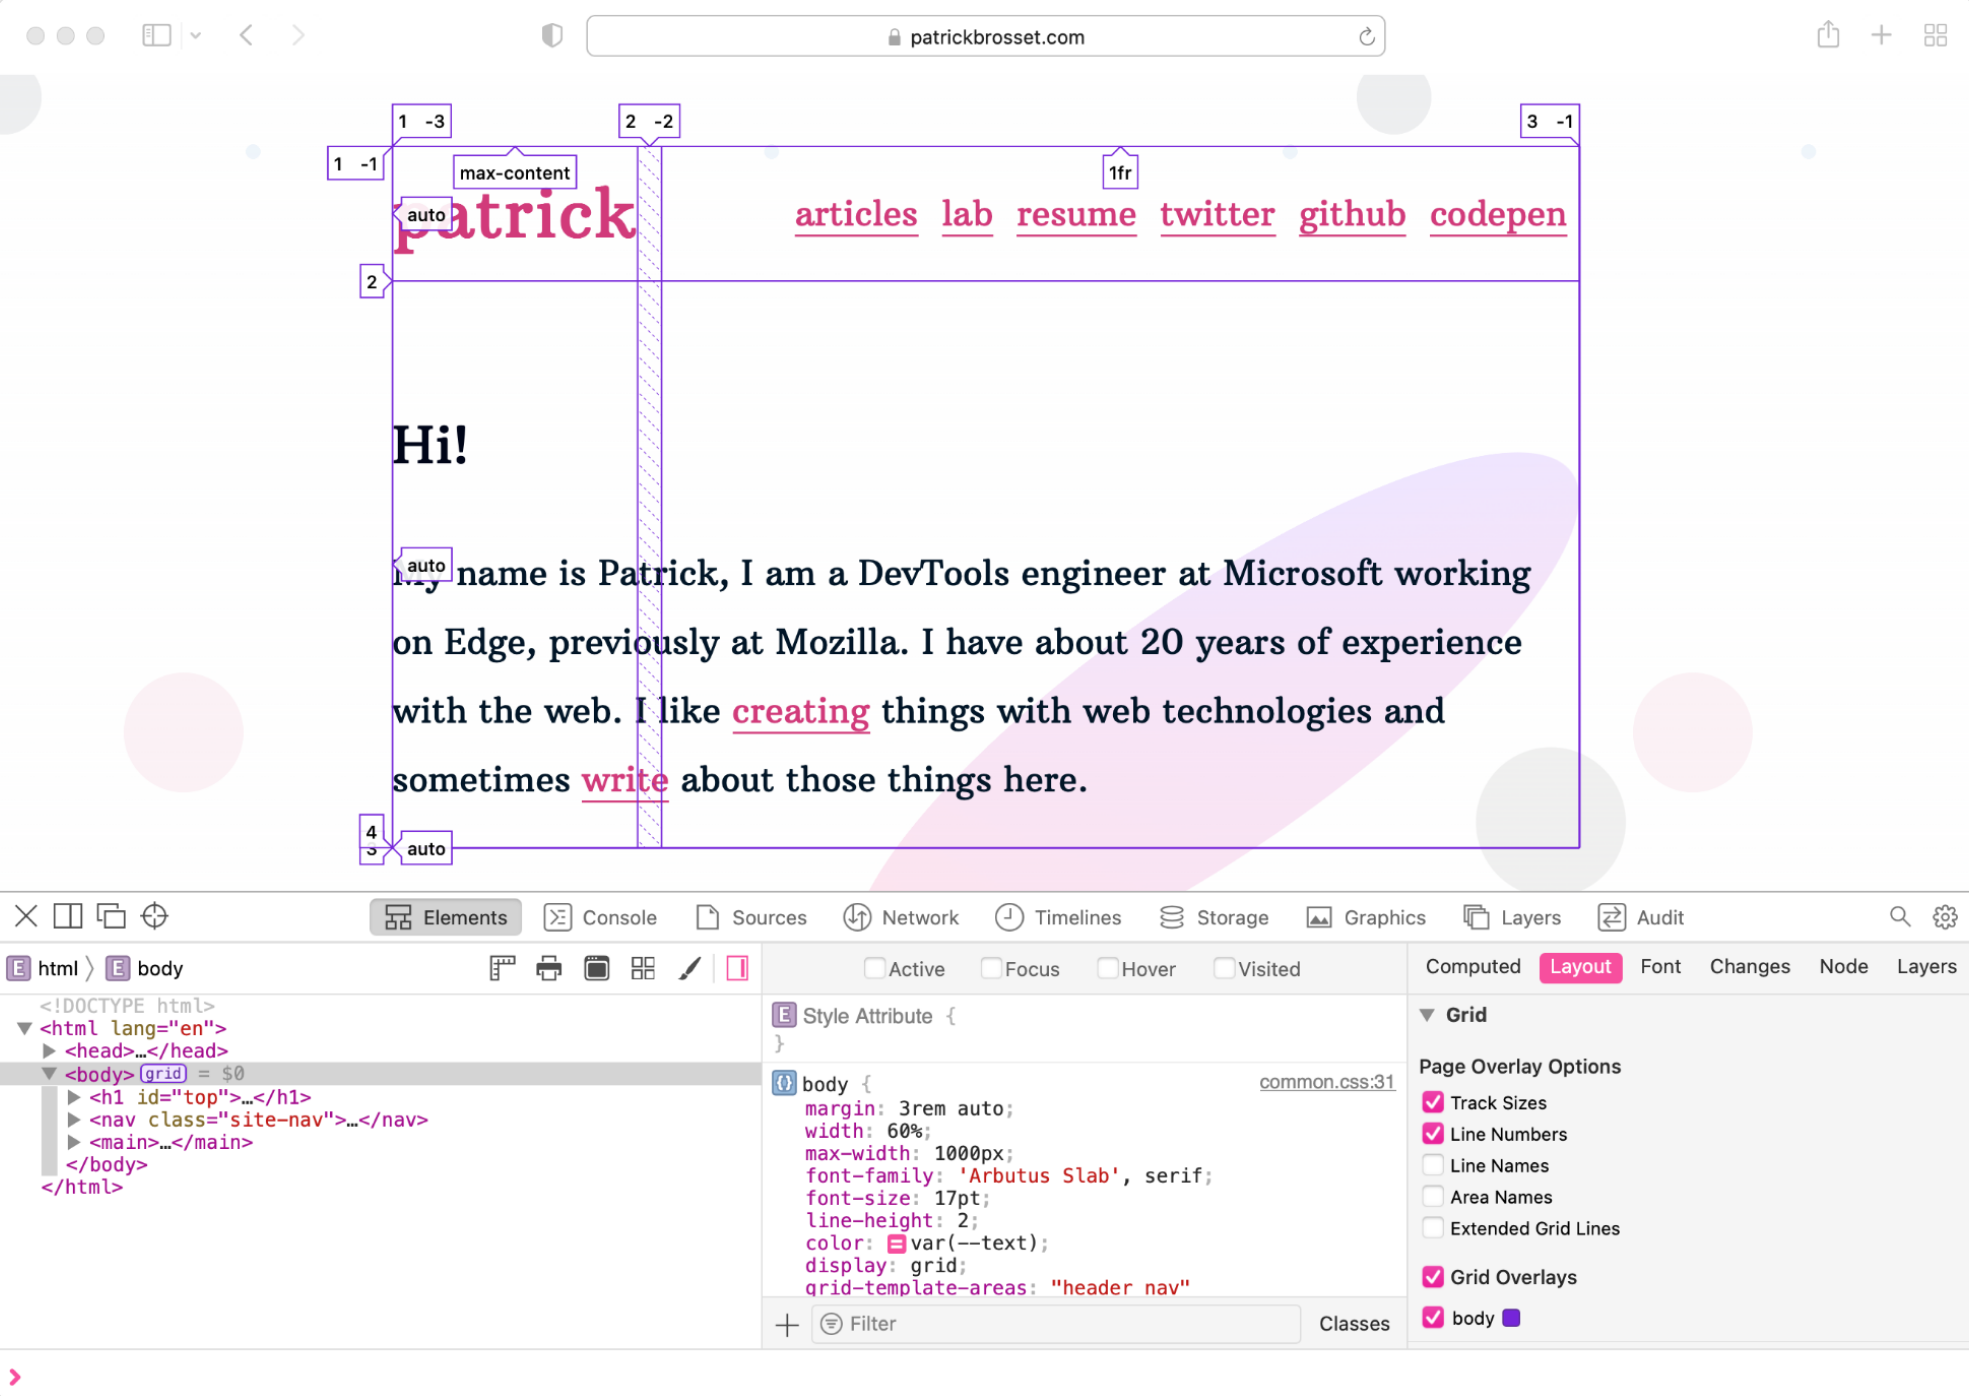
With Firefox, Chrome, and Edge (and all Chromium-based browsers) having dedicated tools for visualizing and debugging CSS grids, Safari was the last major browser not to have this. Well, now it does!
Fundamentally, Safari now has the same features just like other browsers’ DevTools in this area. This is great as it means it’s easy to go from one browser to the next and still be productive.
- Grid badges are displayed in the Elements panel to quickly find grids.
- Clicking on the badge toggles the visualization overlay on the page.
- A new Layout panel is now displayed in the sidebar. It allows you to configure the grid overlay, see the list of all grids on the page and toggle the overlay for them.
What’s interesting about Safari’s implementation though is that they’ve really nailed the performance aspect of the tool. You can enable many different overlays at once, and scroll around the page without it causing any performance problems at all.
The other interesting thing is Safari introduced a 3-pane Elements panel, just like Firefox, which allows you to see the DOM, the CSS rules for the selected element, and the Layout panel all at once.
Find out more about the CSS Grid Inspector on this WebKit blog post.
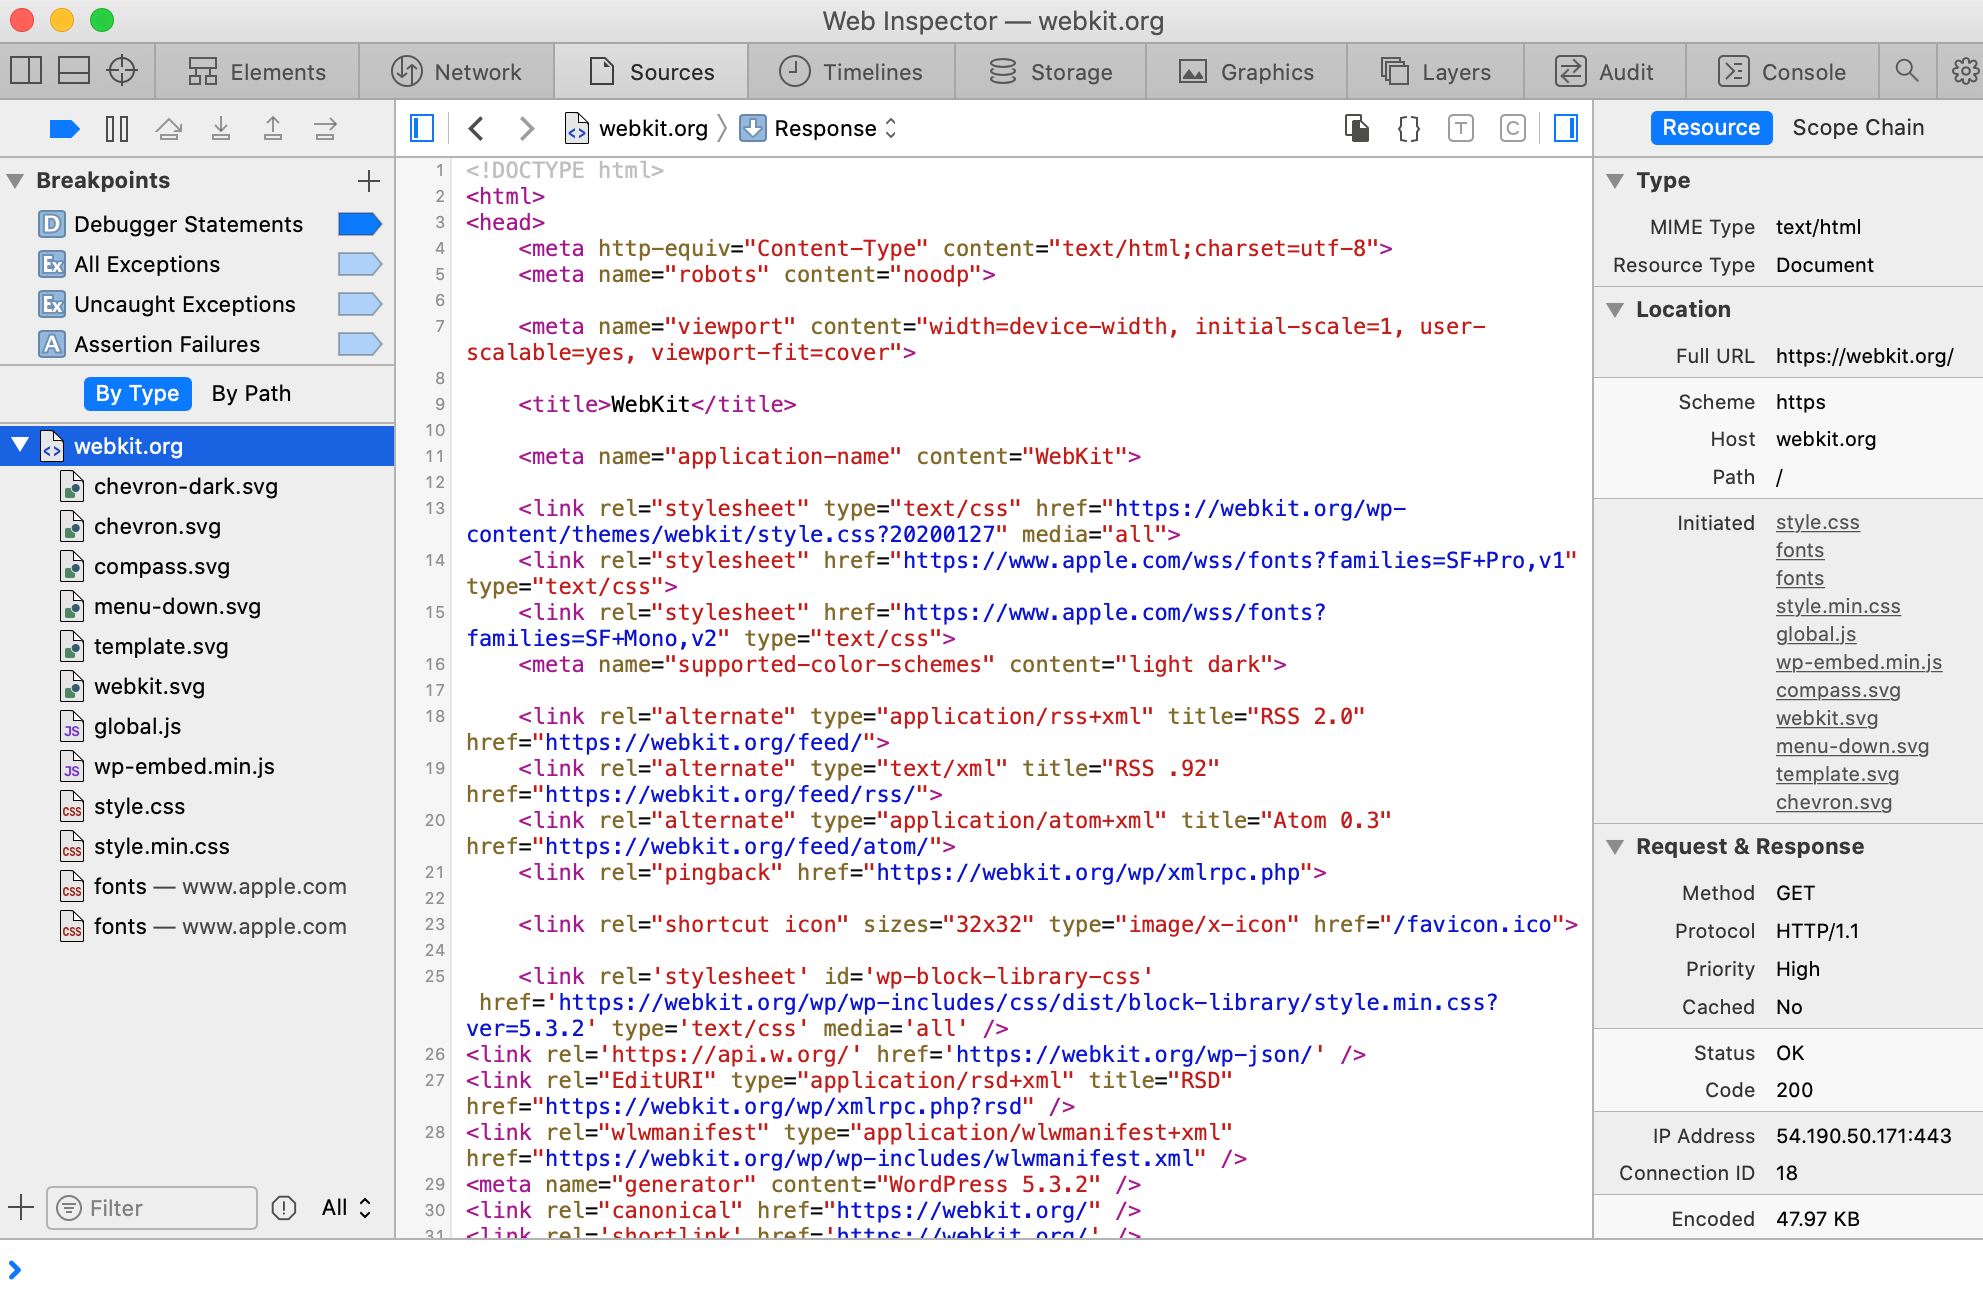
A Slew of Debugger Improvements
Safari used to have a separate Resources and Debugger panel. They have merged them into a single Sources panel that makes it easier to find everything you need when debugging your code. Additionally, this makes the tool more consistent with Chromium which a lot of people are used to.
Consistency for common tasks is important in a cross-browser world. Web developers already need to test across multiple browsers, so if they need to learn a whole new paradigm when using another browser’s DevTools, it can make things more difficult than they need to be.
But Safari also recently focused on adding innovative features to its debugger that other DevTools don’t have.
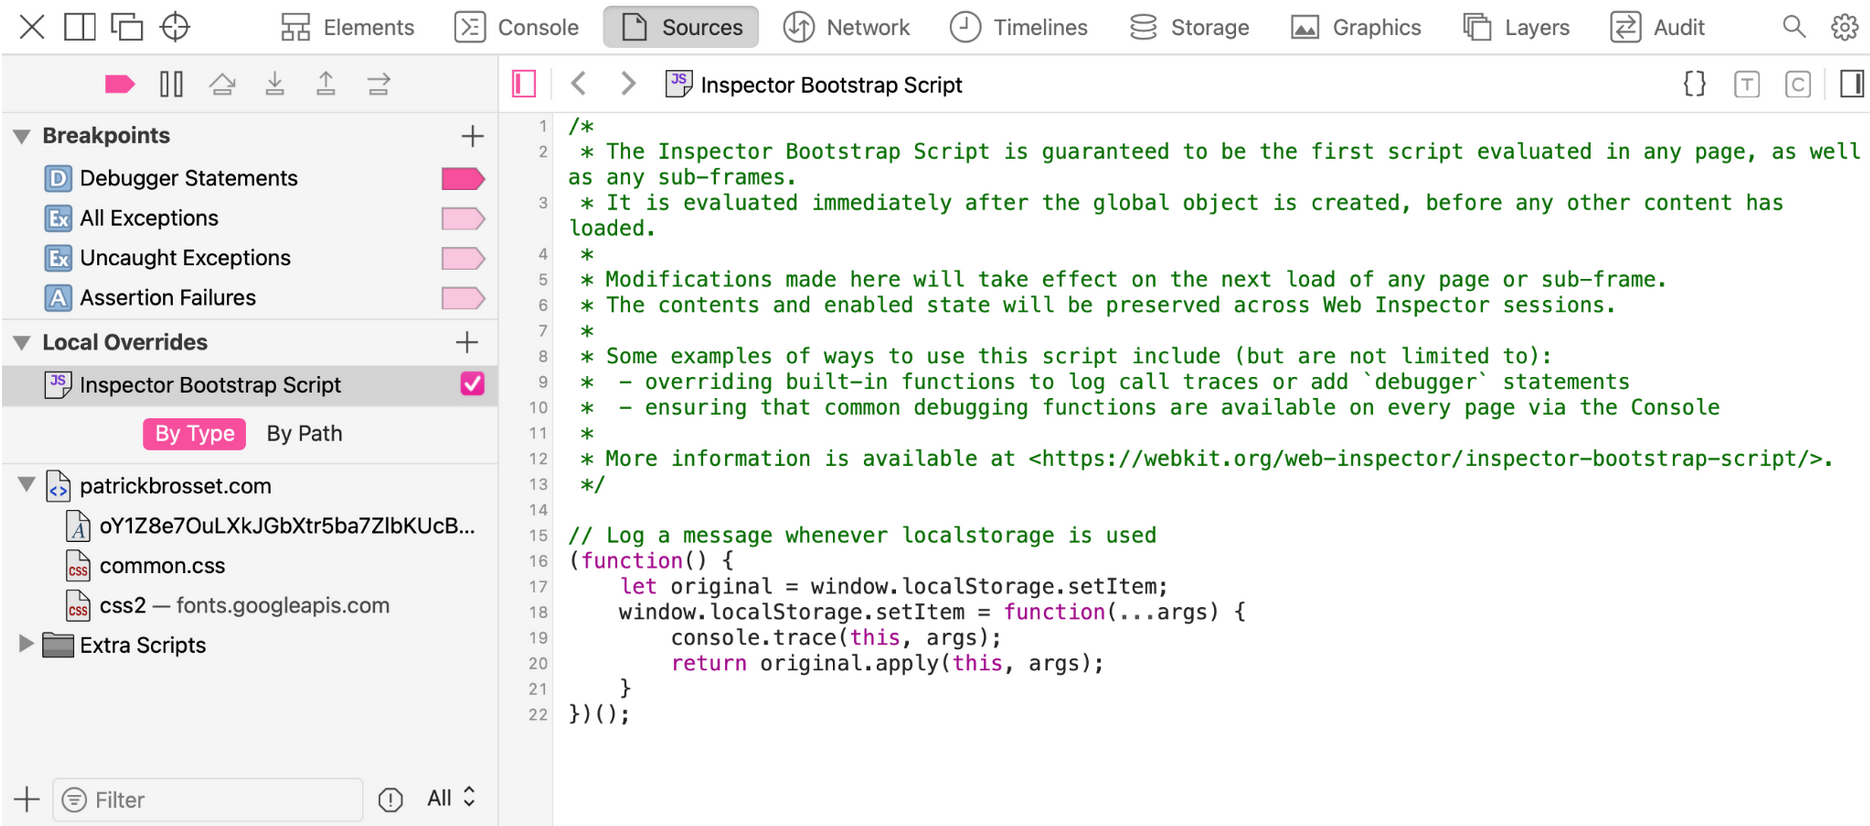
Bootstrap script:
Safari lets you write JavaScript code that is guaranteed to run first before any of the scripts on the page. This is very useful to instrument built-in functions for adding debugger statements or logging for example.
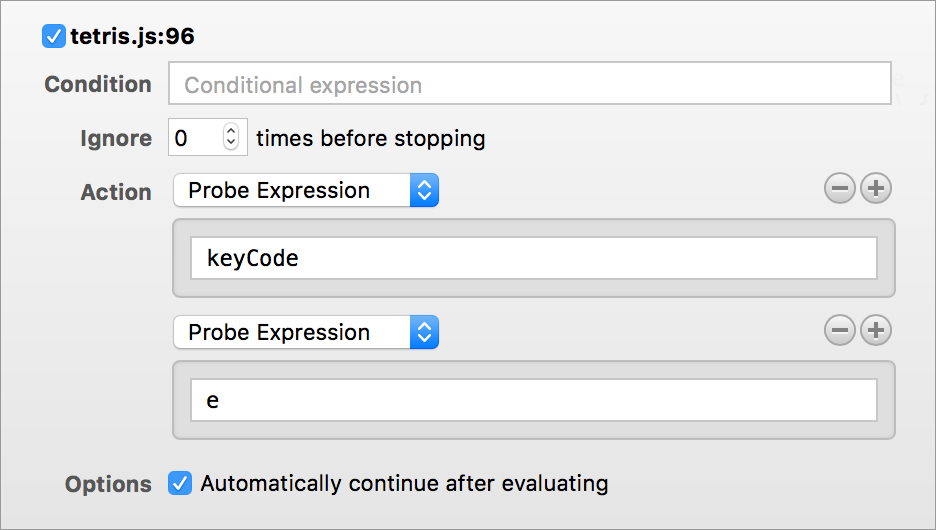
New breakpoint configurations:
All browsers support multiple types of breakpoints like conditional breakpoints, DOM breakpoints, event breakpoints, and more.
Safari recently improved their entire suite of breakpoint types by giving them all a way to configure them extensively. With this new breakpoint feature, you can decide:
- if you want a breakpoint to only hit when a certain condition is true,
- if you want the breakpoint to pause execution at all, or just execute some code,
- or even play an audio beep so you know some line of code was executed.
queryInstances and queryHolders console functions:
These two functions are really useful when your site starts using a lot of JavaScript objects. In some situations, it may become difficult to keep track of the dependencies between these objects, and memory leaks may start to appear, too.
Safari does have a Memory tool that can help resolve these issues by letting you explore memory heap snapshots. But sometimes you already know which class or object is causing the problem and you want to find what instances exist or what refers to it.
If Animal is a JavaScript class in your application, then queryInstances(Animal) will return an array of all of its instances.
If foo is an object in your application, then queryHolders(foo) will return an array of all the other objects that have references to foo.
Closing Thoughts
I hope these features will be useful to you. I can only recommend using multiple browsers and getting familiar with their DevTools. Being more familiar with other DevTools can prove useful when you have to debug an issue in a browser you don’t use on a regular basis.
Know that the companies which make browsers all have teams working on DevTools actively. They’re invested in making them better, less buggy, and more powerful. These teams depend on your feedback to build the right things. Without hearing about what problems you are facing, or what features you lack, it’s harder for them to make the right decisions about what to build.
Reporting bugs to a DevTools team won’t just help you when the fix comes, but may also be helping many others who have been facing the same issue.
It’s worth knowing that the DevTools teams at Microsoft, Mozilla, Apple and Google are usually fairly small and receive a lot of feedback, so reporting an issue does not mean it will be fixed quickly, but it does help, and those teams are listening.
Here are a few ways you can report bugs, ask questions or request features:
- Firefox DevTools
- Firefox uses Bugzilla as their public bug tracker and anyone is welcome to report bugs or ask for new features by creating a new entry there. All you need is a GitHub account to log in.
- Getting in touch with the team can either be done on Twitter by using the @FirefoxDevTools account or logging in to the Mozilla chat (find documentation about the chat here).
- Safari Web Inspector
- Safari also uses public bug tracking for their WebKit bugs. Here is documentation about how to search for bugs and report new ones.
- You can also get in touch with the team on Twitter with @webkit.
- Finally, you can also signal bugs about Safari and the Safari Web Inspector using the feedback assistant.
- Edge DevTools
- The easiest way to report a problem or ask for a feature is by using the feedback button in DevTools (the little stick figure in the top-right corner of the tools).
- Asking questions to the team works best over Twitter by mentioning the @EdgeDevTools account.
- Chrome DevTools
- The team listens for feedback on the devtools-dev mailing list as well as on twitter at @ChromeDevTools.
- Chromium
- Since Chromium is the open-source project that powers Google Chrome and Microsoft Edge (and others), you can also report issues on the Chromium’s bug tracker.
With that, thank you for reading!
Further Reading
- The Design Leader Dilemma
- Motion Controls In The Browser
- CSS Auditing Tools
- A Guide To Test-Driven Development Using Node.js


