What’s New In DevTools?

Email Newsletter
Weekly tips on front-end & UX.
Trusted by 182,000+ folks.
 Custom Web Forms for Angular, React, & Vue. Your backend.
 Celebrating 10 million developers


In September last year, I wrote about some of the latest updates in our beloved DevTools, across Firefox, Chrome, Safari, and Edge. Four months have already passed since then, and the different teams working on DevTools have been busy! In these four months, they built a lot of new things for us to use. From powerful productivity improvements to entire new panels, they’ve been continuing to close the parity gap and innovate with new means of debugging and improving our web experiences.
That means it’s high time for another DevTools update, so let’s jump right in!
Chrome
The Chrome team just released a new panel that makes it very straightforward to record and replay user flows: the Recorder panel.
Record, Replay And Measure User Flows
If you’ve ever found yourself having to repeat the same navigation steps over and over again in a web app in order to investigate a bug, then this might change your life!
But there’s more! Once the steps are recorded, you can replay them while measuring performance. This way, you can work on optimizing your code, while being sure to always run the same scenario every time you test.
You can learn more about the Recorder here. And if you have feedback about this tool, the team will be very happy to hear your thoughts on this chromium issue.
Navigate The Accessibility Tree
Rendering pages to the screen isn’t the only thing that browsers do. They also use the DOM tree they build in the process to create another tree: the accessibility tree. The accessibility tree is another representation of the current page that can be used by assistive technologies, like screen readers.
As a web developer, it is very useful to have access to this accessibility tree. It helps understand how the markup you choose influences the way screen readers interpret the page.
Chrome DevTools has had an Accessibility panel for some time in the sidebar of the Elements panel which contains the accessibility tree. Recently though, the team has been experimenting with displaying both the accessibility and the DOM tree in the same place, allowing developers to go back and forth between the two.
To enable this experiment, go to the Accessibility sidebar panel, and check the “Enable full-page accessibility tree”. You will then have a new button displayed in the top-right corner of the DOM tree that lets you switch between the DOM and accessibility trees.
Find out more here, and let the team know your feedback.
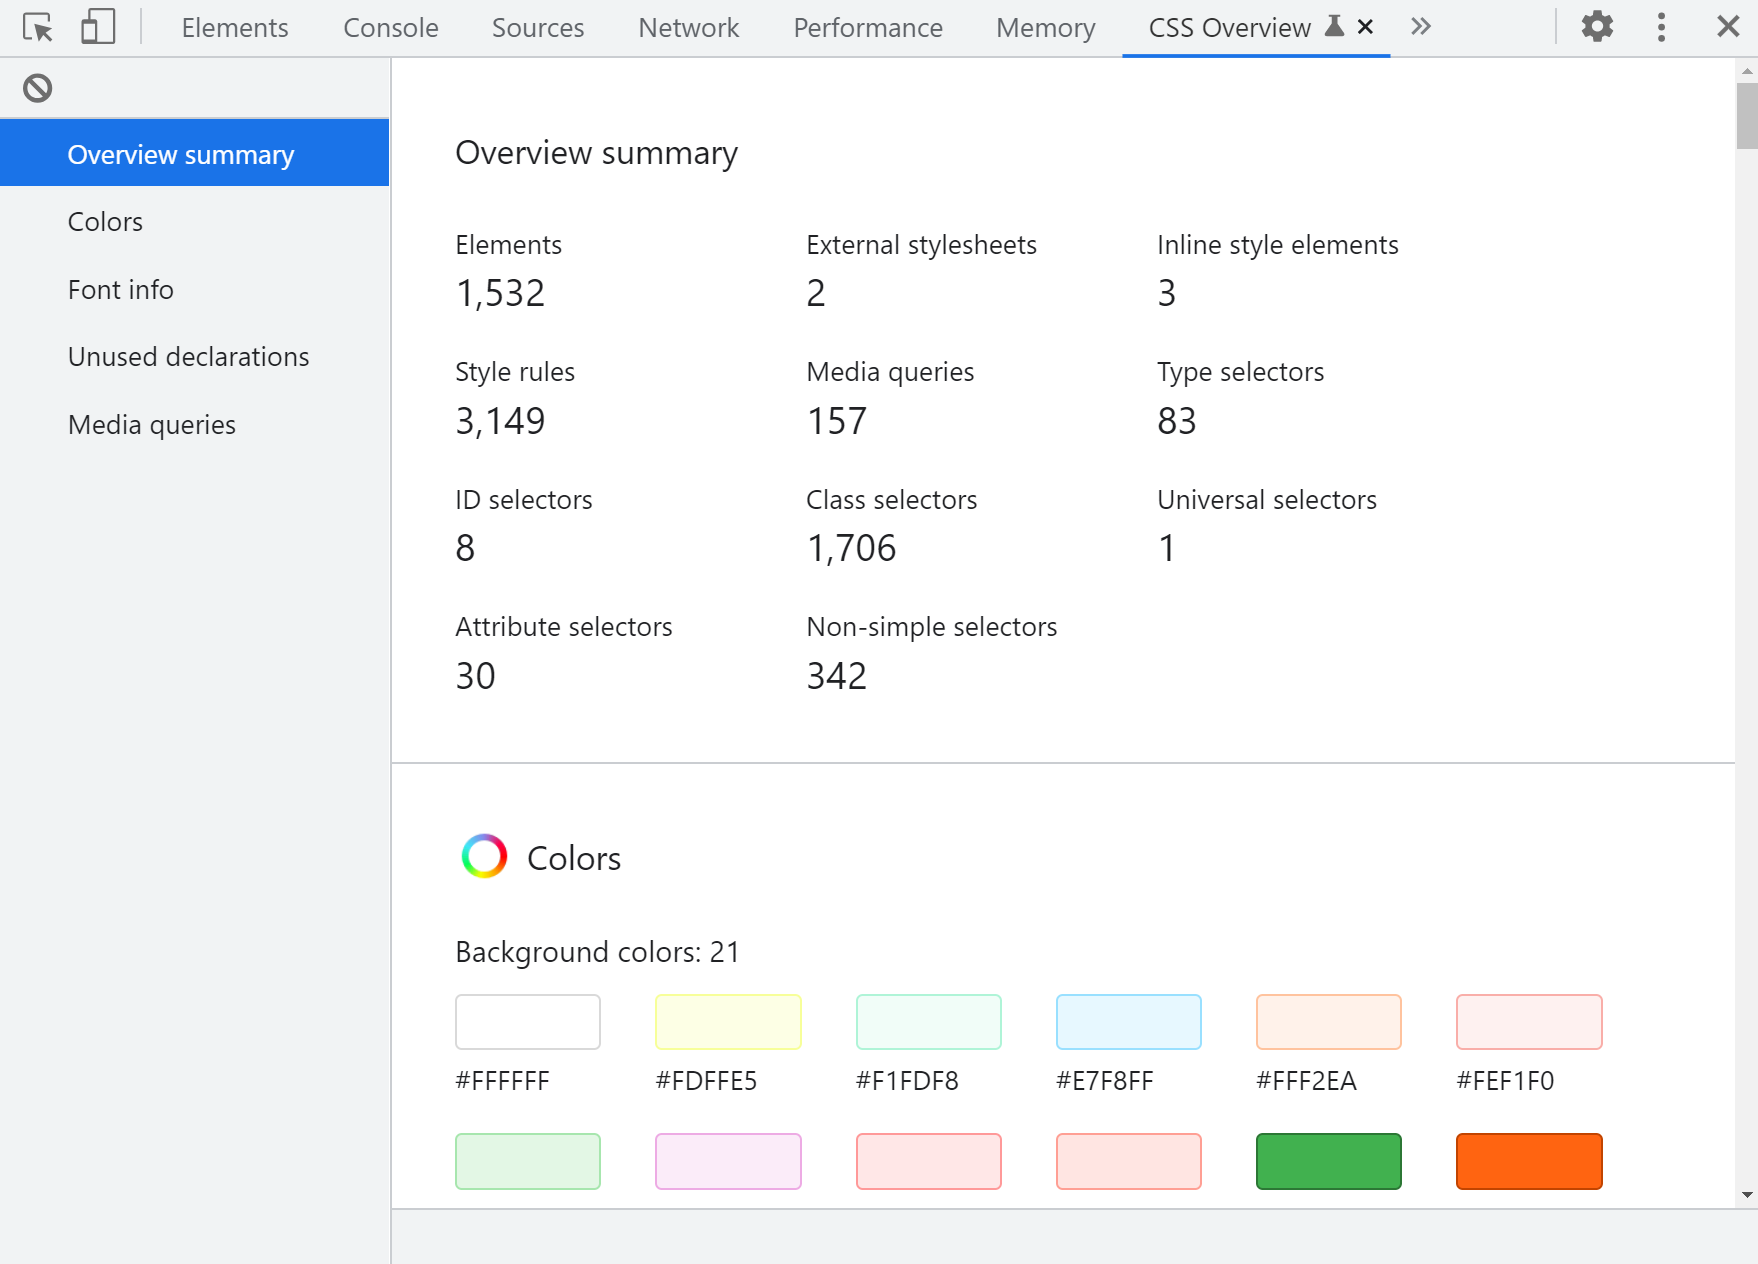
CSS Overview Is Now On By Default
The CSS overview panel isn’t new, but with so many panels to choose from, you might have never used it. It has been an experiment for a very long time, which means you needed to go into DevTools settings to enable it before being able to use it.
This is no longer necessary. The CSS Overview panel is just a regular feature now, and you can open it by going into … > More tools > CSS Overview.
If you’ve never used it, give it a try as it is a very useful tool to identify potential CSS improvements like contrast issues or unused CSS declarations.
While you’re in the More tools menu, take a look around. Chrome DevTools has more than 30 individual panels! That’s a lot, but keep in mind they’re all here for a specific reason. There might be aspects of your web app that certain panels could help you with. Be curious, and if you have no idea what a thing does, remember there are docs you can read.
Edge
While Microsoft’s browser team continues to be an active contributor to the Chromium project, they’re also spending more time on new and unique features that only Edge has. Let’s review two of them here.
Debug DOM Memory Leaks With The Detached Elements Panel
Edge just launched a memory leak investigation tool, the Detached Elements tools, which can be very useful to investigate leaks in long-running apps.
One of the multiple reasons why web pages leak memory is detached DOM elements: elements that might have been needed at some point, but got removed from the DOM, and never re-attached. When a code base grows in complexity, it’s easier to make mistakes and forget to clean those detached elements up.
If you find that your app keeps on needing more and more memory over time as you use it, give the Detached Elements a try. It can very quickly point you in the right direction.
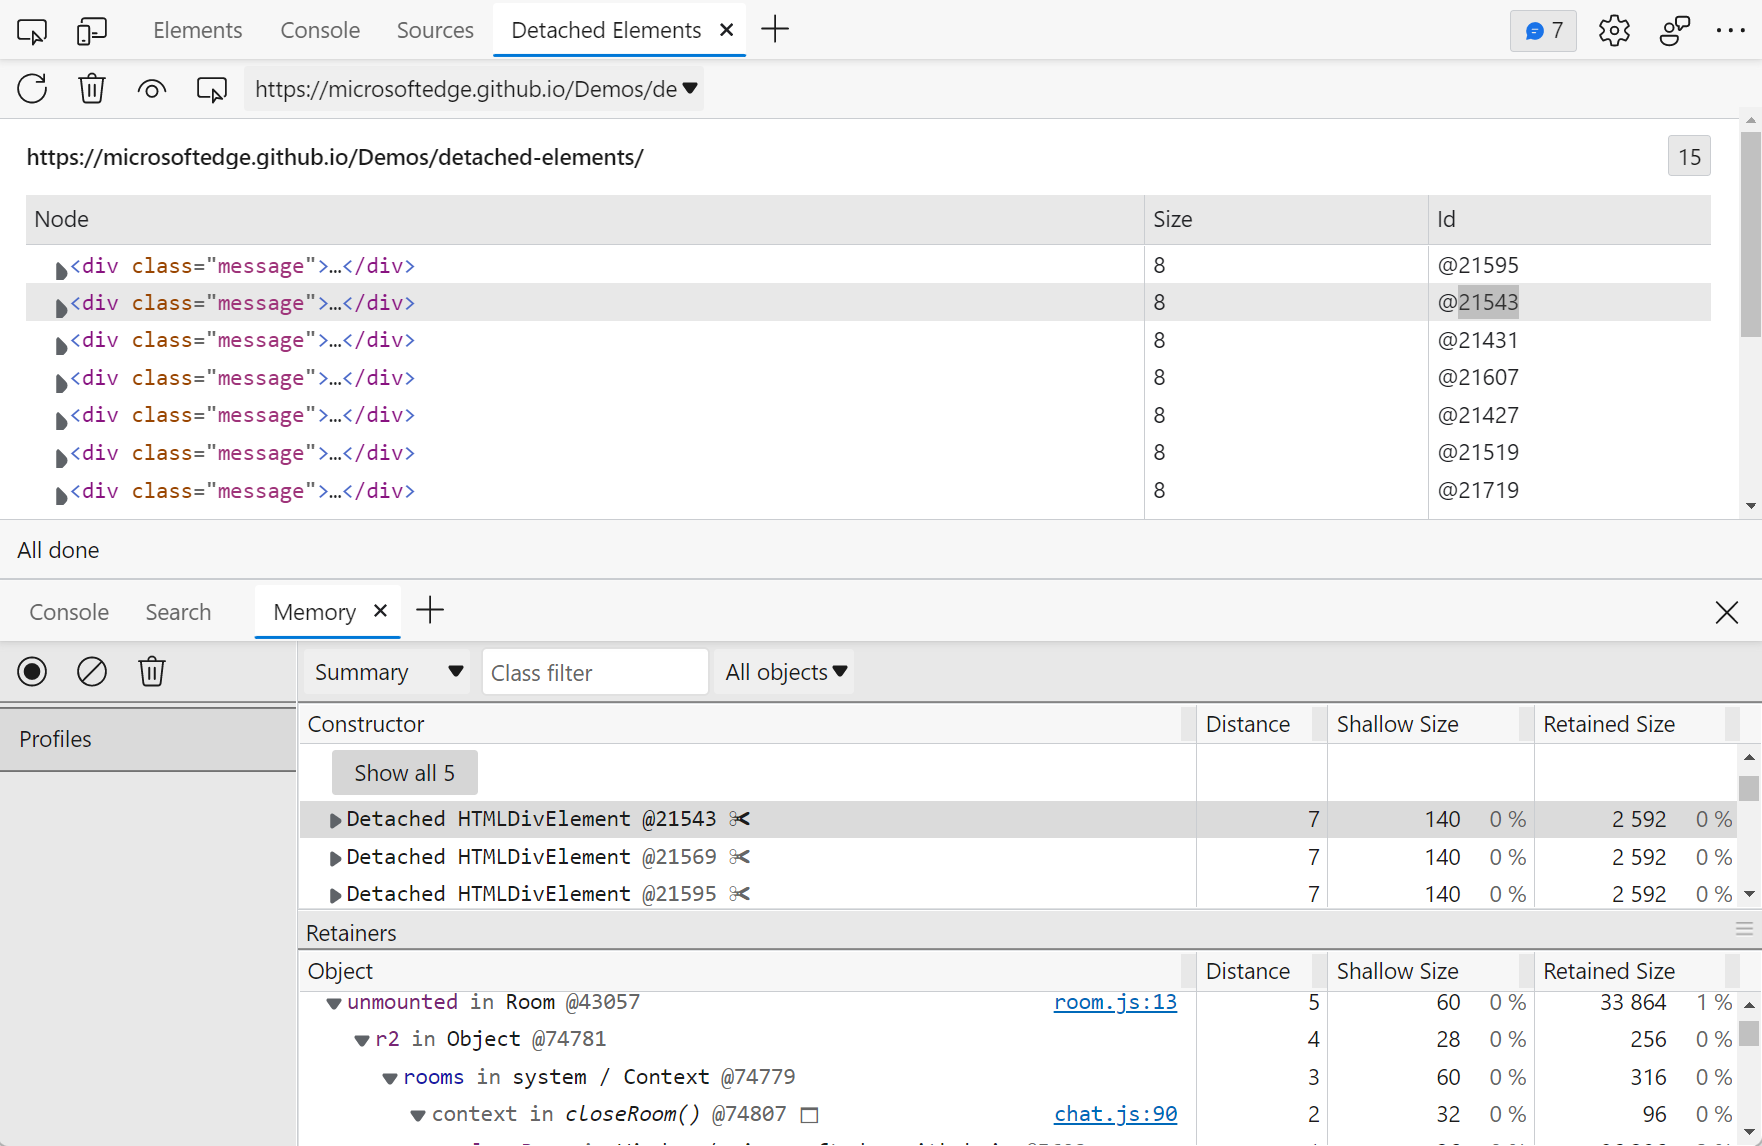
Learn more about it on the announcement blog post, and the docs.
A Brand New User Interface For DevTools With Focus Mode
Our DevTools have looked the way they do ever since the early Firebug days. Sure, the user interface has evolved over time a little bit, with more tools added, and things re-arranged, but at a high level, it’s still mostly the same.
The Edge team has conducted experiments and user studies that indicate that DevTools can be very overwhelming (did I say DevTools had more than 30 panels already?). While new web developers don’t have a clear idea of where to start and how to explore and use the tools, more experienced developers tend to find themselves in just one or two familiar workflows.
Based on this, the Edge team released a new experimental feature that makes it easier to learn and use DevTools: Focus Mode.
Focus Mode has a new activity bar, an easy way to add and remove tools, a quick view drawer, and re-designed menus.
To give Focus Mode a try, enable it first by going to Settings > Experiments > Focus Mode.
You can learn more about Focus Mode in this Edge explainer document.
Safari
While Safari itself updates roughly twice a year (with a major version in the fall with new features and another one in spring), it’s possible to get more frequent updates and access to early features by using the Safari Technology Preview channel. This version of the browser updates itself approximately every 2 to 3 weeks.
You might not want to use the Technology Preview channel for all of your testing since your customers will likely only have the regular Safari version installed, but it’s still a very interesting browser to use from time to time. By doing so, you’ll have access to new features earlier, and check what’s coming to Safari soon.
Here are some of the latest updates to the Safari Web Inspector available in the Technology Preview channel that make working with CSS much better.
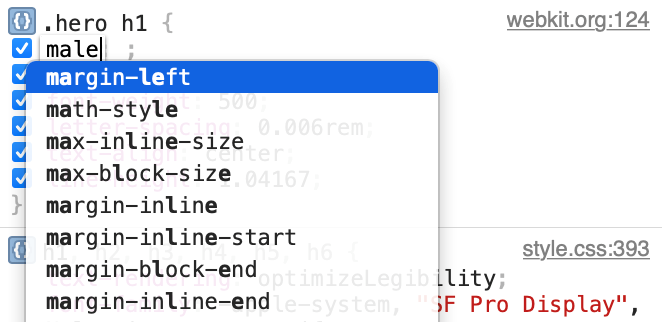
Fuzzy Auto-Completion For CSS In The Styles Panel
Changing CSS is one of the things we do most in DevTools, and Safari just made it a lot faster for us all.
Now, their auto-completion for CSS supports fuzzy matching, which means you can type things like “pat” to match padding-top, or “bob” to match border-bottom.
If you use VS Code or another text editor that supports fuzzy auto-completion, you will feel right at home.
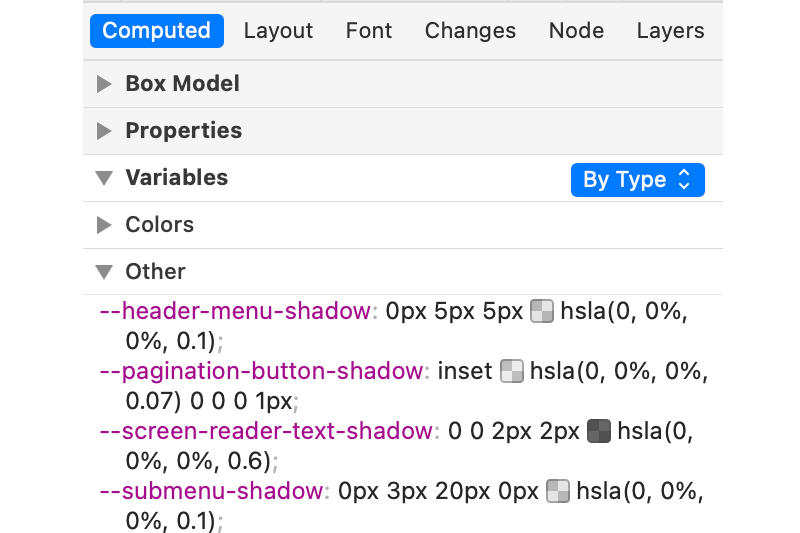
Grouping Of CSS Variables By Types In The Computed Panel
CSS variables (aka Custom Properties) have now been supported on all major browsers for years, and site owners, design systems, and libraries have really started to make extensive use of them. For good reasons, they’re great!
But with this increase in usage, the Styles and Computed panes of our DevTools are starting to feel a little crowded.
Safari released a feature that helps a little bit with this. The Computed pane now lists all CSS variables neatly tucked inside a collapsible section and grouped by value types too. As an example, all color variables are grouped together.
Visually Align And Justify Flex Lines And Grid Tracks
Not long ago, Chrome and Edge got really nice alignment editors for flexbox and grid layouts in their Styles panel. They make working with complex alignment properties such as justify-content or align-items more visual, and therefore a lot easier to understand.
Safari now has a similar visual editor for align-content/items/self and justify-content/items/self CSS properties. It’s very simple to use, just click on the icon next to an alignment value in the Styles panel to open the editor. You can then choose the type of alignment for your flex lines and grid tracks.
Firefox
The Firefox DevTools team had been on a journey to re-architecture the DevTools code base for some time and, while this had resulted in fewer features being shipped during that period, that project is now complete. That means the team is back with a lot of really cool improvements.
Choose Your Execution Context
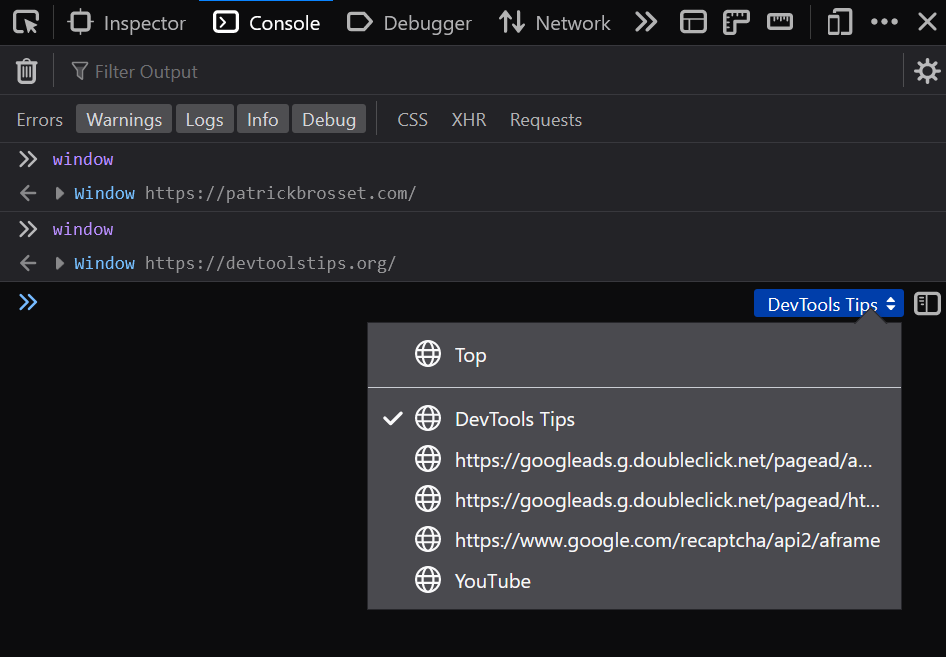
Sometimes you need to deal with multiple contexts on your site, whether those are from multiple iframes or web workers. Because the browser runs these things in multiple different processes, it’s not always possible to access them easily from DevTools.
To help with this situation, Firefox just added a context selector in the Console which you can use to choose where the code you type gets executed. For example, if you want to know the value of some global variable in an iframe, you can use the selector to switch to the iframe.
Support For hwb() Function In Inspector
The hwb() CSS color function is part of the CSS Color Module 4 specification and is a very intuitive method for specifying colors. HWB colors use 3 values: the first one is the hue, which is the starting point for the color. The second and third values are the amount of white and the amount of black that should be mixed in to create the final color.
The hwb function is currently supported on Safari and Firefox, and the Firefox DevTools team just released support for it in the Inspector. Now the hwb function is recognized correctly, and as an added bonus incrementing and decrementing the W and B values with the keyboard automatically keeps them between 0% and 100%.
Select Unselectable Elements
Interestingly, selecting elements from DevTools is subject to the pointer-events CSS property. That is, if an element is specified not to receive any pointer events (with pointer-events:none), then you won’t be able to select it using the element picker in DevTools, because it requires mouse interaction.
Well, in Chrome and Edge, there is a special trick you can do that few people know about. If you hold the Shift key while using the element picker, then even pointer-events:none elements become selectable.
The good news is that Firefox just implemented the same feature as well. The parity of features across different DevTools is always great news for users because it makes testing and debugging websites on multiple browsers a lot easier.
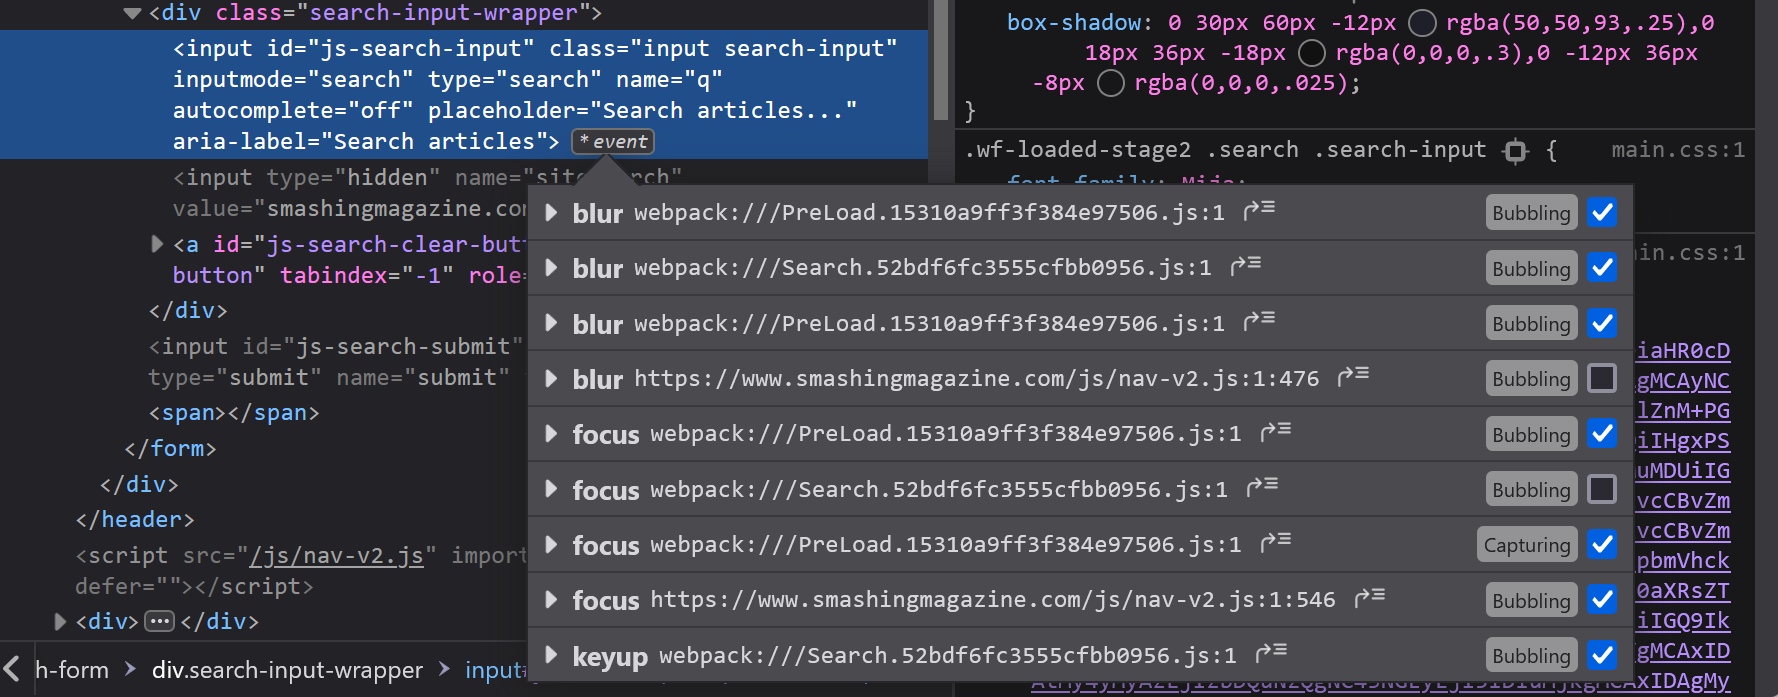
While we’re on the topic of parity, it’s worth also mentioning that Firefox just shipped a way to disable individual event listeners too.
In the Inspector panel, you can list event listeners attached to elements by clicking the [env] badges next to them. Now, the list of event listeners also contains checkboxes to toggle listeners.
Ignore Single Lines Of Code In The Debugger
If you spend time debugging JavaScript in DevTools on a large code base that uses frameworks and libraries, you might already be familiar with how to ignore source files. This feature lets you mark entire files as ignored so the debugger does pause within them.
This means you can mark a framework bundle file as ignored for example, and happily debug your own code without fear of stepping into the framework code.
While other browsers also support this feature too, Firefox is innovating with a really cool evolution of it: the ability to ignore ranges of lines within a file! Imagine, you have a utility function in a file that gets called all the time. It might be useful to mark just this function as ignored, and still be able to debug everything else in that file as normal. It may also come useful when using a bundler that groups all of your source code and libraries in the same file.
This feature is, at the time of writing, still experimental. You will need to set the devtools.debugger.features.blackbox-lines boolean to true on the about:config page first.
Once enabled, you can right-click on any line of your source code and choose Ignore line.
That’s It For Now!
I hope you enjoyed these updates, and that they’ll turn out useful when doing web development. As always, if you have feedback, bugs to report, or new feature ideas for DevTools, make yourself heard! It’s impressive to see how far the web platform debugging capabilities have come, and we all can help make it even better!
Further Reading
- Navigating The Challenges Of Modern Open-Source Authoring: Lessons Learned
- CTA Modal: How To Build A Web Component
- Overflow Issues In CSS
- Crowdfunding Web Platform Features With Open Prioritization


