A Guide To Audio Visualization With JavaScript And GSAP (Part 1)

Email Newsletter
Weekly tips on front-end & UX.
Trusted by 182,000+ folks.

 Custom Web Forms for Angular, React, & Vue. Your backend.
 Celebrating 10 million developers


A while back I got approached by friend Kent C. Dodds to help out with his site rebuild. Besides adding a little whimsy here and there, there was one part, in particular, Kent wanted a hand with. And that was audio visualization. One feature of Kent’s site is being able to “record a call” and then he’d respond via a podcast episode.
So today, we’re going to look at how you can visualize audio input with JavaScript. Although the output demos are in React, we aren’t going to dwell on the React side of things too much. The underlying techniques work with or without React. It’s the case that I needed to create this in React as Kent’s site uses Remix. We’ll focus on how you capture audio from a user and what you can do with that data.
Note: To see the demos in action, you’ll need to open and test directly them on the CodePen website. Enjoy!
Where do we start? Well, Kent kindly had a starting point already up and running for me. You can try it out here in this CodePen example:
See the Pen [1. Kent’s Starting Point](https://codepen.io/smashingmag/pen/MWOZgWb) by jh3y.
You’re able to choose your input device and start recording your audio. And you’ll see a pretty cool audio wave visualization. You can pause and stop your recording and re-record. In fact, Kent set up a lot of the functionality here for me using XState (XState is another article in itself).
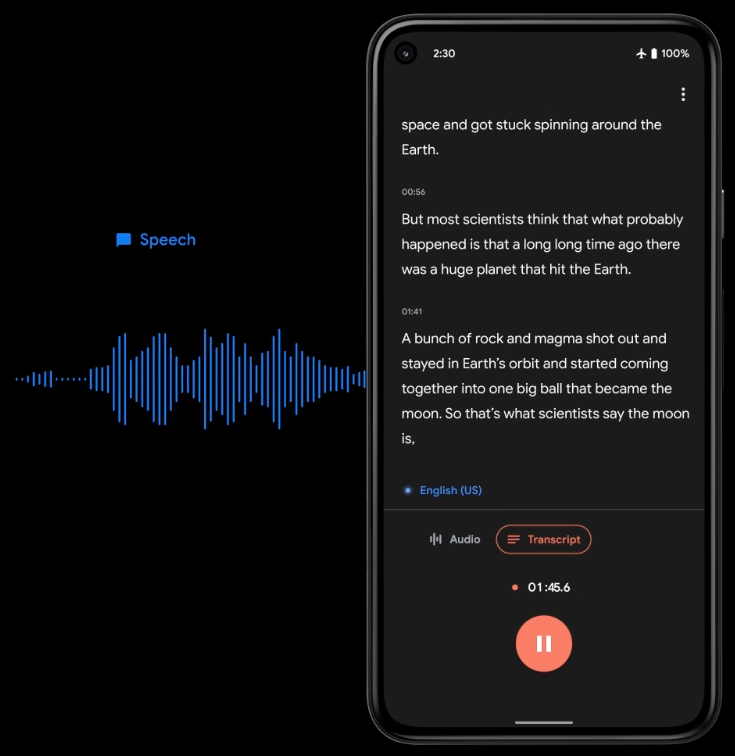
But, the part he wasn’t satisfied with was the visualization. He wanted an audio visualization like those on Zencastr or Google Recorder. The side-scrolling audio bars style. To be honest, this is actually nicer to work with for reasons we will mention later.
Before we begin to create that visualization, let’s break down that starting point.
Now, in the starting point, Kent uses XState to process the different states of the audio recorder. But, we can cherry-pick the important parts you need to know. The main API at play is the MediaRecorder API and using navigator.mediaDevices.
Let’s start with navigator.mediaDevices. This gives us access to any connected media devices like webcams and microphones. In the demo, we are filtering and returning the audio inputs returned from enumerateDevices. These are then stored in the demo state and shown as buttons if we choose to change from the default audio input. If we choose to use a different device from the default, this gets stored in the demo state.
getDevices: async () => {
  const devices = await navigator.mediaDevices.enumerateDevices();
  return devices.filter(({ kind }) => kind === "audioinput");
},
Once we have an audio input device, it’s time to set up a MediaRecorder so we can capture that audio. Setting up a new MediaRecorder requires a MediaStream which we can get using navigator.mediaDevices.
// deviceId is stored in state if we chose something other than default
// We got that list of devices from "enumerateDevices"
const audio = deviceId ? { deviceId: { exact: deviceId } } : true;
const stream = await navigator.mediaDevices.getUserMedia({ audio })
const recorder = new MediaRecorder(stream)
By passing audio: true to getUserMedia, we are falling back to using the “default” audio input device. But, we can pass a specific deviceId if we want to use a different device.
Once we’ve created a MediaRecorder, we’re good to go! We have a MediaRecorder instance and access to a few self-explanatory methods.
startstoppauseresume
That’s all good but we need to do something with the data that’s recorded. To handle this data, we are going to create an Array to store the “chunks” of audio data.
const chunks = []
And then we are going to push chunks to that Array when data is available. To hook into that event, we use ondataavailable. This event fires when the MediaStream gets stopped or ends.
recorder.ondataavailable = event => {
  chunks.push(event.data)
}
Note: The MediaRecorder can provide its current state with the state property. Where the state can be paused, inactive, or paused. This is useful for making interaction decisions in the UI.
There is one final thing we need to do. When we stop the recording, we need to create an audio Blob. This will be the mp3 of our audio recording. In our demo, the audio blob gets stored in the demo state handled with XState. But, the important part is this part.
new Blob(chunks, { type: 'audio/mp3' })
With this Blob, we are able to playback our audio recording using an audio element.
Check out this demo where all the React and XState code gets stripped out. This is all we need to record audio with the default audio input device.
const TOGGLE = document.querySelector('#toggle')
const AUDIO = document.querySelector('audio')

let recorder
const RECORD = () => {
  const toggleRecording = async () => {
    if (!recorder) {
      // Reset the audio tag
      AUDIO.removeAttribute('src')
      const CHUNKS = []
      const MEDIA_STREAM = await window.navigator.mediaDevices.getUserMedia({
        audio: true
      })
      recorder = new MediaRecorder(MEDIA_STREAM)
      recorder.ondataavailable = event => {
        // Update the UI
        TOGGLE.innerText = 'Start Recording'
        recorder = null
        // Create the blob and show an audio element
        CHUNKS.push(event.data)
        const AUDIO_BLOB = new Blob(CHUNKS, {type: "audio/mp3"})
        AUDIO.setAttribute('src', window.URL.createObjectURL(AUDIO_BLOB))
      }
      TOGGLE.innerText = 'Stop Recording'
      recorder.start()
    } else {
      recorder.stop()
    }
  }
  toggleRecording()
}

TOGGLE.addEventListener('click', RECORD)
See the Pen [2. Barebones Audio Input](https://codepen.io/smashingmag/pen/rNYoNMQ) by jh3y.
Note: For a more in-depth look at setting up the MediaRecorder and using it, check out this MDN article: “Using the MediaStream Recording API”.
Visualization ✨
Right. Now we have an idea about how to record audio input from our users, we can get onto the fun stuff! Without any visualization, our audio recording UI isn’t very engaging. Also, nothing indicates to the user that the recording is working. Even a pulsing red circle would be better than nothing! But, we can do better than that.
For our audio visualization, we are going to use HTML5 Canvas. But, before we get to that stage, we need to understand how to take the real-time audio data and make it usable. Once we create our MediaRecorder, we can access its MediaStream with the stream property.
Once we have a MediaStream, we want to analyze it using the AudioContext API.
const STREAM = recorder.stream
const CONTEXT = new AudioContext() // Close it later
const ANALYSER = CONTEXT.createAnalyser() // Disconnect the analyser
const SOURCE = CONTEXT.createMediaStreamSource(STREAM) // disconnect the source

SOURCE.connect(ANALYSER)
We start by creating a new AudioContext. Then, we create an AnalyserNode. This is what allows us to access audio time and frequency data. The last thing we need is a source to connect to. We can use createMediaStreamSource to create a MediaStreamAudioSourceNode. The last thing to do is connect this node to the analyzer making it the input for the analyzer.
Now we’ve got that boilerplate set up, we can start playing with real-time data. To do this we can use window.requestAnimationFrame to collect data from the analyzer. This means that we will be able to process the data generally in line with our display’s refresh rate.
On each analysis, we grab the analyzer data and use getByteFrequencyData. That method allows us to copy the data into a Uint8Array that’s the size of the frequencyBinCount. What’s the frequencyBinCount? It’s a read-only property that’s half the value of the analyzer’s fftSize. What’s the fftSize? I’m not a sound engineer by any means. But, think of this as the number of samples taken when obtaining the data. The fftSize must be a power of 2 and by default is 2048(Remember that game? Possible future article?). That means each time we call getByteFrequencyData, we get 2048 frequency data samples. And that means we get around 1024 values to play with for our visualization ✨
Note :You may have noticed in Kent’s starting point, we use getByteTimeDomainData. This is because the original demo uses a waveform visualization. getByteTimeDomainData will return waveform(time-domain) data. Whereas getByteFrequencyData returns the decibel values for frequencies in a sample. This is more appropriate for equalizer style visualizations where we visualize input volume.
OK. So what does the code look like for processing our frequency data? Let’s dig in. We can separate the concerns here by creating a function that takes a MediaStream.
const ANALYSE = stream => {
  // Create an AudioContext
  const CONTEXT = new AudioContext()
  // Create the Analyser
  const ANALYSER = CONTEXT.createAnalyser()
  // Connect a media stream source to connect to the analyser
  const SOURCE = CONTEXT.createMediaStreamSource(stream)
  // Create a Uint8Array based on the frequencyBinCount(fftSize / 2)
  const DATA_ARR = new Uint8Array(ANALYSER.frequencyBinCount)
  // Connect the analyser
  SOURCE.connect(ANALYSER)
  // REPORT is a function run on each animation frame until recording === false
  const REPORT = () => {
    // Copy the frequency data into DATA_ARR
    ANALYSER.getByteFrequencyData(DATA_ARR)
    // If we are still recording, run REPORT again in the next available frame
    if (recorder) requestAnimationFrame(REPORT)
    else {
      // Else, close the context and tear it down.
      CONTEXT.close()
    }
  }
  // Initiate reporting
  REPORT()
}
That’s the boilerplate we need to start playing with the audio data. But, this currently doesn’t do much apart from running in the background. You could throw a console.info or debugger in REPORT to see what’s happening.
See the Pen [3. Sampling Input Data](https://codepen.io/smashingmag/pen/PoOXoWp) by jh3y.
The eagle-eyed may have noticed something. Even when we stop recording, the recording icon remains in our browser tab. This isn’t ideal. Even though the MediaRecorder gets stopped, the MediaStream is still active. We need to stop all available tracks on stop.
// Tear down after recording.
recorder.stream.getTracks().forEach(t => t.stop())
recorder = null
We can add this into the ondataavailable callback function we defined earlier.
Almost there. It’s time to convert our frequency data into a volume and visualize it. Let’s start by displaying the volume in a readable format to the user.
const REPORT = () => {
  ANALYSER.getByteFrequencyData(DATA_ARR)
  const VOLUME = Math.floor((Math.max(...DATA_ARR) / 255) * 100)
  LABEL.innerText = `${VOLUME}%`
  if (recorder) requestAnimationFrame(REPORT)
  else {
    CONTEXT.close()
    LABEL.innerText = '0%'
  }
}
Why do we divide the greatest value by 255. Because that’s the scale of frequency data returned by getByteFrequencyData. Each value in our sample can be from 0 to 255.
Well done! You’ve created your first audio visualization 🎉 Once you get past the boilerplate code, there isn’t much code required to start playing.
See the Pen [4. Processing Data](https://codepen.io/smashingmag/pen/LYOMYyY) by jh3y.
Let’s start making this more “fancy”. 💅
We’re going to bring GSAP into the mix. This brings with it a variety of benefits. The great thing with GSAP is that it’s much more than animating visual things. It’s about animating values and also provides so many great utilities. If you’ve not seen GSAP before, do not worry. We will walk through what it’s doing here.
Let’s update our demo by making our label scale in size based on the volume. At the same time, we can change the color by animating a CSS custom property value.
let recorder
let report
let audioContext

const CONFIG = {
  DURATION: 0.1,
}

const ANALYSE = stream => {
  audioContext = new AudioContext()
  const ANALYSER = audioContext.createAnalyser()
  const SOURCE = audioContext.createMediaStreamSource(stream)
  const DATA_ARR = new Uint8Array(ANALYSER.frequencyBinCount)
  SOURCE.connect(ANALYSER)
  report = () => {
    ANALYSER.getByteFrequencyData(DATA_ARR)
    const VOLUME = Math.floor((Math.max(...DATA_ARR) / 255) * 100)
    LABEL.innerText = `${VOLUME}%`
    gsap.to(LABEL, {
      scale: 1 + ((VOLUME * 2) / 100),
      '--hue': 100 - VOLUME,
      duration: CONFIG.DURATION,
    })
  }
  gsap.ticker.add(report)
}
On each frame of our GSAP code, is animating our LABEL element using gsap.to. We are telling GSAP to animate the scale and --hue of the element with a configured duration.
gsap.to(LABEL, {
  scale: 1 + ((VOLUME * 2) / 100),
  '--hue': 100 - VOLUME,
  duration: CONFIG.DURATION,
})
You’ll also notice requestAnimationFrame is gone. If you’re going to use GSAP for anything that uses animation frames. It’s worth switching to using GSAP’s own utility functions. This is applicable for HTML Canvas(We’ll get to this), Three JS, etc.
GSAP provides ticker which is a great wrapper for requestAnimationFrame. It runs in sync with the GSAP engine and has a nice concise API. It also provides neat features like being able to update the frame rate. That can get complex if you’re writing it yourself and if you’re using GSAP, you should use the tools it provides.
gsap.ticker.add(REPORT) // Adds the reporting function for each frame
gsap.ticker.remove(REPORT) // Stops running REPORT on each frame
gsap.ticker.fps(24) // Would update our frames to run at 24fps (Cinematic)
Now, we have a more interesting visualization demo and the code is cleaner with GSAP.
You may also be wondering where the teardown code has gone. We’ve moved that into RECORD’s else. This will make it easier later on if we choose to animate things after we finish a recording. For example, returning an element to its initial state. We could introduce state values to track if necessary.
const RECORD = () => {
  const toggleRecording = async () => {
    if (!recorder) {
      // Set up recording code...
    } else {
      recorder.stop()
      LABEL.innerText = '0%'
      gsap.to(LABEL, {
        duration: CONFIG.DURATION,
        scale: 1,
        hue: 100,
        onComplete: () => {
          gsap.ticker.remove(report)
          audioContext.close()
        }
      })
    }
  }
  toggleRecording()
}
When we teardown, we animate our label to its original state. And using the onComplete method, we can remove our report function from the ticker. At the same time, we can close our AudioContext.
See the Pen [5. Getting “fancy” with GSAP](https://codepen.io/smashingmag/pen/yLPGLbq) by jh3y.
To make the EQ bars visualization we need to start using HTML Canvas. Do not fear if you have no Canvas experience. We’ll walk through the basics of rendering shapes and how to use GreenSock with our canvas. In fact, we’re going to build some basic visualizations first.
Let’s start with a canvas element.
<canvas></canvas>
To render things on a canvas, we need to grab a drawing context which is what we draw onto. We also need to define a size for our canvas. By default, they get a size of 300 by 150 pixels. The interesting thing is that the canvas has two sizes. It has its “physical” size and its “canvas” size. For example, we could have a canvas that has a physical size of 300 by 150 pixels. But, the drawing “canvas” size is 100 by 100 pixels. Have a play with this demo that draws a red square 40 by 40 pixels in the center of a canvas.
See the Pen [6. Adjusting Physical and Canvas Sizing for Canvas](https://codepen.io/smashingmag/pen/QWOzWgm) by jh3y.
How do we draw things onto a canvas? Take the demo above and consider a canvas that’s 200 by 200 pixels.
// Grab our canvas
const CANVAS = document.querySelector('canvas')
// Set the canvas size
CANVAS.width = 200
CANVAS.height = 200
// Grab the canvas context
const CONTEXT = CANVAS.getContext('2d')
// Clear the entire canvas with a rectangle of size "CANVAS.width" by "CANVAS.height"
// starting at (0, 0)
CONTEXT.clearRect(0, 0, CANVAS.width, CANVAS.height)
// Set fill color to "red"
CONTEXT.fillStyle = 'red'
// Fill rectangle at (80, 80) with width and height of 40
CONTEXT.fillRect(80, 80, 40, 40)
We start by setting the canvas size and getting the context. Then using the context we use fillRect to draw a square at the given coordinates. The coordinate system in canvas starts at the top left corner. So [0, 0] is the top left. For our canvas, [200, 200] would be the bottom right corner.
For our square, the coordinates are half the canvas width and height minus half of the square size.
// Canvas Width/Height = 200
// Square Size = 40
CONTEXT.fillRect((200 / 2) - (40 / 2), (200 / 2) - (40 / 2), 40, 40)
This will draw our square in the center.
context.fillRect(x, y, width, height)
As we start with a blank canvas, clearRect isn’t necessary. But, each time we draw to a canvas, it doesn’t clear for us. With animations, it’s likely things will move. So clearing the entire canvas before we draw to it again is a good way to approach things.
Consider this demo that animates a square from side to side. Try turning clearRect on and off to see what happens. Not clearing the canvas in some scenarios can produce some cool effects.
See the Pen [7. Clearing a Canvas each frame](https://codepen.io/smashingmag/pen/MWOZWBL) by jh3y.
Now we have a basic idea of drawing things to canvas, let’s put it together with GSAP to visualize our audio data. We’re going to visualize a square that changes color and size as our label did.
We can start by getting rid of our label and creating a canvas. Then in JavaScript land, we need to grab that canvas and its rendering context. Then we can set the size of the canvas to match its physical size.
const CANVAS = document.querySelector('canvas')
const CONTEXT = CANVAS.getContext('2d')
// Match canvas size to physical size
CANVAS.width = CANVAS.height = CANVAS.offsetHeight
We need an Object to represent our square. It’s going to define the size, hue, and scale of the square. Remember how we mentioned GSAP is great because it animates values? This is going to come into play very soon.
const SQUARE = {
  hue: 100,
  scale: 1,
  size: 40,
}
To draw our square, we’re going to define a function that keeps that code in one place. It clears the canvas and then renders the square in the center based on its current scale.
const drawSquare = () => {
  const SQUARE_SIZE = SQUARE.scale * SQUARE.size
  const SQUARE_POINT = CANVAS.width / 2 - SQUARE_SIZE / 2
  CONTEXT.clearRect(0, 0, CANVAS.width, CANVAS.height)
  CONTEXT.fillStyle = `hsl(${SQUARE.hue}, 80%, 50%)`
  CONTEXT.fillRect(SQUARE_POINT, SQUARE_POINT, SQUARE_SIZE, SQUARE_SIZE)
}
We render the square initially so that the canvas isn’t blank at the start:
drawSquare()
Now. Here comes the magic part. We only need code to animate our square values. We can update our report function to the following:
report = () => {
  if (recorder) {
    ANALYSER.getByteFrequencyData(DATA_ARR)
    const VOLUME = Math.max(...DATA_ARR) / 255
    gsap.to(SQUARE, {
      duration: CONFIG.duration,
      hue: gsap.utils.mapRange(0, 1, 100, 0)(VOLUME),
      scale: gsap.utils.mapRange(0, 1, 1, 5)(VOLUME)
    })
  }
  // render square
  drawSquare()
}
Regardless, report must render our square. But, if we are recording, we can visualize the calculated volume. Our volume value will be between 0 and 1. And we can use GSAP utils to map that value to a desired hue and scale range with mapRange.
There are different ways to process the volume in our audio data. For these demos, I’m using the largest value from the data Array for ease. An alternative could be to process the average reading by usingreduce.
For example:const VOLUME = Math.floor(((DATA_ARR.reduce((acc, a) => acc + a, 0) / DATA_ARR.length) / 255) * 100)
Once we finish recording, we animate the square values back to their original values.
gsap.to(SQUARE, {
  duration: CONFIG.duration,
  scale: 1,
  hue: 100,
  onComplete: () => {
    audioContext.close()
    gsap.ticker.remove(report)
  }
})
Make sure that you tear down report and the audioContext in your onComplete callback. Notice how the GSAP code is separate from the rendering code? That’s the awesome thing about using GSAP to animate Object values. Our function drawSquare runs every frame regardless. It doesn’t care what’s happening to the squares, it takes the values and renders the square. This means GSAP can adjust those values anywhere in our code. The updates will get rendered by drawSquare.
And here we have it! ✨ Our first GSAP visualization.
See the Pen [8. First Canvas Visualization ✨](https://codepen.io/smashingmag/pen/NWweWLM) by jh3y.
What if we extended that? How about creating a random square for each sample from our data? How might that look? It could look like this!
See the Pen [9. Randomly generated audio visualization 🚀](https://codepen.io/smashingmag/pen/podqoOQ) by jh3y.
In this demo, we use a smaller fftSize and create a square for each sample. Each square gets random characteristics and updates after each recording. This demo takes it a little further and allows you to update the sample size. That means you can have as many or as few squares as you’d like!
See the Pen [10. Random Audio Input Vizualisation w/ Configurable Sample Size ✨](https://codepen.io/smashingmag/pen/mdqadzm) by jh3y.
"Canvas Challenge
Could you recreate this random visualization but display circles instead of squares? How about different colors? Fork the demos and have a play with them. Reach out if you get stuck!"
So now we know how to visualize our audio input with HTML canvas using GSAP. But, before we go off on a tangent making randomly generated visualization, we need to get back to our brief!
We want to make EQ bars that move from right to left. We already have our audio input set up. All we need to do is change the way the visualization works. Instead of squares, we will work with bars. Each bar has an “x” position and will get centered on the “y” axis. Each bar gets a “size” that will be the height. The starting “x” position is going to be the furthest right of the canvas.
// Array to hold our bars
const BARS = []
// Create a new bar
const NEW_BAR = {
  x: CANVAS.width,
  size: VOLUME, // Volume for that frame
}
The difference between our previous visualizations and this one is that we need to add a new bar on each frame. This happens inside the ticker function. At the same time, we need to create a new animation for the values of that bar. One feature of our brief is that we need to be able to “pause” and “resume” a recording. Creating a new animation for each bar isn’t going to work in the same way. We need to create a timeline we can reference and then add animations to. Then we can pause and resume the bar animations all at once. We can tackle pausing the animation once we’ve got it working. Let’s start by updating our visualization.
Here’s some boilerplate for drawing our bars and variables we use to keep reference.
// Keep reference to GSAP timeline
let timeline = gsap.timeline()
// Generate Array for BARS
const BARS = []
// Define a Bar width on the canvas
const BAR_WIDTH = 4
// We can declare a fill style outside of the loop.
// Let’s start with red!
DRAWING_CONTEXT.fillStyle = 'red'
// Update our drawing function to draw a bar at the correct "x" accounting for width
// Render bar vertically centered
const drawBar = ({ x, size }) => {
  const POINT_X = x - BAR_WIDTH / 2
  const POINT_Y = CANVAS.height / 2 - size / 2
  DRAWING_CONTEXT.fillRect(POINT_X, POINT_Y, BAR_WIDTH, size)
}
// drawBars updated to iterate through new variables
const drawBars = () => {
  DRAWING_CONTEXT.clearRect(0, 0, CANVAS.width, CANVAS.height)
  for (const BAR of BARS) {
    drawBar(BAR)
  }
}
When we stop the recorder, we can clear our timeline for reuse. This depends on the desired behavior (More on this later):
timeline.clear()
The last thing to update is our reporting function:
REPORT = () => {
  if (recorder) {
    ANALYSER.getByteFrequencyData(DATA_ARR)
    const VOLUME = Math.floor((Math.max(...DATA_ARR) / 255) * 100)

    // At this point create a bar and have it added to the timeline
    const BAR = {
      x: CANVAS.width + BAR_WIDTH / 2,
      size: gsap.utils.mapRange(0, 100, 5, CANVAS.height * 0.8)(VOLUME)
    }
    // Add to bars Array
    BARS.push(BAR)
    // Add the bar animation to the timeline
    timeline
      .to(BAR, {
        x: `-=${CANVAS.width + BAR_WIDTH}`,
        ease: 'none'
        duration: CONFIG.duration,
      })
  }
  if (recorder || visualizing) {
    drawBars()
  }
}
How does that look?
See the Pen [11. Attempting EQ Bars](https://codepen.io/smashingmag/pen/qBVLBQb) by jh3y.
Completely wrong… But why? Well. At the moment we are adding a new animation on each frame to our timeline. But, these animations run in sequence. One bar must finish before the next proceeds which isn’t what we want. Our issue is related to timing. And our timing needs to be relative to the size of our canvas. That way, if the size of our canvas changes, the animation will still look the same.
Note: Our visuals will get distorted if our canvas has a responsive size and gets resized. Although it is possible to update on resize, it’s quite complex. We won’t dig into that today.
Much like we defined a BAR_WIDTH, we can define some other config for our visualization. For example, the min and max height of a bar. We can base that on the height of the canvas.
const VIZ_CONFIG = {
  bar: {
    width: 4,
    min_height: 0.04,
    max_height: 0.8
  }
}
But, what we need is to decide how many pixels our bars will move per second. Let’s say we make a bar move of 100 pixels per second. That means our next bar can enter 4 pixels later. And in time, that’s 1 / 100 * 4 seconds.
const BAR_WIDTH = 4
const PIXELS_PER_SECOND = 100
const VIZ_CONFIG = {
  bar: {
    width: 4,
    min_height: 0.04,
    max_height: 0.8
  },
  pixelsPerSecond: PIXELS_PER_SECOND,
  barDelay: (1 / PIXELS_PER_SECOND) * BAR_WIDTH,
}
With GSAP, we can insert an animation into the timeline at a given timestamp. It’s an optional second parameter of add. If we know the index of the bar we are adding, that means we can calculate the timestamp for insertion.
timeline
  .to(BAR,
    {
      x: `-=${CANVAS.width + VIZ_CONFIG.bar.width}`,
      ease: 'none',
      // Duration will be the same for all bars
      duration: CANVAS.width / VIZ_CONFIG.pixelsPerSecond,
    },
    // Time to insert the animation. Based on the new BARS length.
    BARS.length * VIZ_CONFIG.barDelay
  )
How does that look?
See the Pen [12. Getting Closer](https://codepen.io/smashingmag/pen/KKybKrr) by jh3y.
It’s much better. But it’s still way off. It’s too delayed and not in sync enough with our input. And that’s because we need to be more precise with our calculations. We need to base the timing on the actual frame rate of our animation. This is where gsap.ticker.fps can play a part. Remember gsap.ticker is the heartbeat of what is happening in GSAP land.
gsap.ticker.fps(DESIRED_FPS)If we’ve defined the “desired” fps, the actual duration for a bar to move can get calculated. And we can base it on how much we want a bar to move before the next one enters. We calculate precise “Pixels per second”:
(Bar Width + Bar Gap) * FpsFor example, if we have an fps of 50, a bar width of 4, and a gap of 0.
(4 + 0) * 50 === 200Our bars need to move at 200 pixels per second. The duration of the animation can then get calculated based on the canvas width.
Note: It’s worth picking an FPS that you know your users will be able to use. For example, some screens might only operate at 30 frames per second. A mere 24 frames per second gets considered as the “cinematic” feel.
An updated demo gives us the desired effect! 🚀
See the Pen [13. Dialling the timing and gap](https://codepen.io/smashingmag/pen/Vwrqwqm) by jh3y.
You can tinker with the timings and how your EQ bars move across the canvas to get the desired effect. For this particular project, we were looking for as close to real-time as possible. You could group bars and average them out for example if you wanted. There are so many possibilities.
You may have noticed that our bars have also changed color and we now have this gradient effect. This is because we’ve updated the fillStyle to use a linearGradient. The neat thing about fill styles in Canvas is that we can apply a blanket style to the canvas. Our gradient covers the entirety of the canvas. This means the bigger the bar (louder the input), the more the color will change.
const fillStyle = DRAWING_CONTEXT.createLinearGradient(
  CANVAS.width / 2,
  0,
  CANVAS.width / 2,
  CANVAS.height
)
// Color stop is two colors
fillStyle.addColorStop(0.2, 'hsl(10, 80%, 50%)')
fillStyle.addColorStop(0.8, 'hsl(10, 80%, 50%)')
fillStyle.addColorStop(0.5, 'hsl(120, 80%, 50%)')

DRAWING_CONTEXT.fillStyle = fillStyle
Now we’re getting somewhere with our EQ bars. This demo allows you to change the behavior of the visualization updating the bar width and gap:
See the Pen [14. Configurable Timing](https://codepen.io/smashingmag/pen/BamvavY) by jh3y.
If you play with this demo, you may find ways to break the animation. For example, if you choose a framerate higher than that on your device. It’s all about how accurate we can get our timing. Opting for a lower framerate tends to be more reliable.
At a high level, you now have the tools required to make audio visualizations from user input. In Part 2 of this series, I’ll explain how you can add features and any extra touches you like. Stay tuned for next week!
Further Reading
- The Forensics Of React Server Components (RSCs)
- Integrations: From Simple Data Transfer To Modern Composable Architectures
- Creating An Effective Multistep Form For Better User Experience
- Transitioning Top-Layer Entries And The Display Property In CSS


