What’s New In DevTools: Halloween Edition 🎃

Email Newsletter
Weekly tips on front-end & UX.
Trusted by 182,000+ folks.


 Celebrating 10 million developers

 Custom Web Forms for Angular, React, & Vue. Your backend.
I can’t believe it’s already been nine months since I last wrote about the new DevTools features across browsers! You folks are due for an update. And what an update this is going to be!
Our friendly DevTools teams at Mozilla, Google, Microsoft, and Apple have once again been hard at work. And in this article, I’ll attempt to summarize the most impactful new features that are now available in browser developer tools.
So much has happened over these past few months that I may have missed a few things, but hopefully, you’ll find something that helps you in this article. There should be a little bit for everyone, whatever your level of experience with web development is, and whatever browser you use.
So, without further ado, let’s jump right in.
Note: Because Edge is based on Chromium, the open-source browser engine that also powers Chrome, all of the Chrome features listed below are also available in Edge (unless otherwise noted).
CSS Debugging
We’ve got a lot of long-awaited and profoundly impacting new features in CSS lately.
To name just a few:
- Container Queries help us style components based on the size of their containers,
- The
:has()pseudo-class lets us style elements based on what they contain, and - CSS Cascade Layers make it easy to gracefully handle increasing complexity in our websites’ code.
But, although these features are amazing, shipping support for them in browsers is only part of the story. For people to comfortably use them, documentation and tooling are necessary too.
We’re in luck because both Container Queries and CSS Cascade Layers have associated DevTools features now.
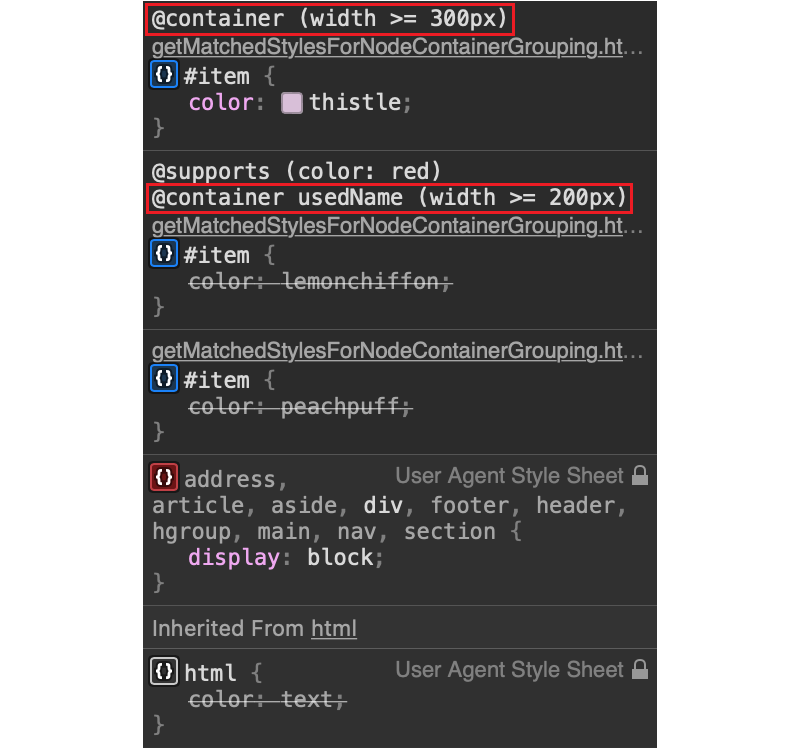
Specifically, Container Queries are supported in Safari WebInspector and Chrome DevTools where information about the corresponding @container at-rules is displayed when viewing CSS in the Styles sidebar.
Here is an example in Safari WebInspector:
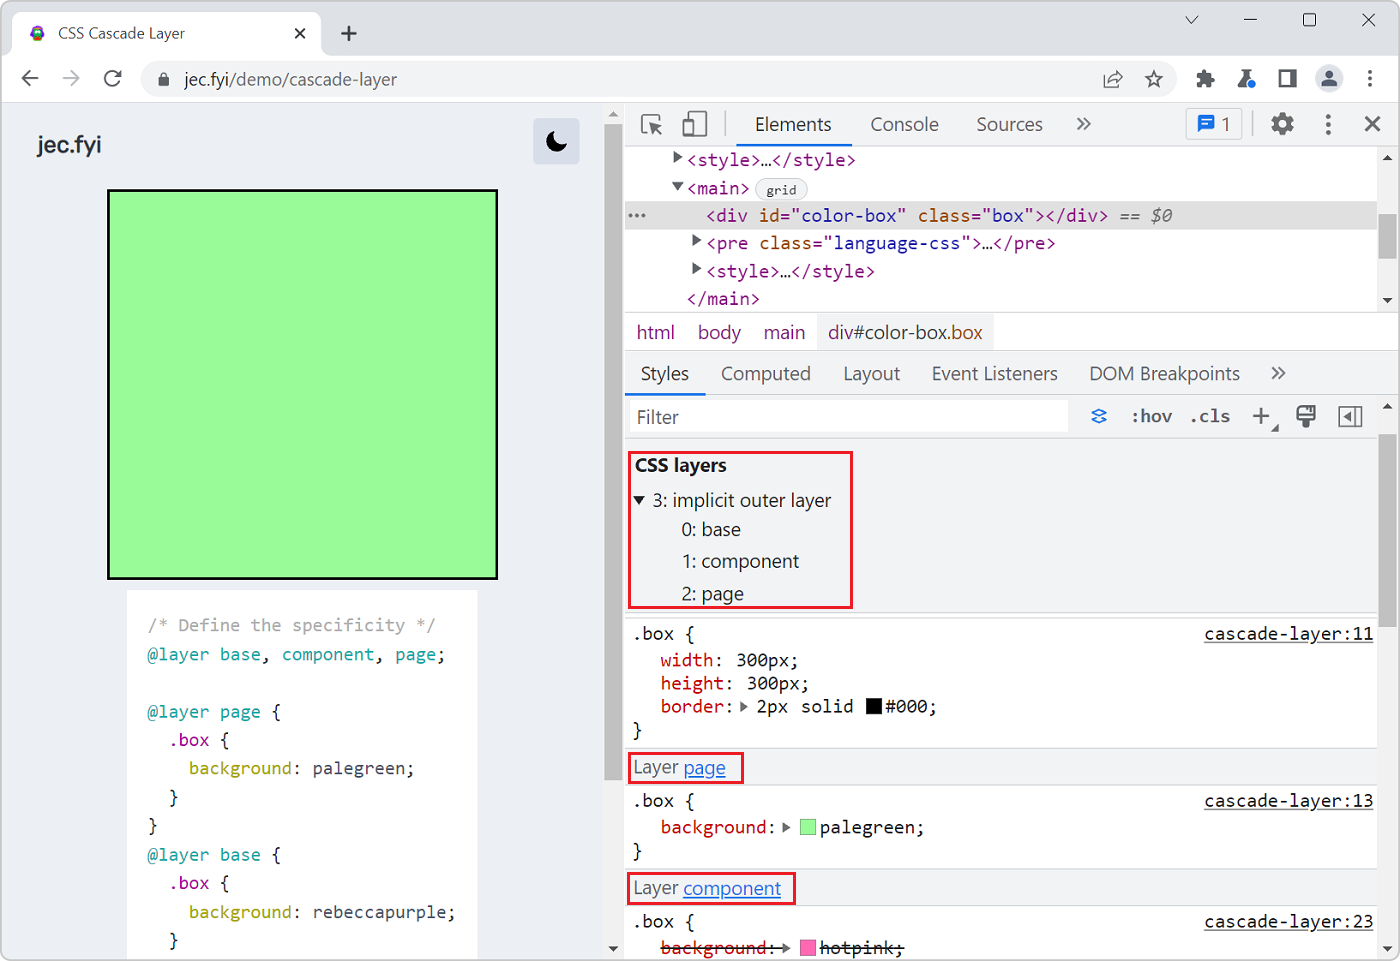
Chrome, Safari, and Firefox DevTools also now have support for CSS Cascade layers in their Elements (or Inspector) tools. The layer to which a particular rule belongs is now displayed next to that rule:
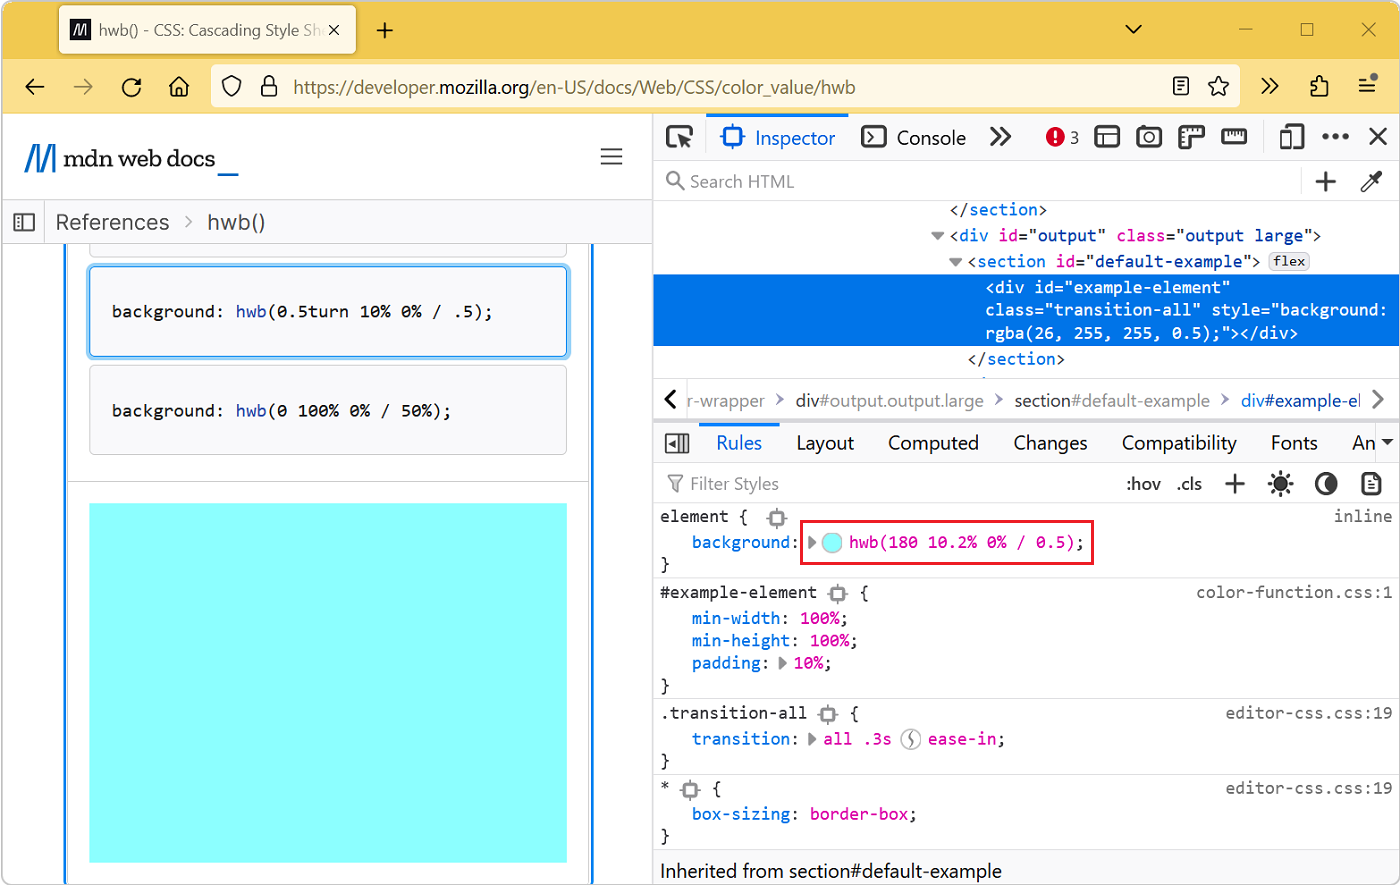
Maybe a little less popular, but still very useful, the hwb() CSS function makes it possible to express colors in a more natural way based on hue and an amount of whiteness and blackness.
hwb() is now supported in all major browsers, and Chrome (and Chromium-based browsers), as well as Firefox, both have support for it in DevTools. That means they will show hwb in the autocomplete list when editing CSS in the Styles (or Rules) sidebar and will show the same color swatch used for other color formats too.
Next, it has also become easier to edit CSS in the Styles sidebar and get meaningful autocompletion results across browsers.
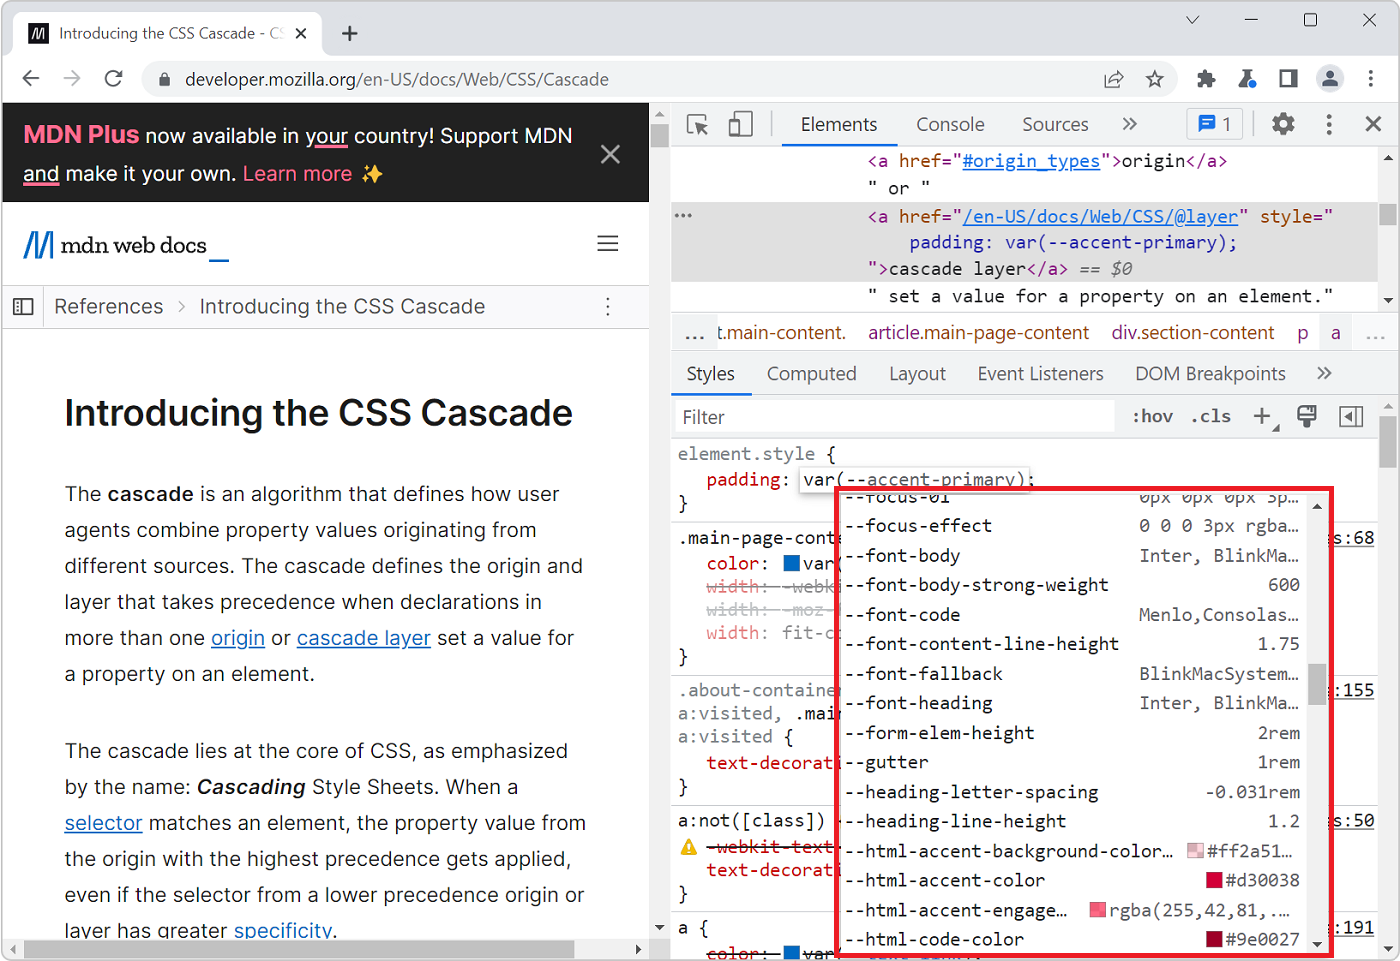
Chrome now previews all CSS variable values when autocompleting the var() function, not just colors, and it also displays @supports and @scope at-rules.
Safari now uses fuzzy matching when auto-completing CSS, making it much faster to type property names and values.
And Firefox added support for the color-mix() function in its auto-complete too.
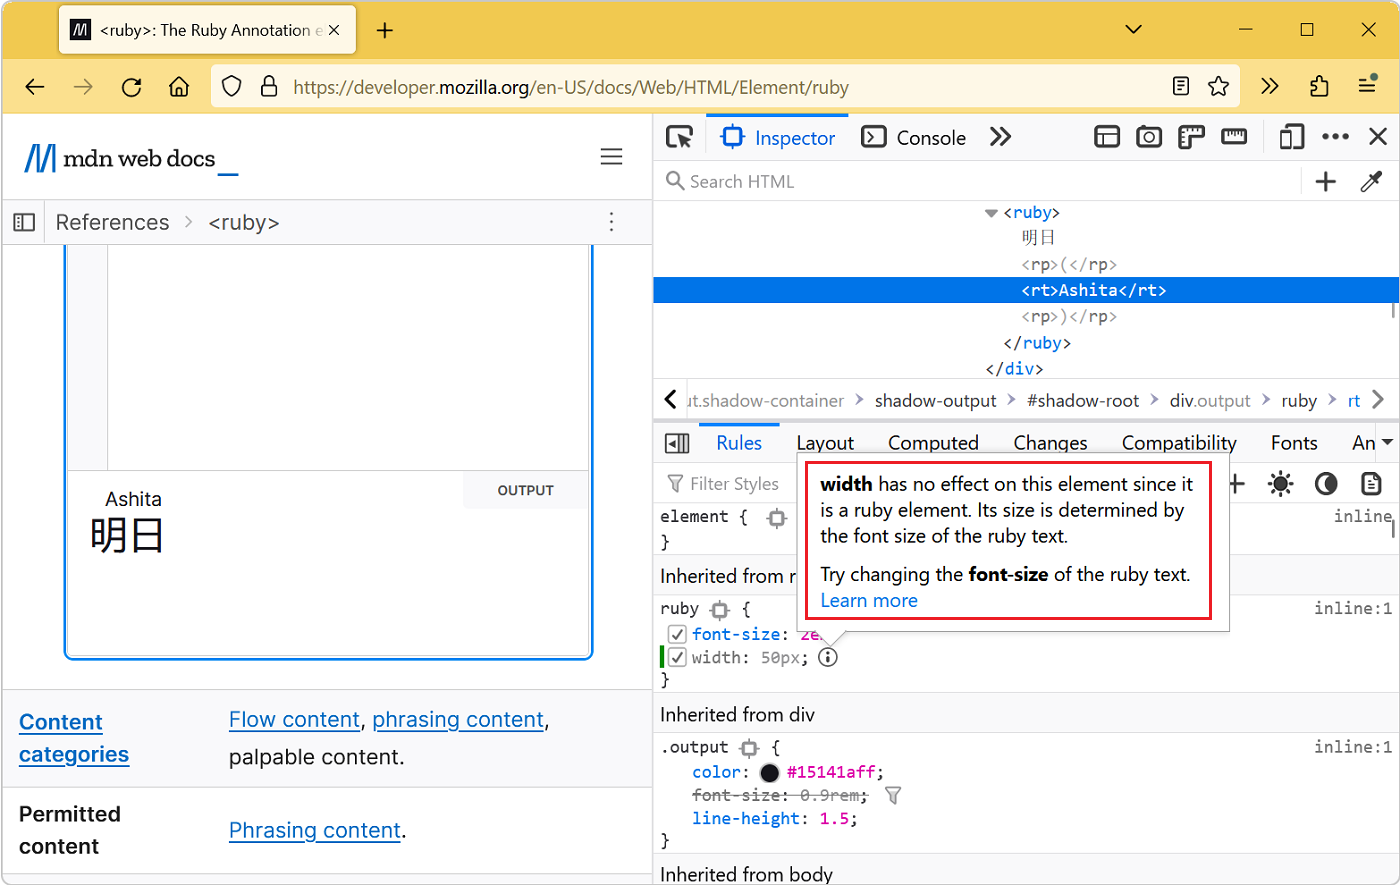
Talking about Firefox, the browser has had the amazing Inactive CSS feature since 2019, which lets you know when a particular CSS declaration doesn’t have an impact on the current element.
Firefox continued to improve this feature over time and recently added more coverage for use cases such as warning when border-image-* is used on elements within a table with border-collapse or warning when width or height are used on ruby elements.
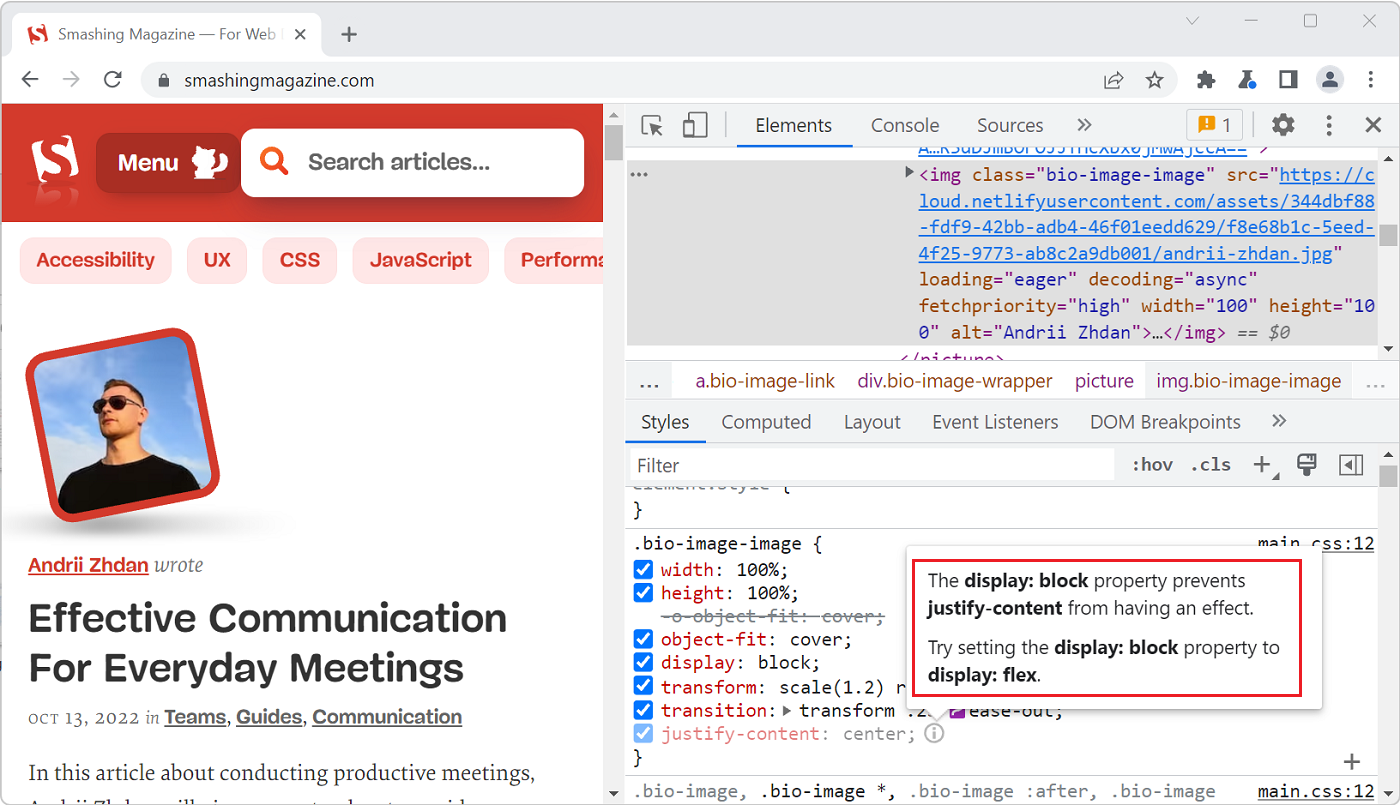
And, while we’re on the topic of inactive CSS, the Chrome team is actually working on a similar feature. In fact, it’s already available in Chrome (and all Chromium-based browsers) by enabling the CSS authoring hints experiment under Settings (F1) > Experiments in DevTools and should become available by default with Chrome 108.
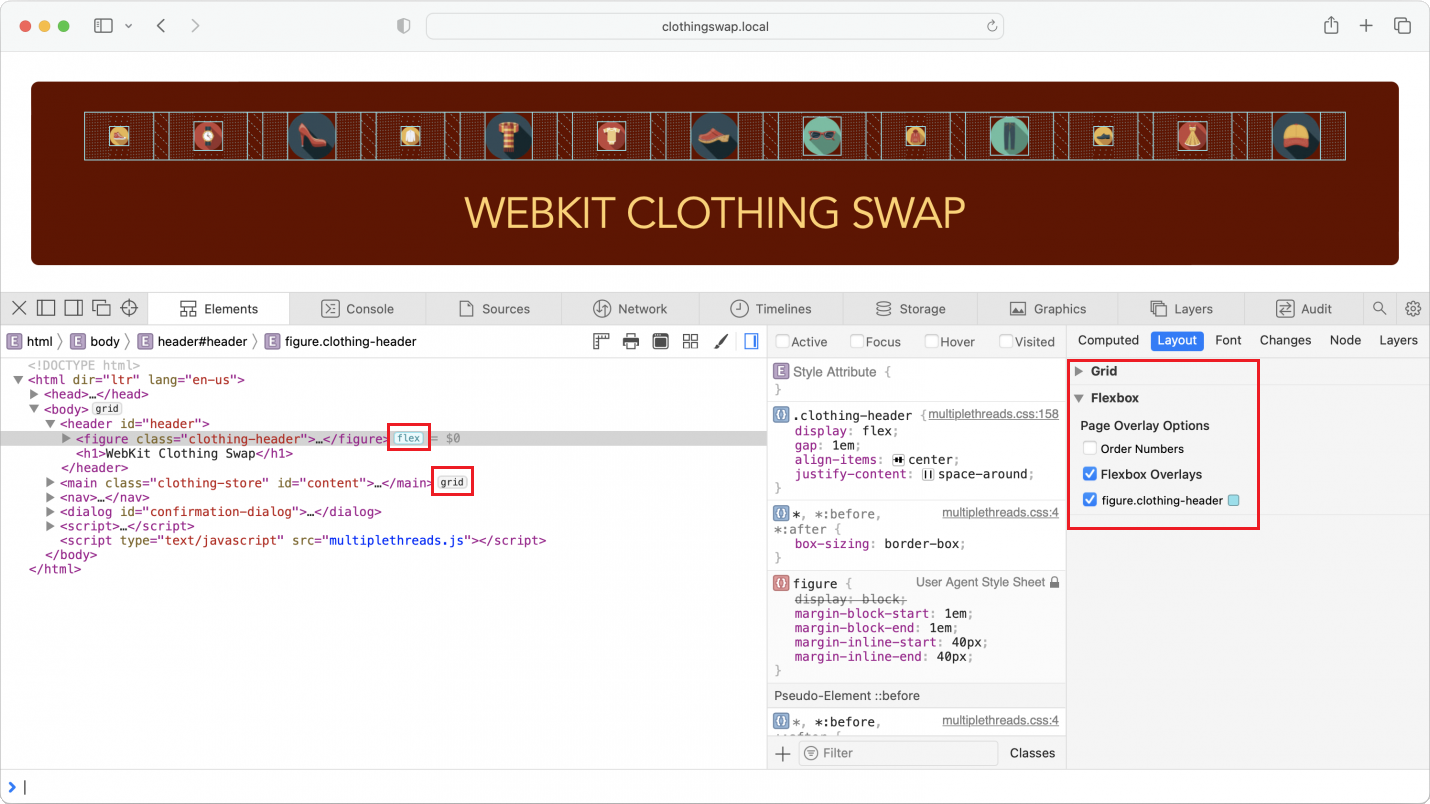
Over the past few years, browser DevTools has gotten fantastic layout debugging tools to inspect, understand, and tweak grid and flex layouts. More recently, Safari has been adding more features in this area as well.
You can now use CSS alignment controls in the Styles sidebar and inspect Flexbox layouts too.
JavaScript Debugging
Let’s change gears a bit and talk about JavaScript debugging.
It’s very common to use external libraries and frameworks in a JavaScript codebase, to avoid having to re-implement things that have already been solved. For some years already, DevTools have allowed users to ignore third-party scripts when debugging (see docs for Chrome, Edge, Firefox).
Hiding scripts makes it easier to debug your code. It avoids ending up in foreign-looking library code when stepping through your own logic.
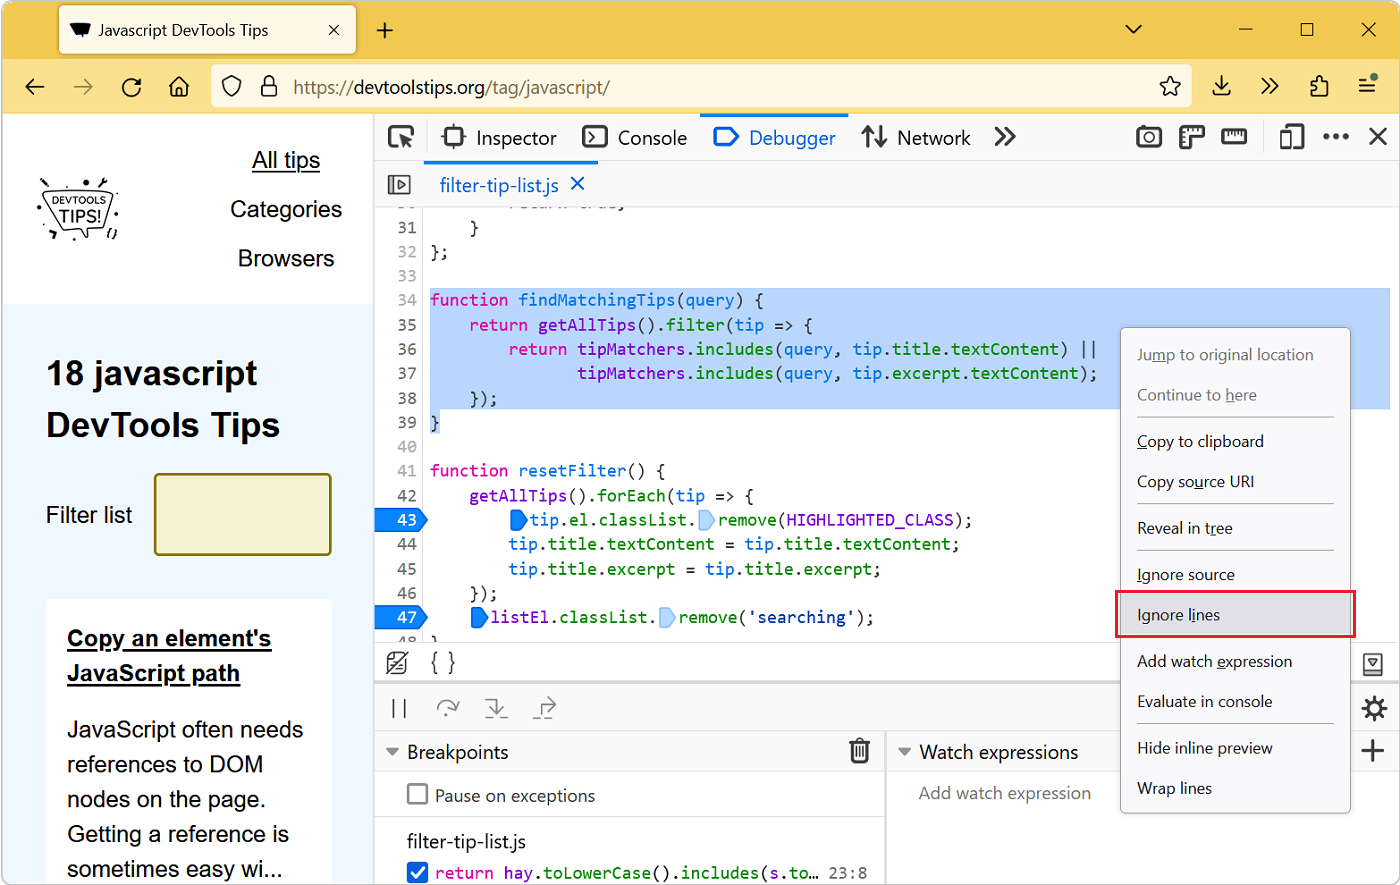
Recently, Firefox shipped a new feature that builds on top of this. You can now ignore pieces of code within a file. If you have a function that keeps getting called all the time but isn’t interesting for what you’re trying to debug, you can simply ignore that one function now.
Over in Chrome (and Chromium), a whole lot of small and not-so-small JavaScript debugging improvements were made:
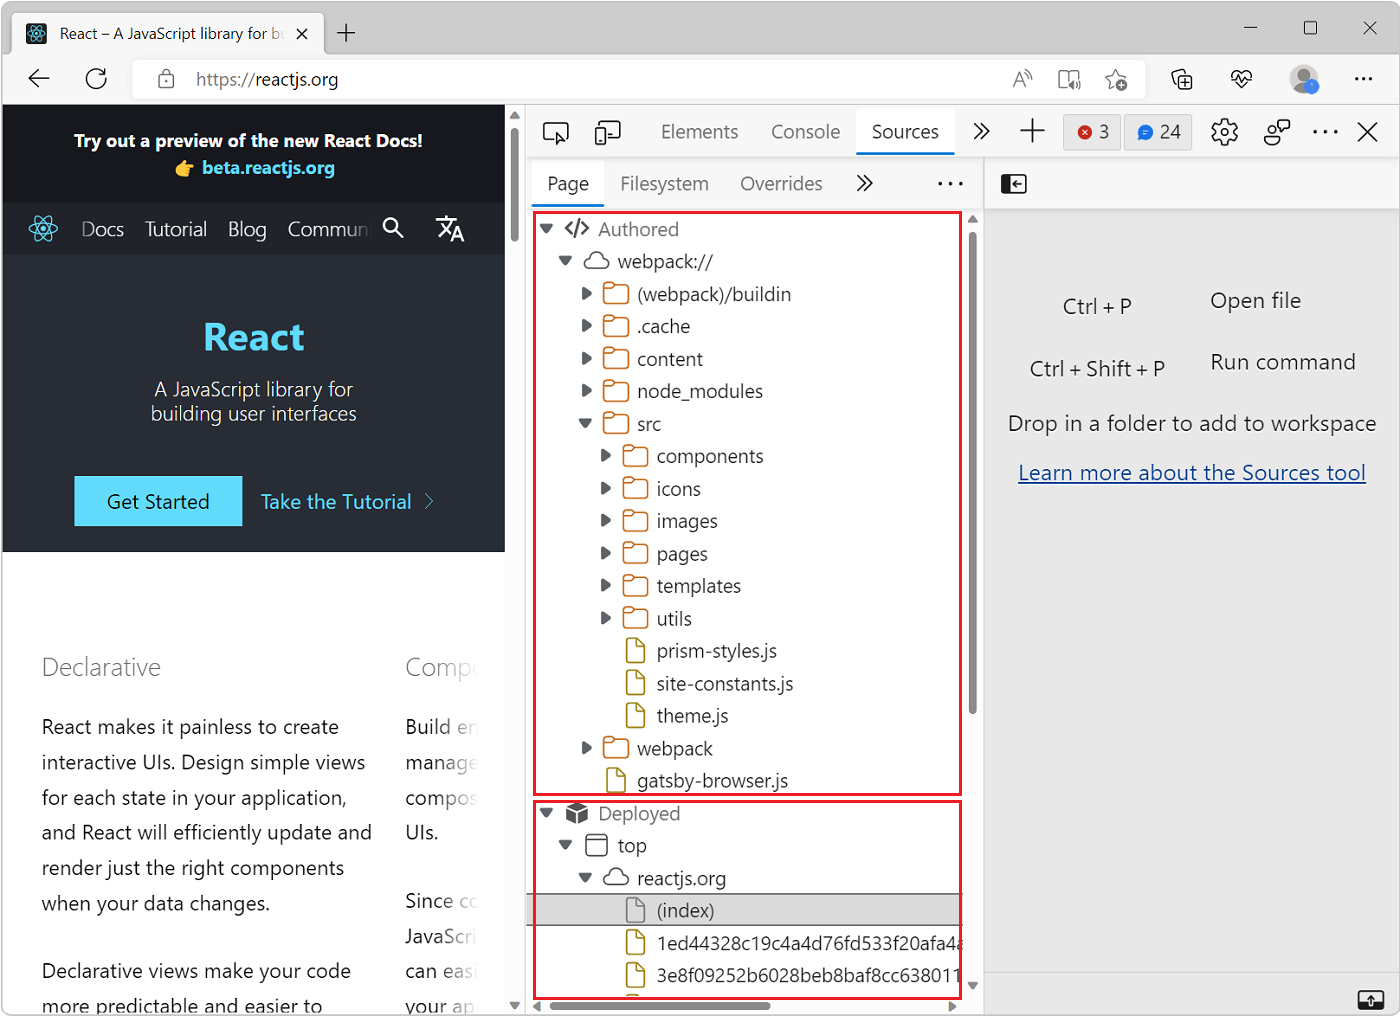
The Page source tree was improved, and there’s now a way to group sources by authored (to show the original source files, thanks to source maps) or deployed (to show the actual files on the server).
It is now also possible to live edit the code of a function while debugging. If you’re paused at a breakpoint inside a function and want to test a quick fix, you can edit the code right there and save the file. The function will be restarted with the new code.
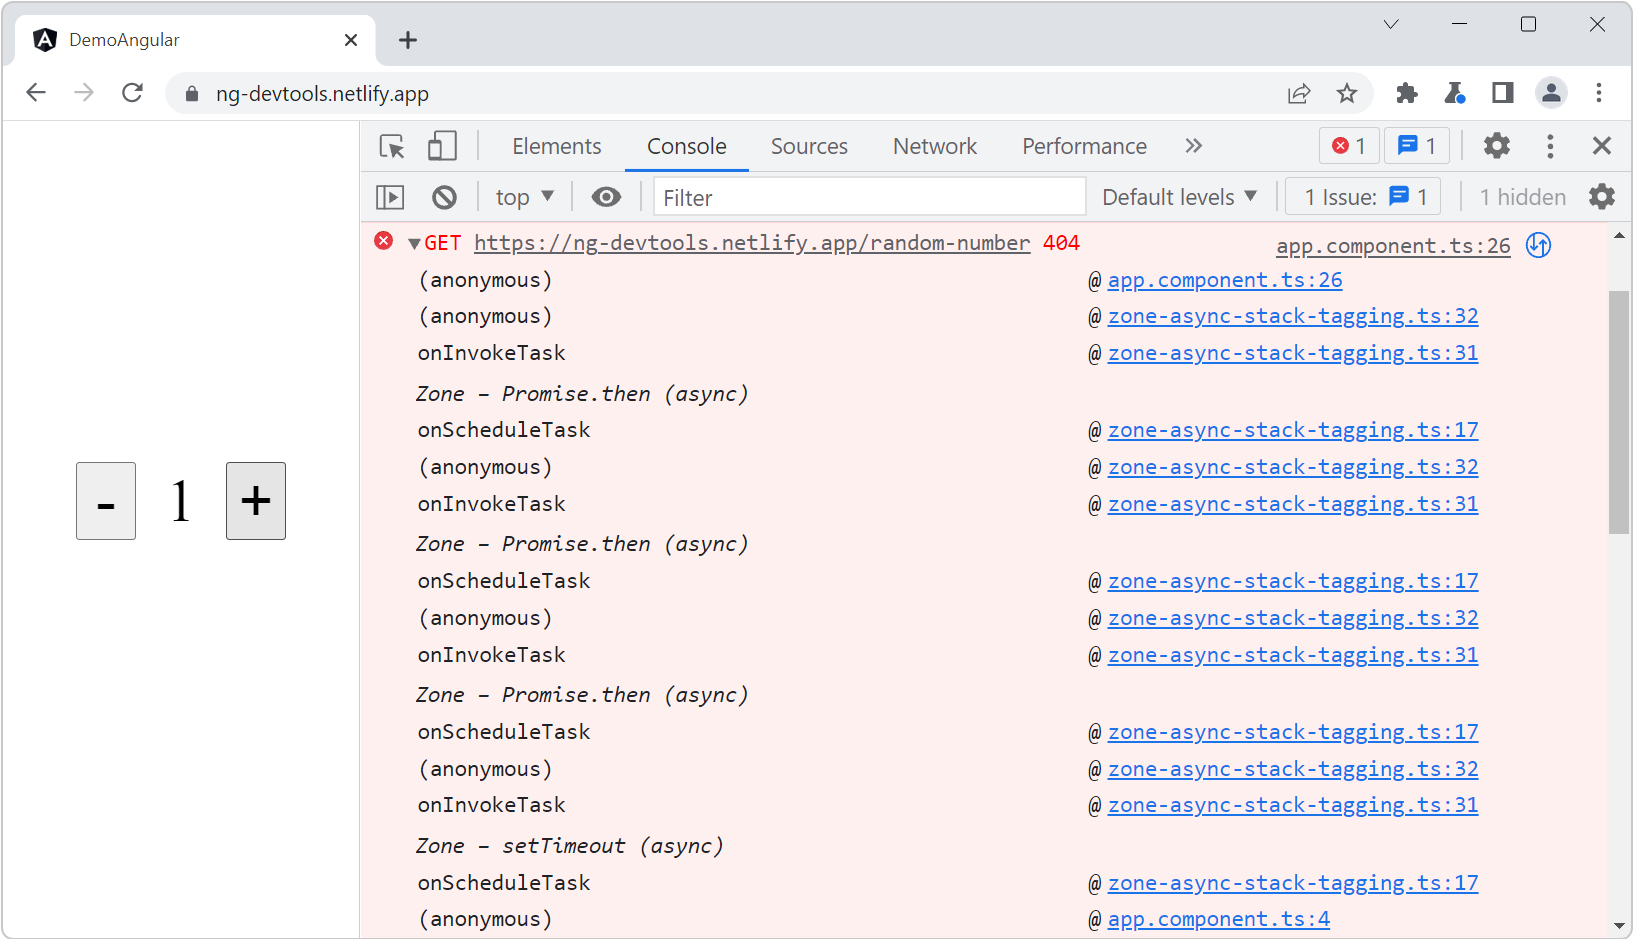
Next, stack traces for asynchronous operations are now reported entirely, showing you the full story of what happened before your current breakpoint, even if those things happened asynchronously.
Stack traces now also automatically ignore known third-party scripts, making it much easier to debug your own code.
Performance Investigation
Web performance is probably an area where we depend on tools even more than in other areas. You can’t really guess what’s running slow or eating too much memory until you profile your webpage. Fortunately, we keep on getting new options to investigate performance and memory problems, making our lives easier.
In fact, Chrome shipped an entirely new panel dedicated just to this!
Note: This panel is available in Chrome only and not in other Chromium-based browsers.
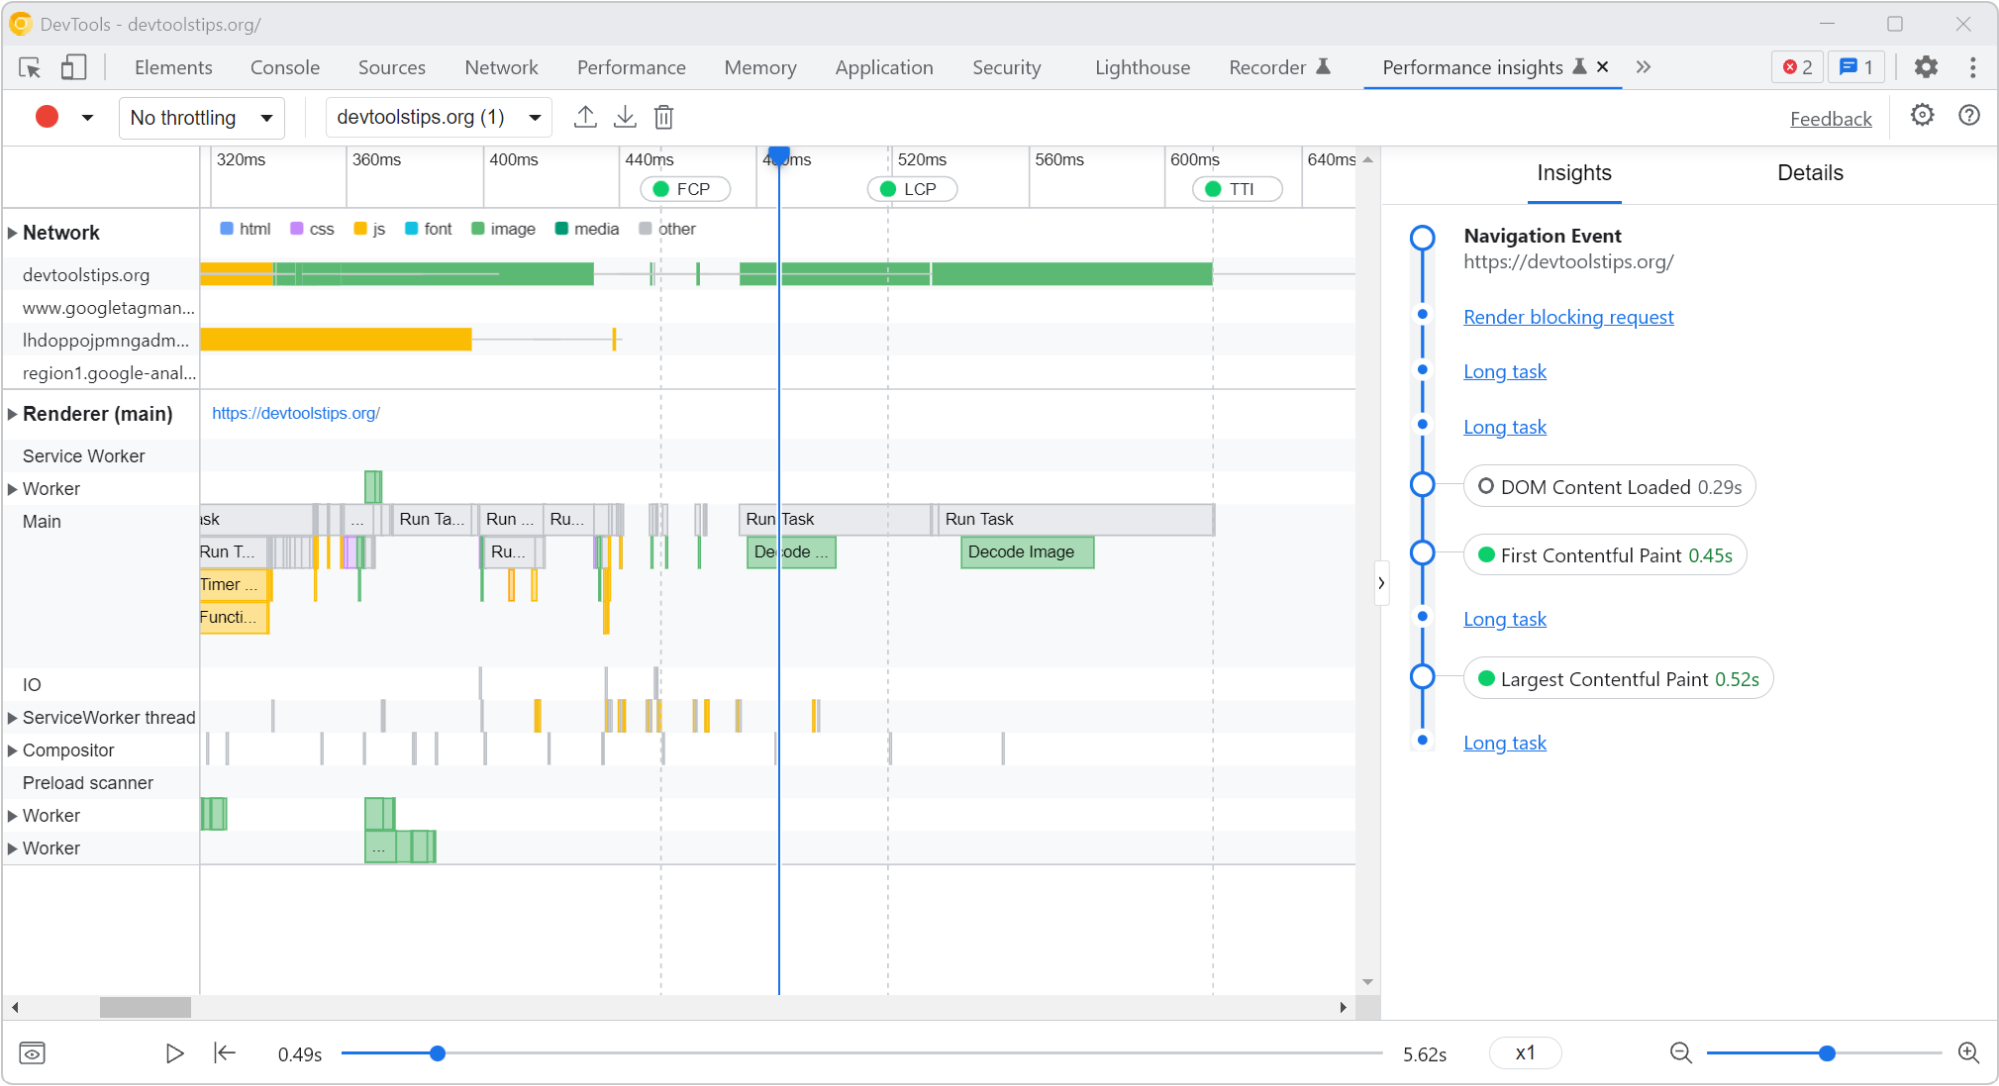
The Performance Insights panel shipped with Chrome 102 and has gradually gotten better and better, with recent additions like First Contentful Paint, Last Contentful Paint, Time To Interactive metrics and text flashes identification.
Think of the Performance Insights panel as a simpler version of the (sometimes scary) Performance panel:
Talking about the Performance panel, it recently got a brand new Interactions track in Chromium-based browsers, giving you a way to know when user events occur and how long they last, making it easier to debug responsiveness issues.
Edge has also been busy shipping new features in this area.
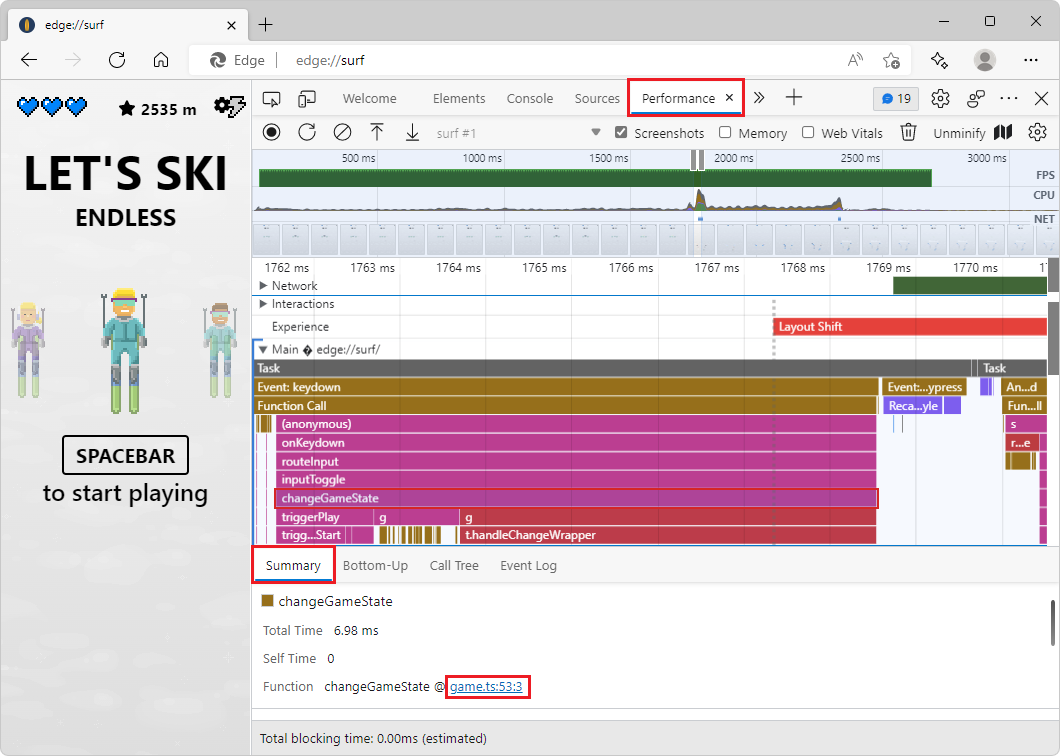
In the Performance tool, source maps can now be used to display original function names, even when sharing recorded profiles with other people:
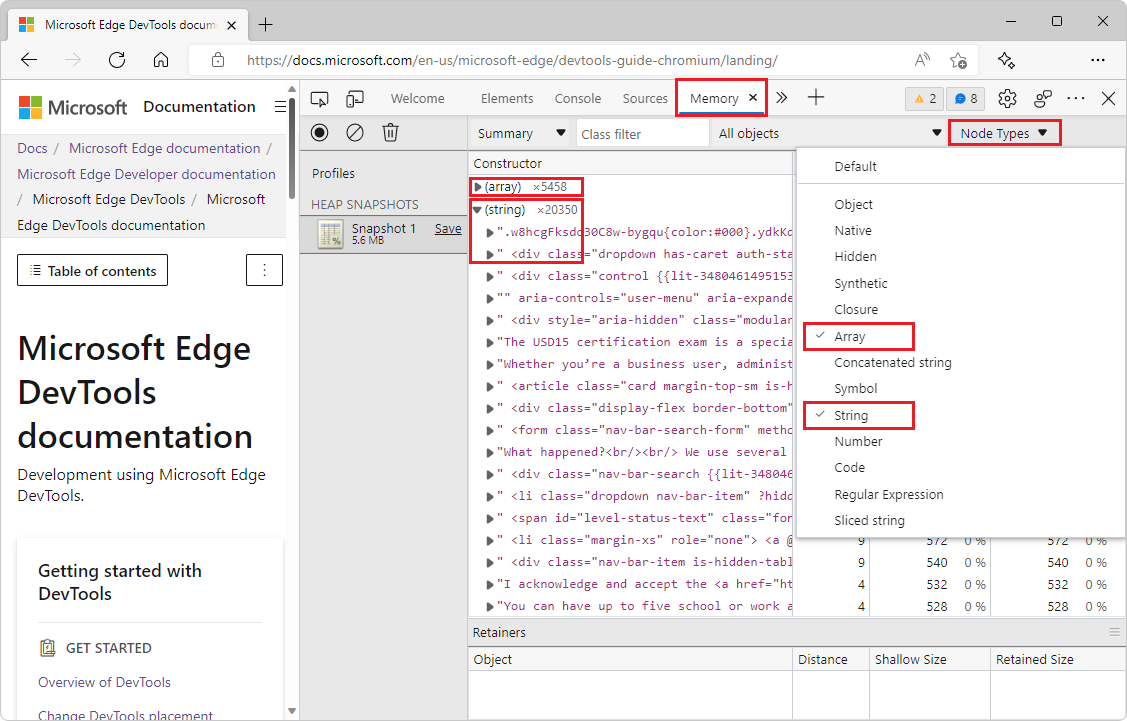
In the Memory tool, you now get a summary of your heap snapshots organized by node types. Heap snapshots are hard to dig through, and these node types make it easier to see what is using the most memory on your webpage. There are also new ways to filter memory retainers to find memory leak culprits quickly.
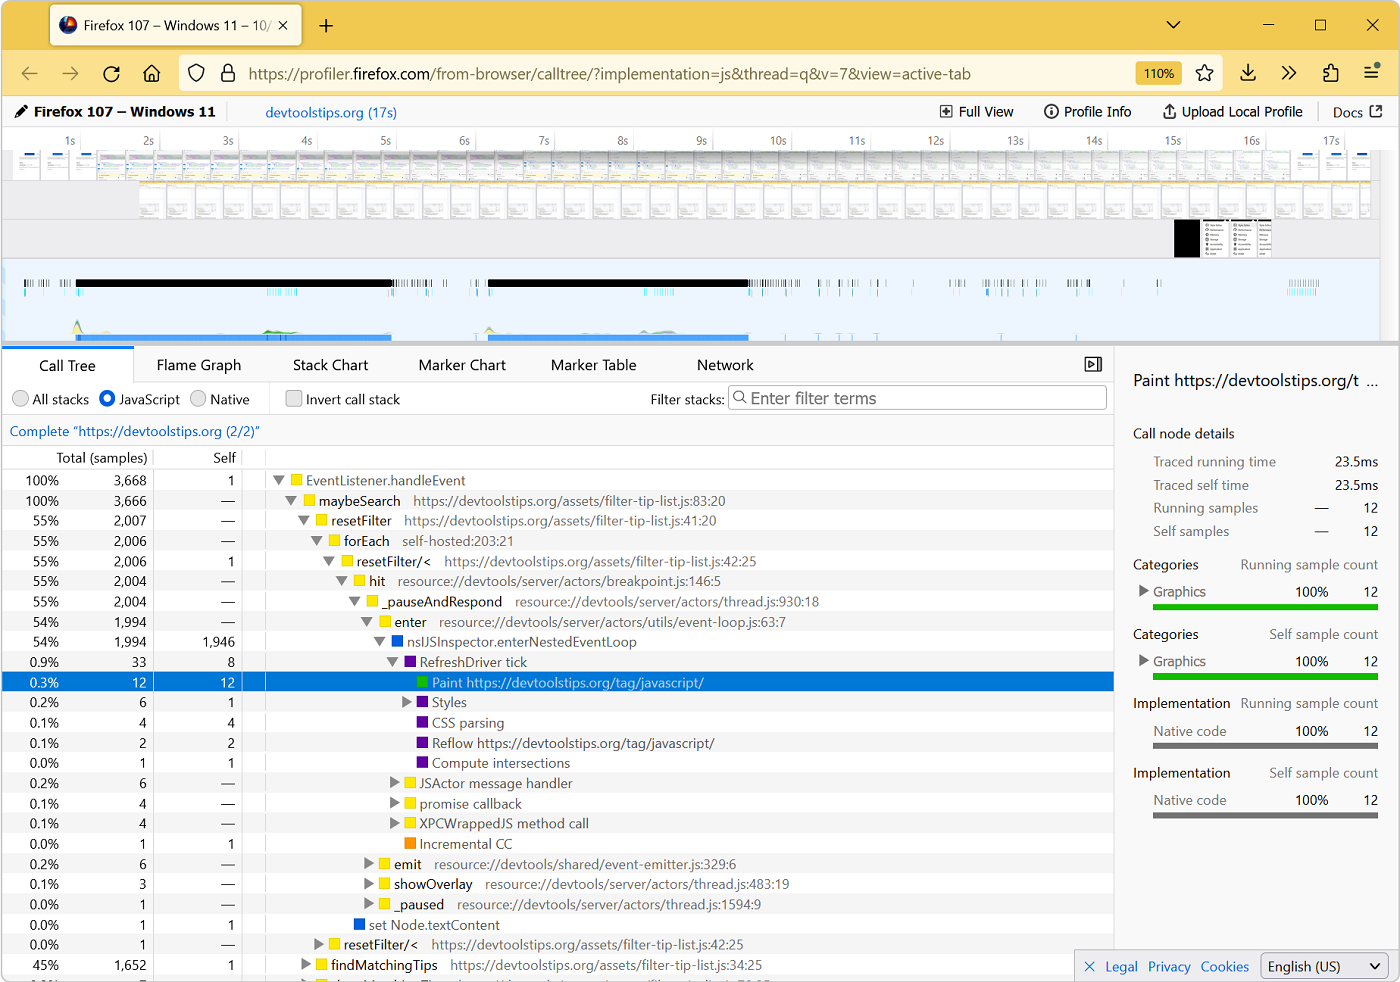
Finally, Firefox has also been active in this area over the past few months. A number of years ago, Firefox created a brand new Performance tool for its own use. The idea, at the time, was to have a tool to debug performance problems in the browser code itself. But over time, the tool was adapted to become useful to web developers too.
And now, the final changes have been made, and the old Firefox DevTools’ Performance panel has fully been replaced with the new one:
Network Debugging
Debugging your frontend code is important, but sometimes problems can happen in the network layer of your app when communicating with your server. Thankfully, a few very useful features were recently added to the Network tools in various browsers.
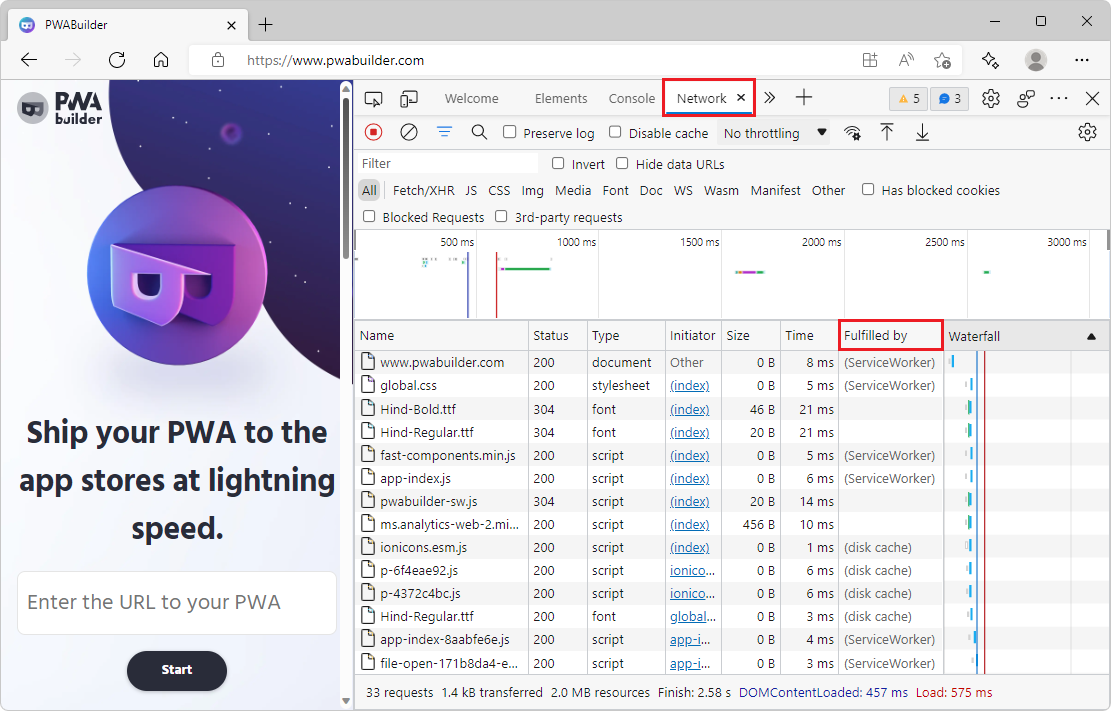
In Edge, a new column was added to the Network log. The Fulfilled by column makes it easier to debug your service worker logic and Progressive Web Apps.
You can now discover straight away whether a request was handled by the service worker, the browser cache, or your server.
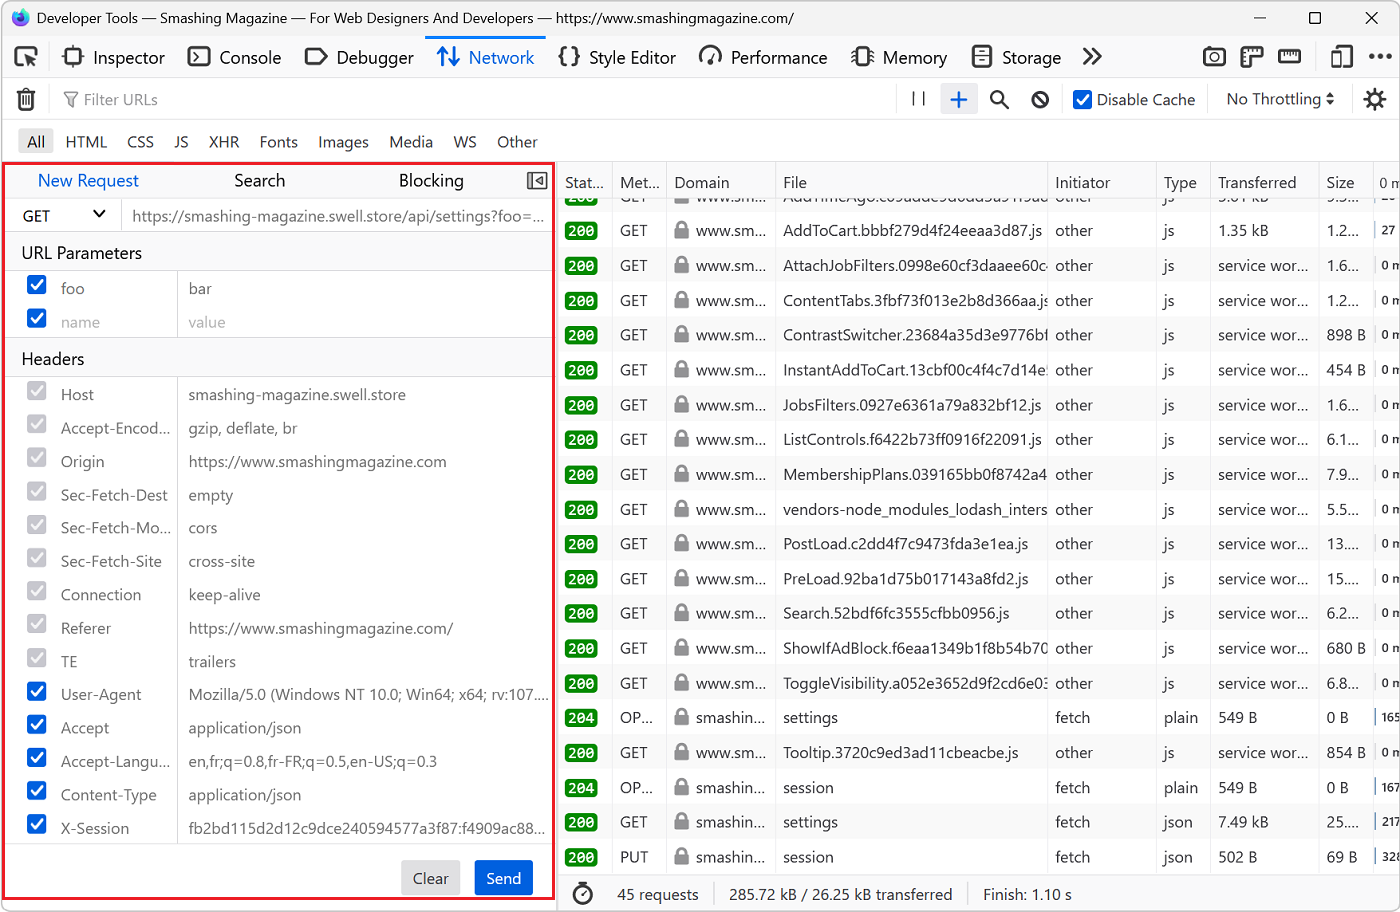
Firefox just shipped a completely redesigned version of its Edit and Resend feature. This feature has been available in Firefox for a long time already and is a great way to debug your server-side APIs or just test something quickly.
With it, you can right-click on any HTTP request displayed in the Network tool, select Edit and Resend, then manipulate the request parameters, headers, and body, and finally send the modified request.
Firefox completely redesigned it recently. It’s now much easier to edit the parameters before sending a new request.
And finally, Safari has added quite a few great features in this area too. You can now block network requests entirely, and you can also locally override requests by using regular expressions.
Editor Integration
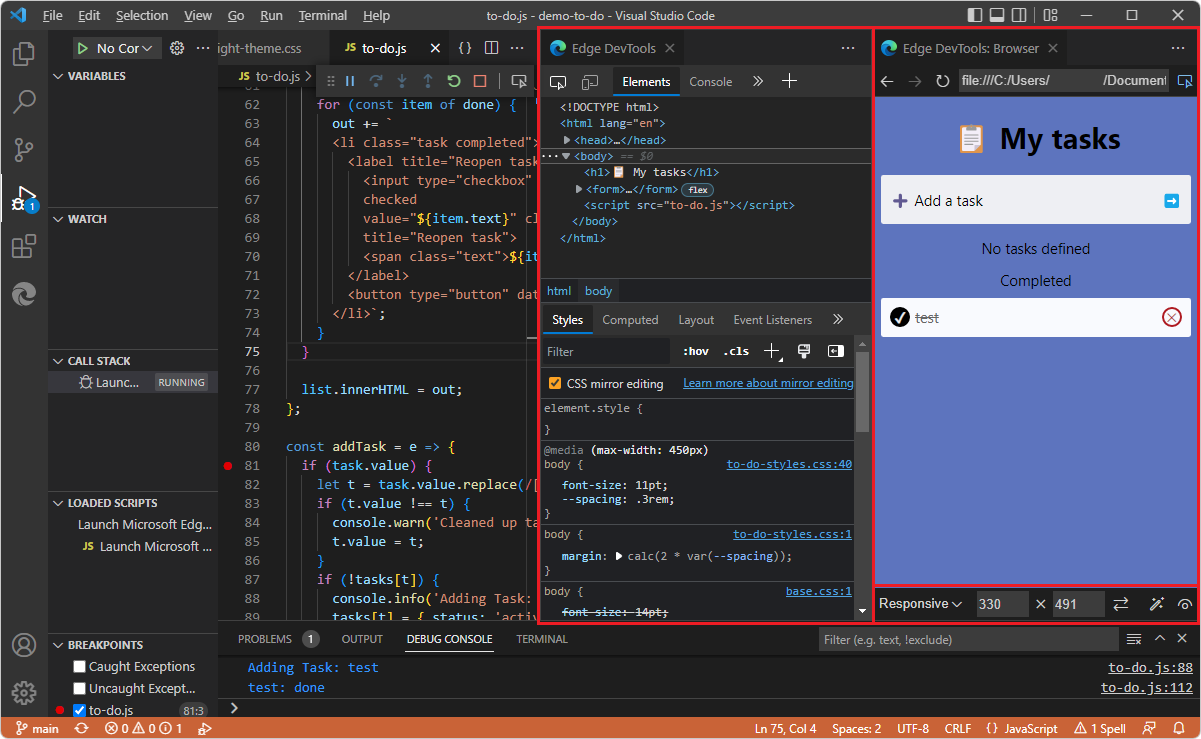
Microsoft also does VSCode, which is a very popular code editor amongst web developers, and some time ago, the Edge team released the Edge Tools extension for VS Code. The extension gives you an embedded browser and the browser DevTools right in VS Code alongside your code.
This year, the team continued to work on the extension and added more features. In particular, the following things are now possible:
- The extension now has the Console and Application tools available. Previously, only the Elements and Network tools were available. Console logs used to go to VSCode’s output, but now they also go to the Console tool in the embedded DevTools.
- The embedded browser has been completely redesigned and features a lot of emulation and rendering options to test your webpage under different conditions. For example, you can emulate different media types or the prefers-code-scheme media feature. You can also emulate different color vision deficiencies.
- Next, you can launch the embedded browser and DevTools simply by right-clicking an HTML file in VS Code.
- Finally, you can use VS Code’s Quick Fix options to automatically fix a number of issues reported by the extension in your code.
One more thing, if you like using Visual Studio (not VS Code), note that the team released an extension for it too. Check out the Edge Developer Tools for Visual Studio extension.
Test Automation
It’s possible to automate browsers nowadays, and it can be very useful for testing. With browser automation libraries such as WebDriver, Puppeteer, and Playwright, you can write tests that mimic what users would do on your website and verify that these scenarios continue working over time, as you make changes to your product.
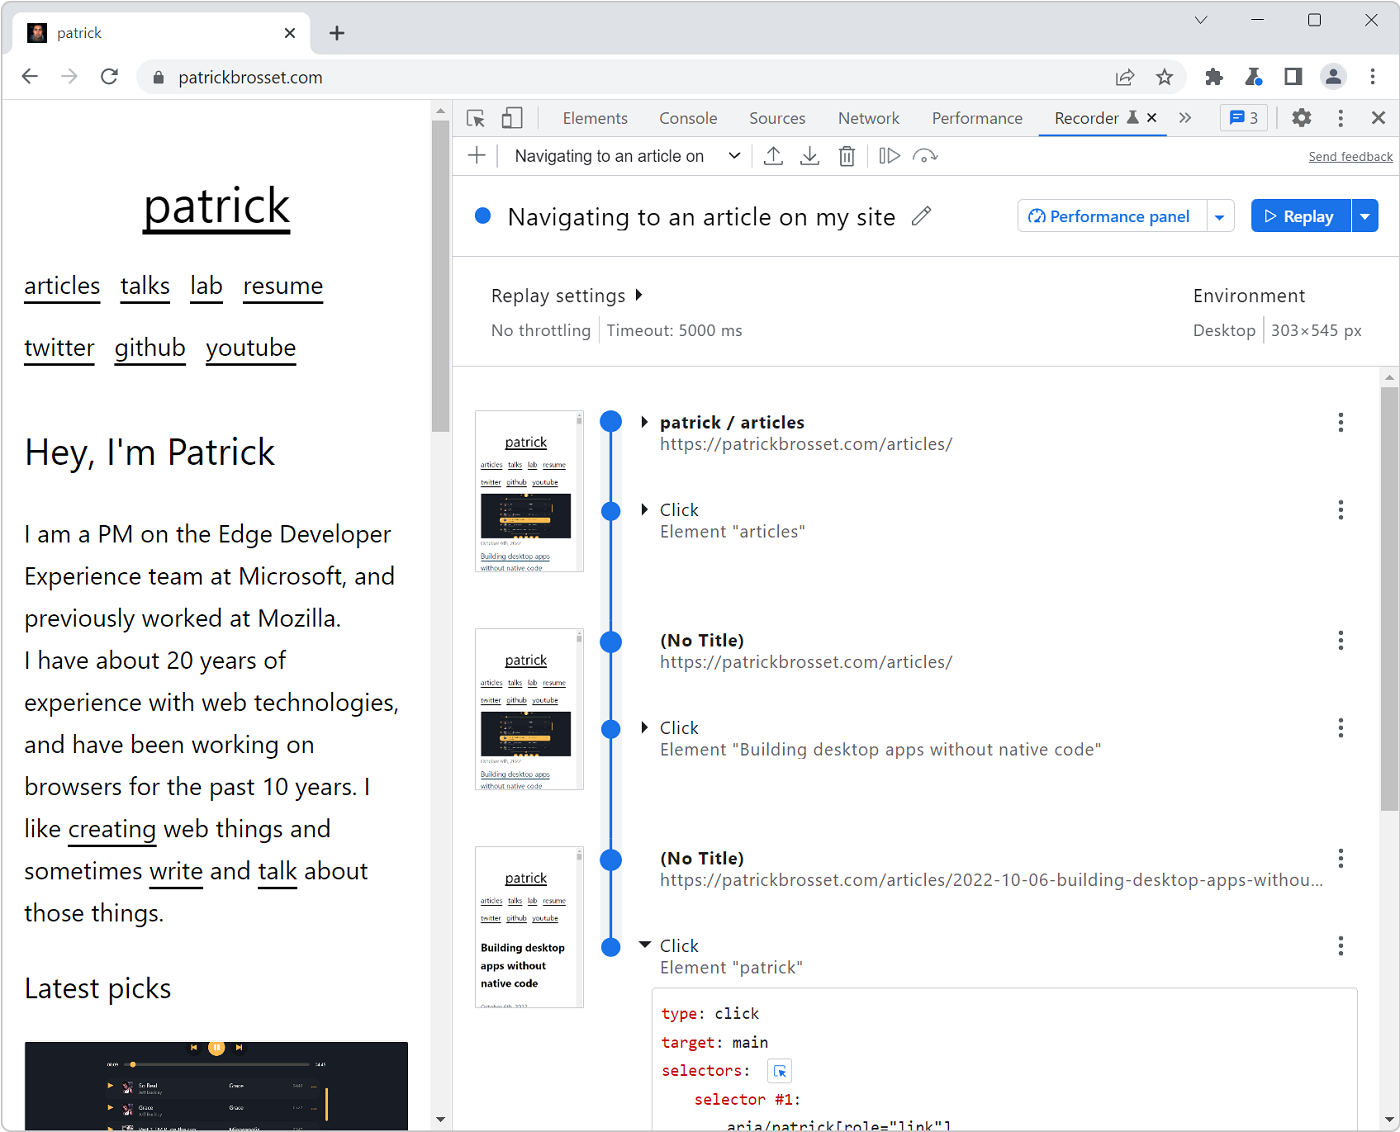
This area is in constant evolution; in particular, the WebDriver spec is evolving with a new bi-directional version. Also, the Chrome DevTools team has been innovating quite a lot lately. They shipped a new tool called the Recorder last year and have been improving it over time.
Here are some of the new features that got added to the panel in recent months:
- It’s now possible to wait until elements are visible and clickable before continuing a recording.
- Element selectors are better supported.
- You can import and export recorded flows as JSON.
- Double-click, mouse over, and right-click events can be recorded too.
- There’s also an option to replay a recording slowly or step-by-step.
- And, finally, the Recorder tool now supports extensions to export recordings to a variety of test automation formats, such as Cypress, WebPageTest, Nightwatch, or WebdriverIO.
Miscellaneous Updates
Phew, that was a lot! But we’re not done. Let’s wrap this up with a list of somewhat random but very useful features.
Chrome made a lot of source maps and stack traces improvements, providing a more stable and easier-to-use debugging experience. If you usually debug your JavaScript code with logs, now may be a good time to give breakpoint debugging a try and see if it speeds things up for you.
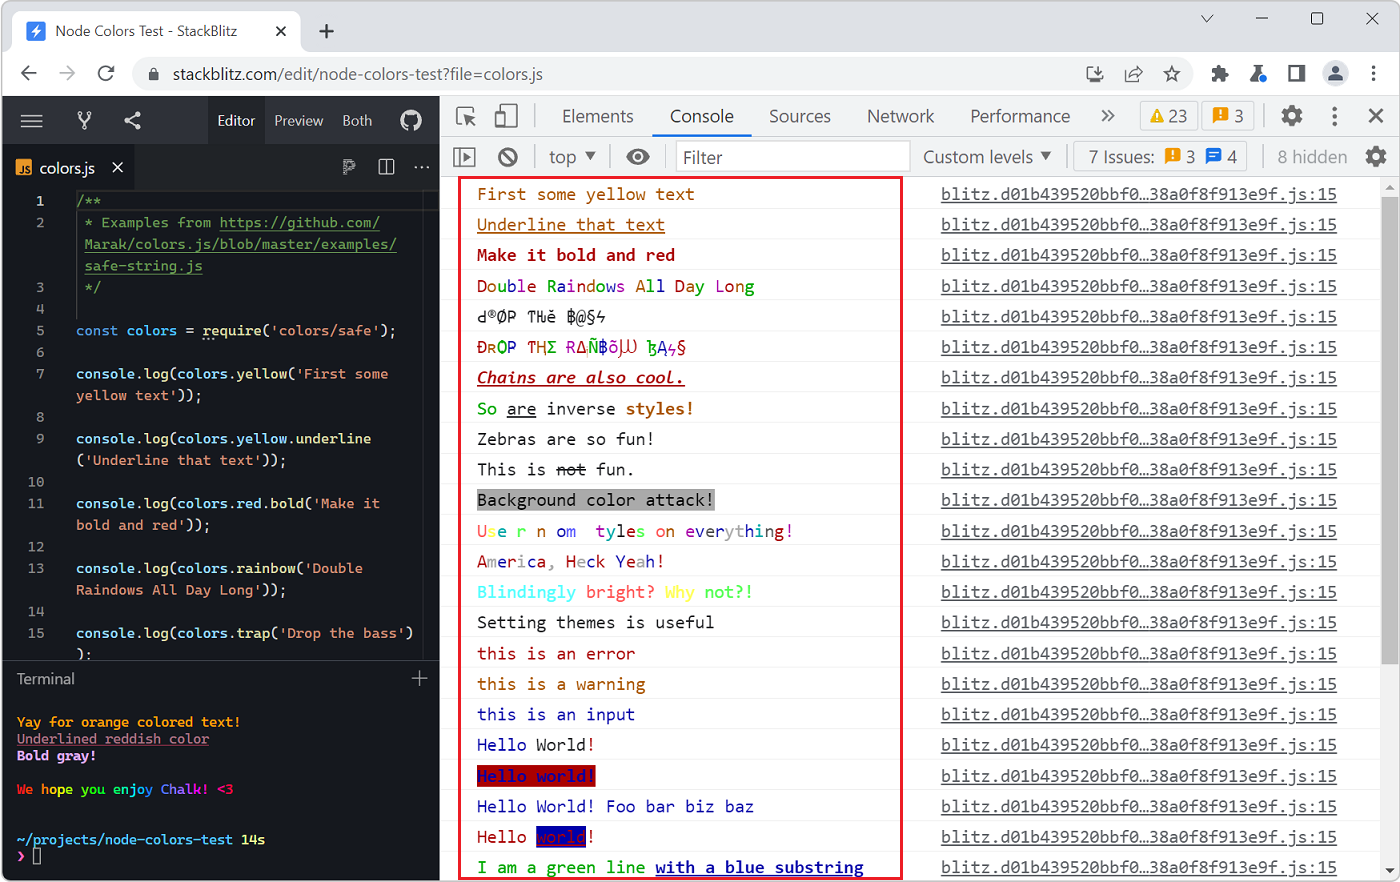
Talking about logging, they also made it possible to properly style logs with ANSI escape codes.
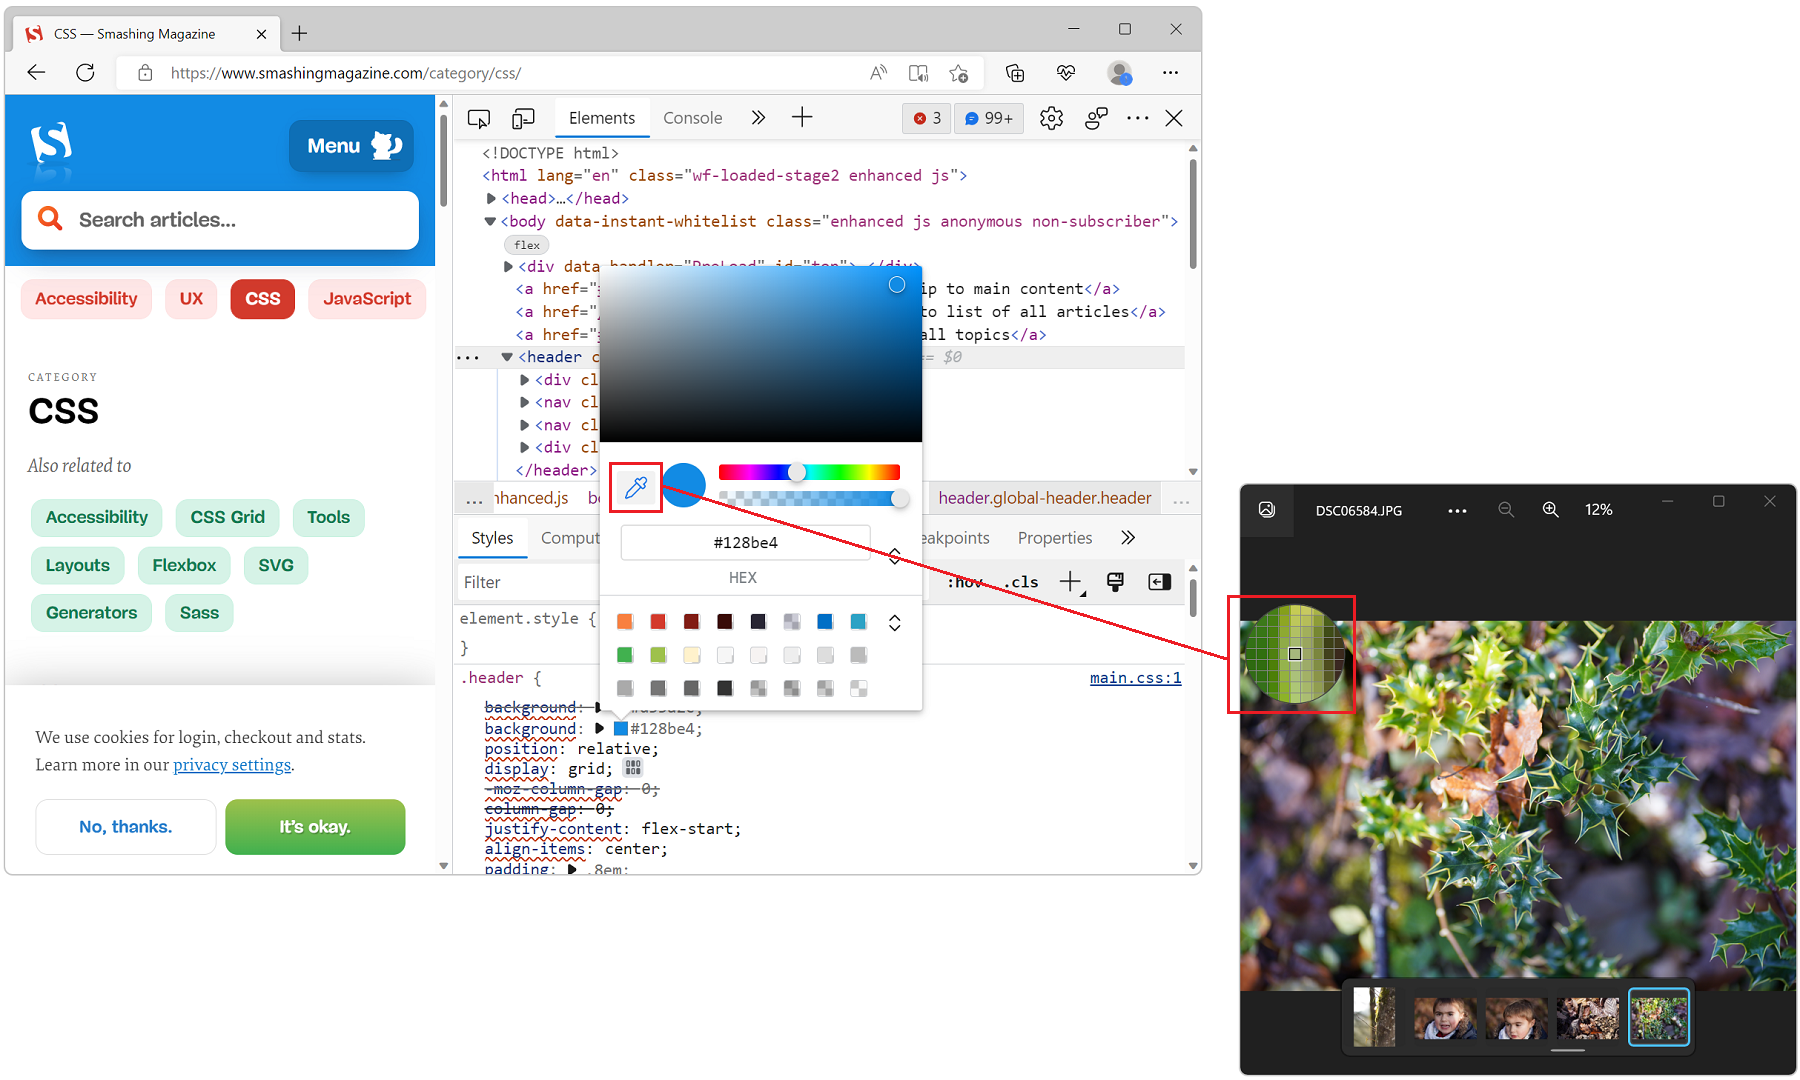
Next, you can now pick colors from anywhere on your screen when changing colors in the Styles sidebar.
Note: This was made possible thanks to the EyeDropper API, which you can also use on your web pages.
Edge shipped a feature to publish and retrieve production source maps from Azure, making it much easier to securely debug your code in production even when you don’t want to publish source maps and original source code to your server.
Read more about publishing your source maps and consuming them from DevTools.
The team also opened a new public feedback repository on GitHub which you can use to report ideas, issues, and features or just discuss them.
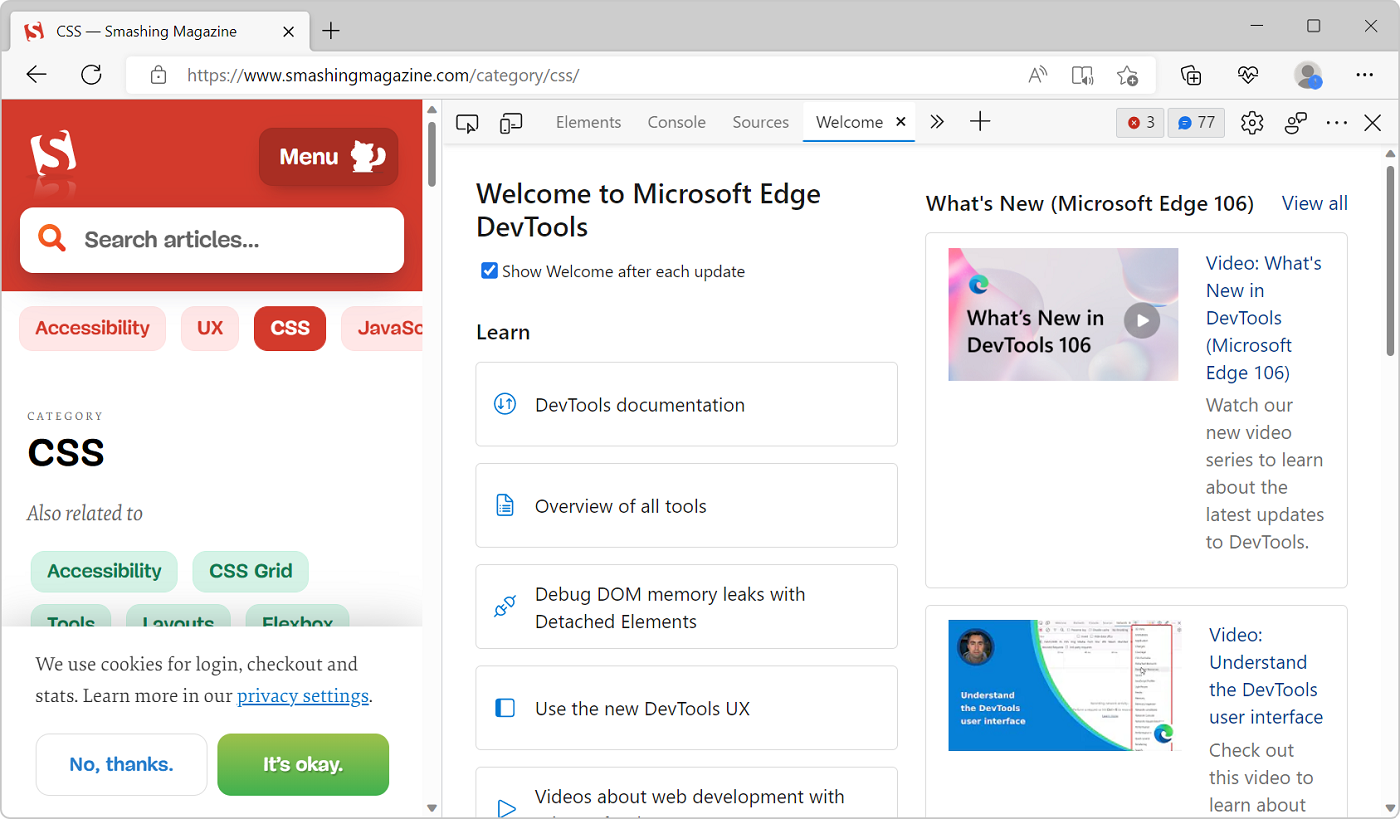
Finally, they shipped a redesigned Welcome tool where you can find all sorts of useful videos and links to documentation.
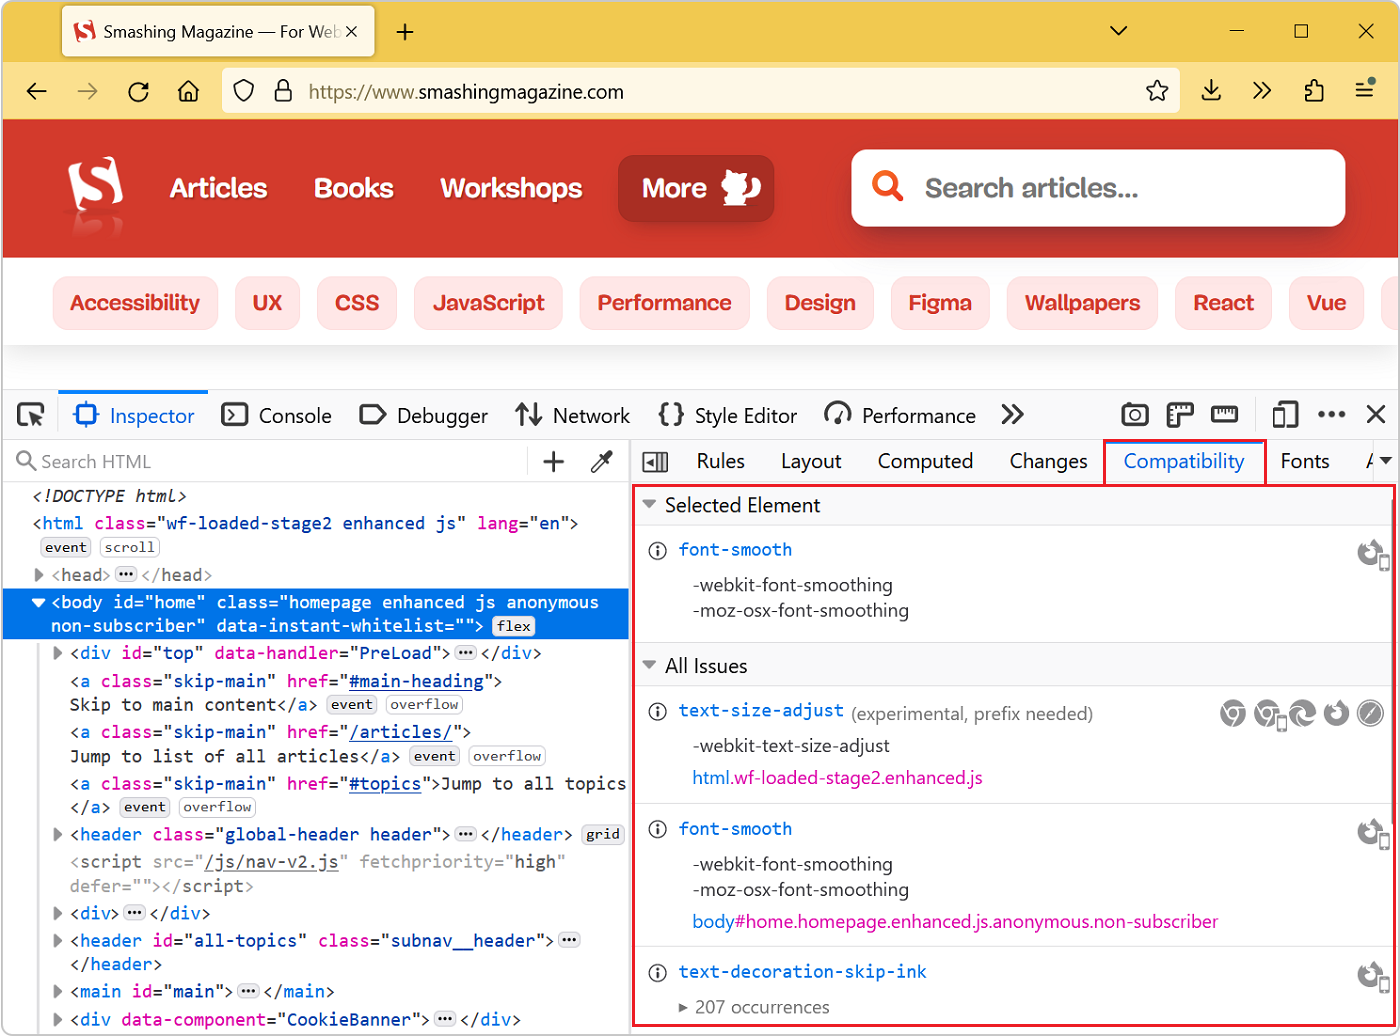
Switching to Firefox, the DevTools team continued to keep their Compatibility panel up to date with new browser compatibility data, so you can get relevant cross-browser support issues right when debugging your CSS.
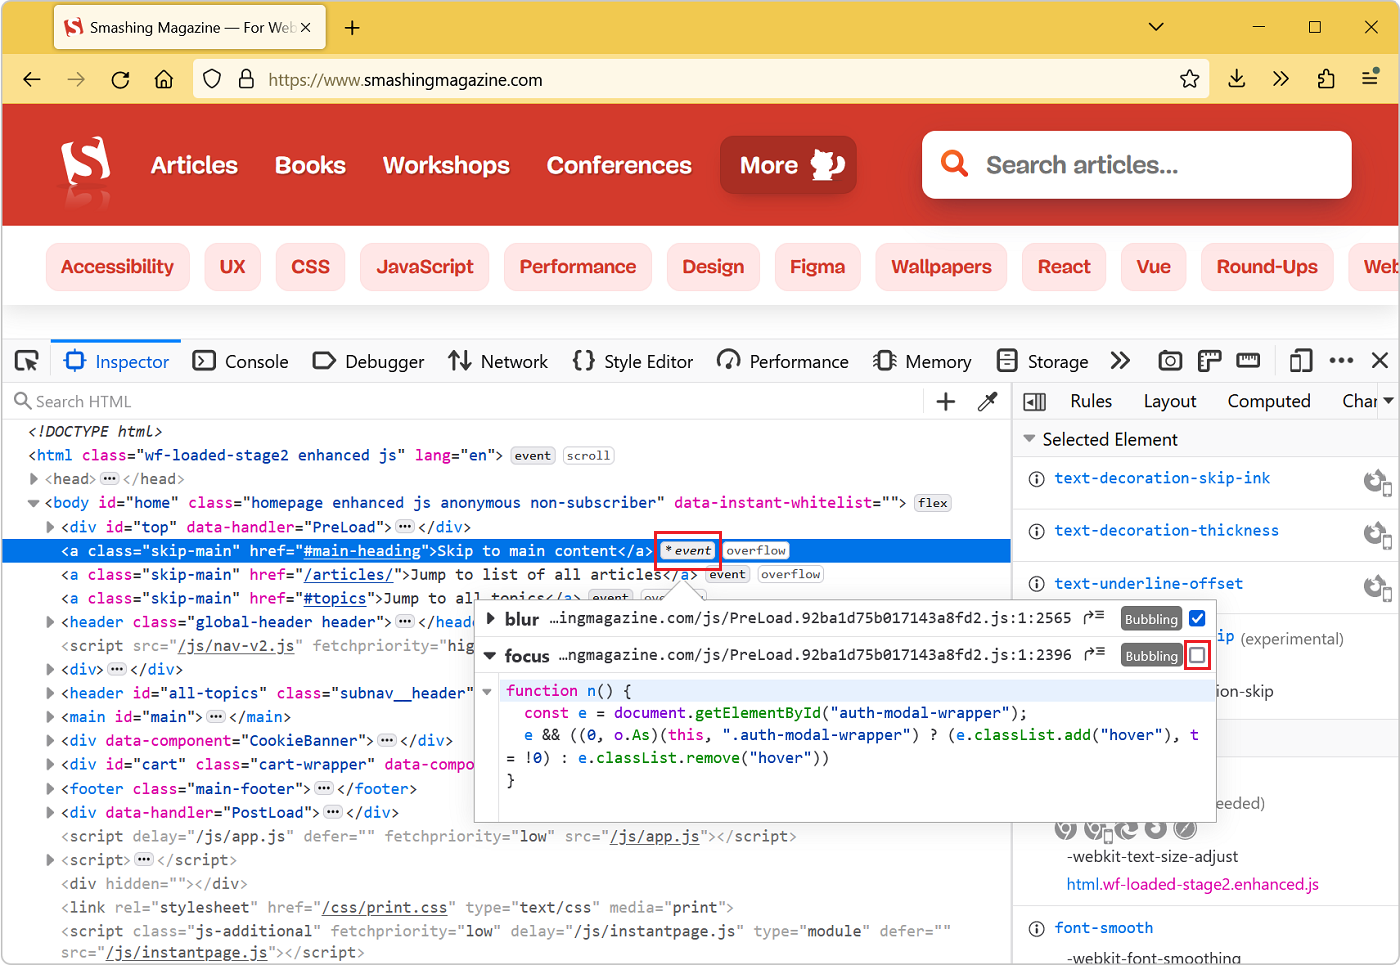
The team also made it possible to disable and re-enable any event listener for a given element in the Inspector.
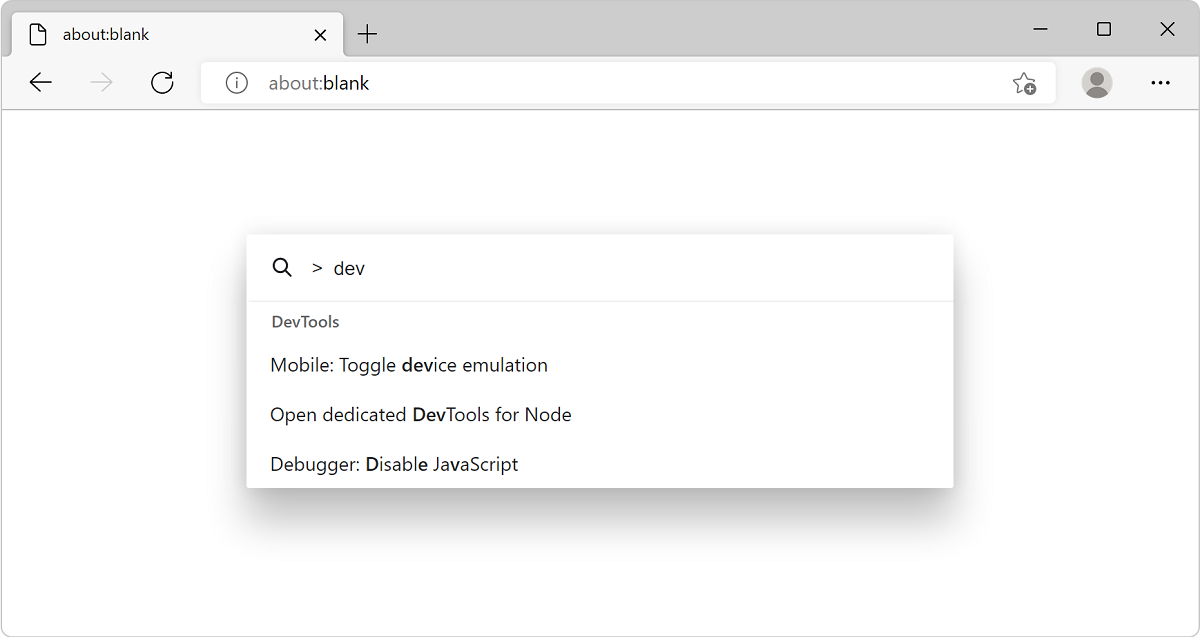
Finally, Edge just shipped a cool new experimental feature that enables one to type commands and access common browser and DevTools features from one keyboard shortcut.
The Command palette experiment lets you enter commands in the browser by pressing Ctrl+Q (note that prior to Edge 108, the shortcut was Ctrl+Shift+Space).
And that’s it for today. I hope you found a few things that will be useful for your web development projects.
DevTools has gotten impressively full of features over the years, and it’s hard to keep track, but here are a few pointers that I hope will make it easier to discover new features:
- The Chrome DevTools What’s New video playlist on YouTube.
- The Edge DevTools What’s New video playlist on YouTube.
- The @FirefoxDevTools Twitter, where new features are often announced.
- The WebInspector category on the WebKit blog.
And with this, thanks for reading, and if you have great DevTools tips you want to share with everyone, please drop us a comment!


