Front-End Performance 2021: Build Optimizations

Email Newsletter
Weekly tips on front-end & UX.
Trusted by 182,000+ folks.
This guide has been kindly supported by our friends at LogRocket, a service that combines frontend performance monitoring, session replay, and product analytics to help you build better customer experiences. LogRocket tracks key metrics, incl. DOM complete, time to first byte, first input delay, client CPU and memory usage. Get a free trial of LogRocket today.
Table Of Contents
- Getting Ready: Planning And Metrics
- Setting Realistic Goals
- Defining The Environment
- Assets Optimizations
- Build Optimizations
- Delivery Optimizations
- Networking, HTTP/2, HTTP/3
- Testing And Monitoring
- Quick Wins
- Everything on one page
- Download The Checklist (PDF, Apple Pages, MS Word)
- Subscribe to our email newsletter to not miss the next guides.
Build Optimizations
- Have we defined our priorities?
It’s a good idea to know what you are dealing with first. Run an inventory of all of your assets (JavaScript, images, fonts, third-party scripts and "expensive" modules on the page, such as carousels, complex infographics and multimedia content), and break them down in groups.Set up a spreadsheet. Define the basic core experience for legacy browsers (i.e. fully accessible core content), the enhanced experience for capable browsers (i.e. an enriched, full experience) and the extras (assets that aren’t absolutely required and can be lazy-loaded, such as web fonts, unnecessary styles, carousel scripts, video players, social media widgets, large images). Years ago, we published an article on "Improving Smashing Magazine’s Performance," which describes this approach in detail.
When optimizing for performance we need to reflect our priorities. Load the core experience immediately, then enhancements, and then the extras.
- Do you use native JavaScript modules in production?
Remember the good ol' cutting-the-mustard technique to send the core experience to legacy browsers and an enhanced experience to modern browsers? An updated variant of the technique could use ES2017+script type="module", also known as module/nomodule pattern (also introduced by Jeremy Wagner as differential serving).The idea is to compile and serve two separate JavaScript bundles: the “regular” build, the one with Babel-transforms and polyfills and serve them only to legacy browsers that actually need them, and another bundle (same functionality) that has no transforms or polyfills.
As a result, we help reduce blocking of the main thread by reducing the amount of scripts the browser needs to process. Jeremy Wagner has published a comprehensive article on differential serving and how to set it up in your build pipeline, from setting up Babel, to what tweaks you’ll need to make in Webpack, as well as the benefits of doing all this work.
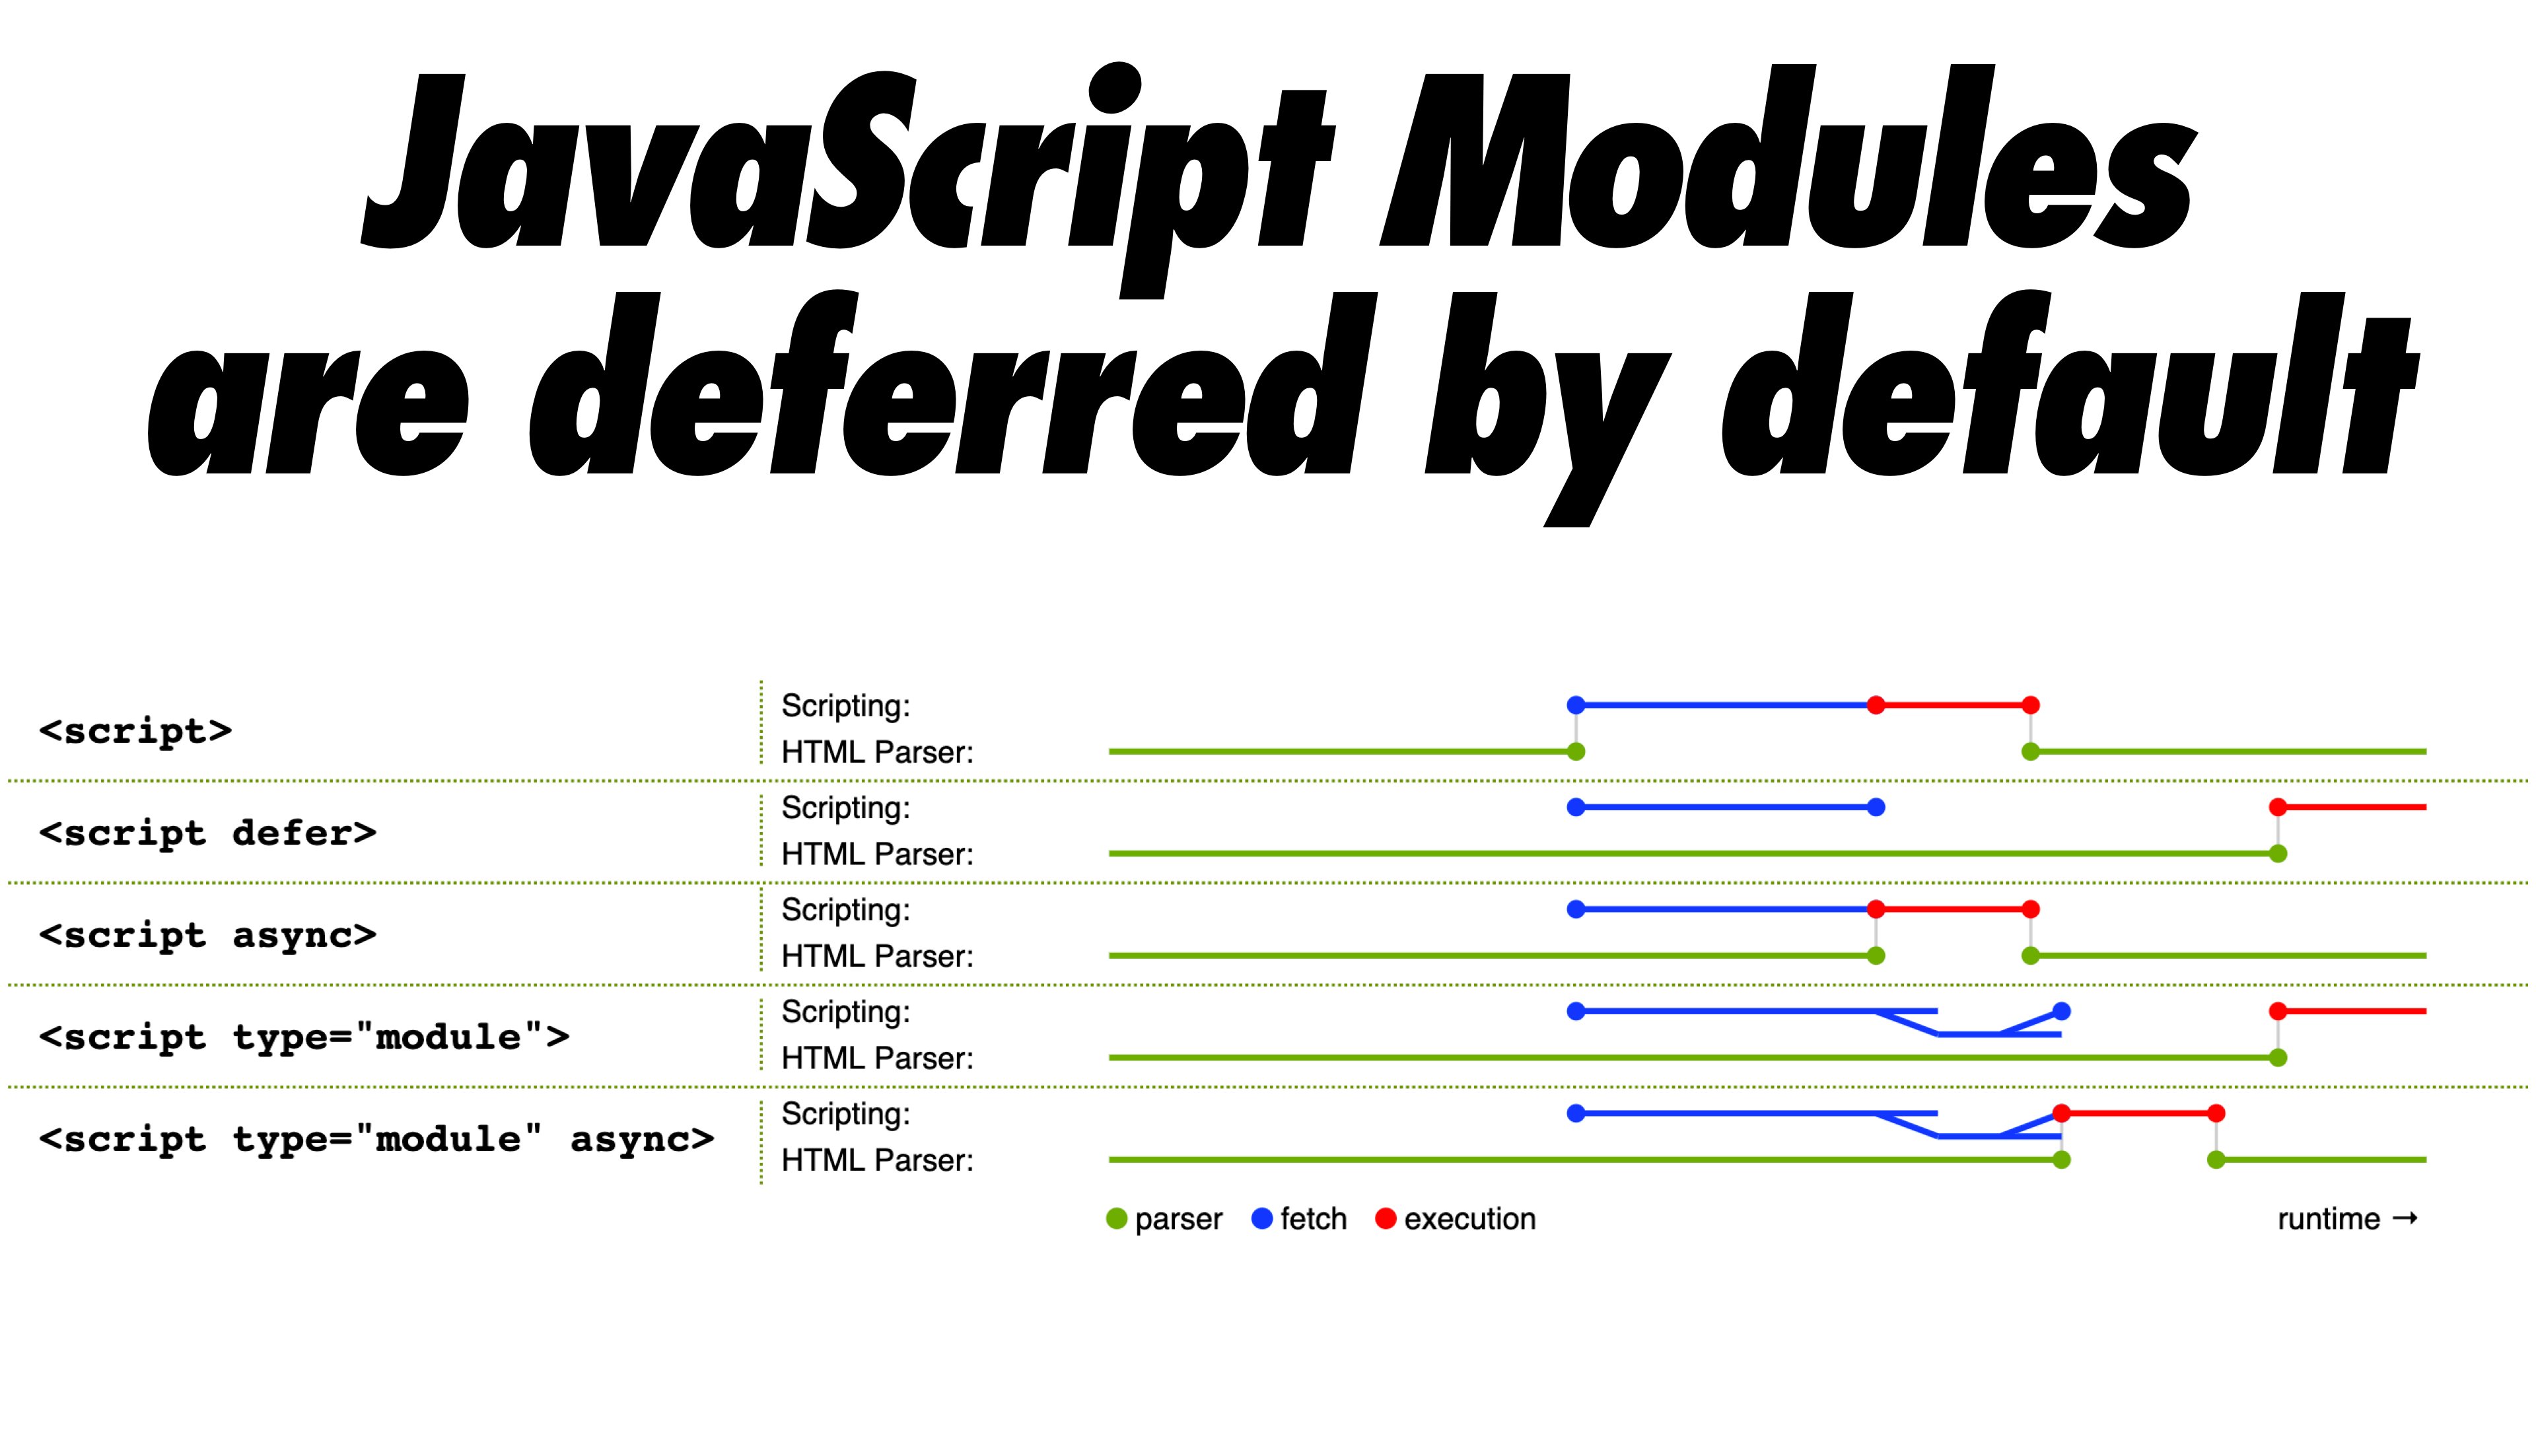
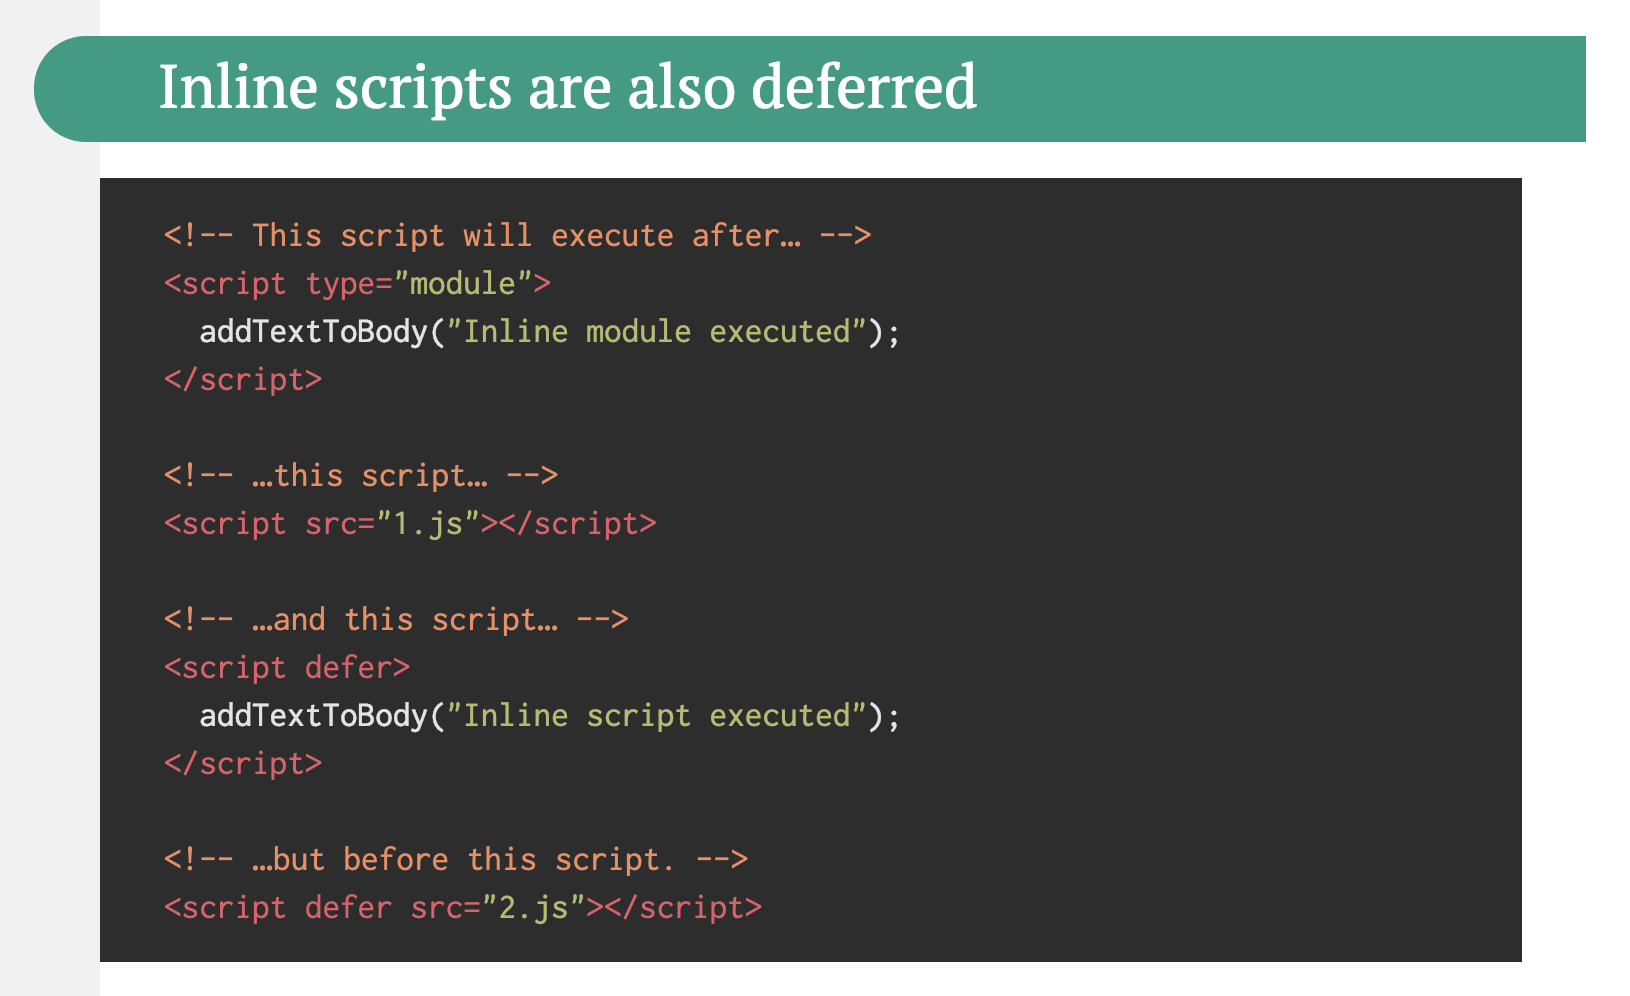
Native JavaScript module scripts are deferred by default, so while HTML parsing is happening, the browser will download the main module.

Native JavaScript modules are deferred by default. Pretty much everything about native JavaScript modules. (Large preview) One note of warning though: the module/nomodule pattern can backfire on some clients, so you might want to consider a workaround: Jeremy’s less risky differential serving pattern which, however, sidesteps the preload scanner, which could affect performance in ways one might not anticipate. (thanks, Jeremy!)
In fact, Rollup supports modules as an output format, so we can both bundle code and deploy modules in production. Parcel has module support in Parcel 2. For Webpack, module-nomodule-plugin automates the generation of module/nomodule scripts.
Note: It’s worth stating that feature detection alone isn’t enough to make an informed decision about the payload to ship to that browser. On its own, we can’t deduce device capability from browser version. For example, cheap Android phones in developing countries mostly run Chrome and will cut the mustard despite their limited memory and CPU capabilities.
Eventually, using the Device Memory Client Hints Header, we’ll be able to target low-end devices more reliably. At the moment of writing, the header is supported only in Blink (it goes for client hints in general). Since Device Memory also has a JavaScript API which is available in Chrome, one option could be to feature detect based on the API, and fall back to module/nomodule pattern if it’s not supported (thanks, Yoav!).
- Are you using tree-shaking, scope hoisting and code-splitting?
Tree-shaking is a way to clean up your build process by only including code that is actually used in production and eliminate unused imports in Webpack. With Webpack and Rollup, we also have scope hoisting that allows both tools to detect whereimportchaining can be flattened and converted into one inlined function without compromising the code. With Webpack, we can also use JSON Tree Shaking as well.Code-splitting is another Webpack feature that splits your codebase into "chunks" that are loaded on demand. Not all of the JavaScript has to be downloaded, parsed and compiled right away. Once you define split points in your code, Webpack can take care of the dependencies and outputted files. It enables you to keep the initial download small and to request code on demand when requested by the application. Alexander Kondrov has a fantastic introduction to code-splitting with Webpack and React.
Consider using preload-webpack-plugin that takes routes you code-split and then prompts browser to preload them using `` or ``. Webpack inline directives also give some control over
preload/prefetch. (Watch out for prioritization issues though.)Where to define split points? By tracking which chunks of CSS/JavaScript are used, and which aren’t used. Umar Hansa explains how you can use Code Coverage from Devtools to achieve it.
When dealing with single-page applications, we need some time to initialize the app before we can render the page. Your setting will require your custom solution, but you could watch out for modules and techniques to speed up the initial rendering time. For example, here’s how to debug React performance and eliminate common React performance issues, and here’s how to improve performance in Angular. In general, most performance issues come from the initial time to bootstrap the app.
So, what’s the best way to code-split aggressively, but not too aggressively? According to Phil Walton, "in addition to code-splitting via dynamic imports, [we could] also use code-splitting at the package level, where each imported node modules get put into a chunk based on its package’s name." Phil provides a tutorial on how to build it as well.
- Can we improve Webpack's output?
As Webpack is often considered to be mysterious, there are plenty of Webpack plugins that may come in handy to further reduce Webpack's output. Below are some of the more obscure ones that might need a bit more attention.One of the interesting ones comes from Ivan Akulov's thread. Imagine that you have a function that you call once, store its result in a variable, and then don’t use that variable. Tree-shaking will remove the variable, but not the function, because it might be used otherwise. However, if the function isn't used anywhere, you might want to remove it. To do so, prepend the function call with
/*#__PURE__*/which is supported by Uglify and Terser — done!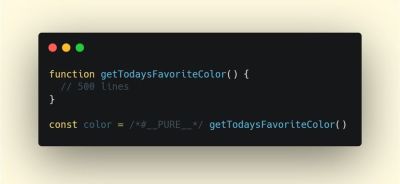
To remove such a function when its result is not used, prepend the function call with /*#__PURE__*/. Via Ivan Akulov.(Large preview)Here are some of the other tools that Ivan recommends:
- purgecss-webpack-plugin removes unused classes, especially when you are using Bootstrap or Tailwind.
- Enable
optimization.splitChunks: 'all'with split-chunks-plugin. This would make webpack automatically code-split your entry bundles for better caching. - Set
optimization.runtimeChunk: true. This would move webpack’s runtime into a separate chunk — and would also improve caching. - google-fonts-webpack-plugin downloads font files, so you can serve them from your server.
- workbox-webpack-plugin allows you to generate a service worker with a precaching setup for all of your webpack assets. Also, check Service Worker Packages, a comprehensive guide of modules that could be applied right away. Or use preload-webpack-plugin to generate
preload/prefetchfor all JavaScript chunks. - speed-measure-webpack-plugin measures your webpack build speed, providing insights into which steps of the build process are most time-consuming.
- duplicate-package-checker-webpack-plugin warns when your bundle contains multiple versions of the same package.
- Use scope isolation and shorten CSS class names dynamically at the compilation time.

- Can you offload JavaScript into a Web Worker?
To reduce the negative impact to Time-to-Interactive, it might be a good idea to look into offloading heavy JavaScript into a Web Worker.As the code base keeps growing, the UI performance bottlenecks will show up, slowing down the user’s experience. That’s because DOM operations are running alongside your JavaScript on the main thread. With web workers, we can move these expensive operations to a background process that’s running on a different thread. Typical use cases for web workers are prefetching data and Progressive Web Apps to load and store some data in advance so that you can use it later when needed. And you could use Comlink to streamline the communication between the main page and the worker. Still some work to do, but we are getting there.
There are a few interesting case studies around web workers which show different approaches of moving framework and app logic to web workers. The conclusion: in general, there are still some challenges, but there are some good use cases already (thanks, Ivan Akulov!).
Starting from Chrome 80, a new mode for web workers with performance benefits of JavaScript modules has been shipped, called module workers. We can change script loading and execution to match
script type="module", plus we can also use dynamic imports for lazy-loading code without blocking execution of the worker.How to get started? Here are a few resources that are worth looking into:
- Surma has published an excellent guide on how to run JavaScript off the browser’s main thread and also When should you be using Web Workers?
- Also, check Surma's talk about off the main thread architecture.
- A Quest to Guarantee Responsiveness by Shubhie Panicker and Jason Miller provide a detailed insight into how to use web workers, and when to avoid them.
- Getting Out of Users' Way: Less Jank With Web Workers highlights useful patterns for working with Web Workers, effective ways to communicate between workers, handle complex data processing off the main thread, and test and debug them.
- Workerize allows you to move a module into a Web Worker, automatically reflecting exported functions as asynchronous proxies.
- If you’re using Webpack, you could use workerize-loader. Alternatively, you could use worker-plugin as well.
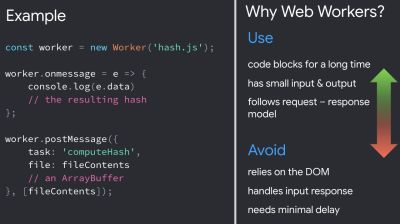
Use web workers when code blocks for a long time, but avoid them when you rely on the DOM, handle input response and need minimal delay. (via Addy Osmani) (Large preview) Note that Web Workers don’t have access to the DOM because the DOM is not "thread-safe", and the code that they execute needs to be contained in a separate file.
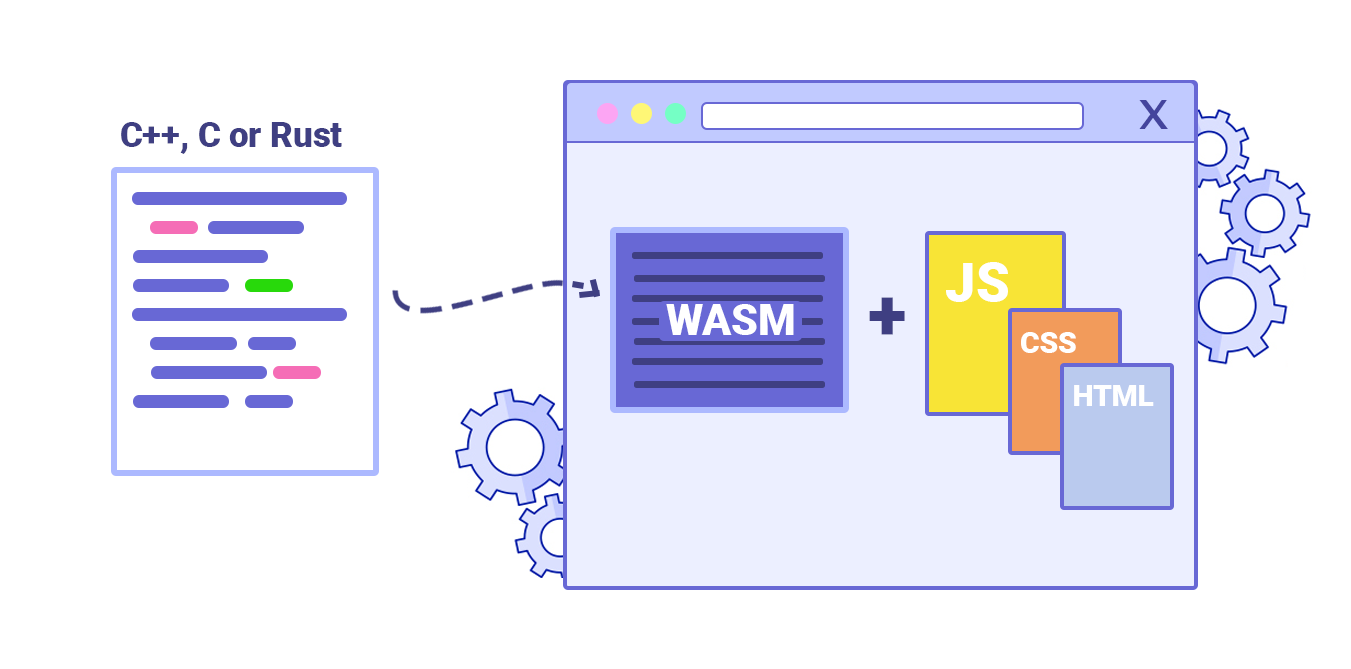
- Can you offload "hot paths" to WebAssembly?
We could offload computationally heavy tasks off to WebAssembly (WASM), a binary instruction format, designed as a portable target for compilation of high-level languages like C/C++/Rust. Its browser support is remarkable, and it has recently become viable as function calls between JavaScript and WASM are getting faster. Plus, it’s even supported on Fastly’s edge cloud.Of course, WebAssembly isn’t supposed to replace JavaScript, but it can complement it in cases when you notice CPU hogs. For most web apps, JavaScript is a better fit, and WebAssembly is best used for computationally intensive web apps, such as games.
If you’d like to learn more about WebAssembly:
- Lin Clark has written a thorough series to WebAssembly and Milica Mihajlija provides a general overview of how to run native code in the browser, why you might want to do that, and what it all means for JavaScript and the future of web development.
- How We Used WebAssembly To Speed Up Our Web App By 20X (Case Study) highlights a case study of how slow JavaScript calculations were replaced with compiled WebAssembly and brought significant performance improvements.
- Patrick Hamann has been speaking about the growing role of WebAssembly, and he’s debunking some myths about WebAssembly, explores its challenges and we can use it practically in applications today.
- Google Codelabs provides an Introduction to WebAssembly, a 60 min course in which you’ll learn how to take native code—in C and compile it to WebAssembly, and then call it directly from JavaScript.
- Alex Danilo has explained WebAssembly and how it works at his Google I/O talk. Also, Benedek Gagyi shared a practical case study on WebAssembly, specifically how the team uses it as output format for their C++ codebase to iOS, Android and the website.
Still not sure about when to use Web Workers, Web Assembly, streams, or perhaps WebGL JavaScript API to access the GPU? Accelerating JavaScript is a short but helpful guide that explains when to use what, and why — also with a handy flowchart and plenty of useful resources.


- Do we serve legacy code only to legacy browsers?
With ES2017 being remarkably well supported in modern browsers, we can usebabelEsmPluginto only transpile ES2017+ features unsupported by the modern browsers you are targeting.Houssein Djirdeh and Jason Miller have recently published a comprehensive guide on how to transpile and serve modern and legacy JavaScript, going into details of making it work with Webpack and Rollup, and the tooling needed. You can also estimate how much JavaScript you can shave off on your site or app bundles.
JavaScript modules are supported in all major browsers, so use use
script type="module"to let browsers with ES module support load the file, while older browsers could load legacy builds withscript nomodule.These days we can write module-based JavaScript that runs natively in the browser, without transpilers or bundlers. `` header provides a way to initiate early (and high-priority) loading of module scripts. Basically, it’s a nifty way to help in maximizing bandwidth usage, by telling the browser about what it needs to fetch so that it’s not stuck with anything to do during those long roundtrips. Also, Jake Archibald has published a detailed article with gotchas and things to keep in mind with ES Modules that’s worth reading.

- Identify and rewrite legacy code with incremental decoupling.
Long-living projects have a tendency to gather dust and dated code. Revisit your dependencies and assess how much time would be required to refactor or rewrite legacy code that has been causing trouble lately. Of course, it’s always a big undertaking, but once you know the impact of the legacy code, you could start with incremental decoupling.First, set up metrics that tracks if the ratio of legacy code calls is staying constant or going down, not up. Publicly discourage the team from using the library and make sure that your CI alerts developers if it’s used in pull requests. polyfills could help transition from legacy code to rewritten codebase that uses standard browser features.
- Identify and remove unused CSS/JS.
CSS and JavaScript code coverage in Chrome allows you to learn which code has been executed/applied and which hasn't. You can start recording the coverage, perform actions on a page, and then explore the code coverage results. Once you’ve detected unused code, find those modules and lazy load withimport()(see the entire thread). Then repeat the coverage profile and validate that it’s now shipping less code on initial load.You can use Puppeteer to programmatically collect code coverage. Chrome allows you to export code coverage results, too. As Andy Davies noted, you might want to collect code coverage for both modern and legacy browsers though.
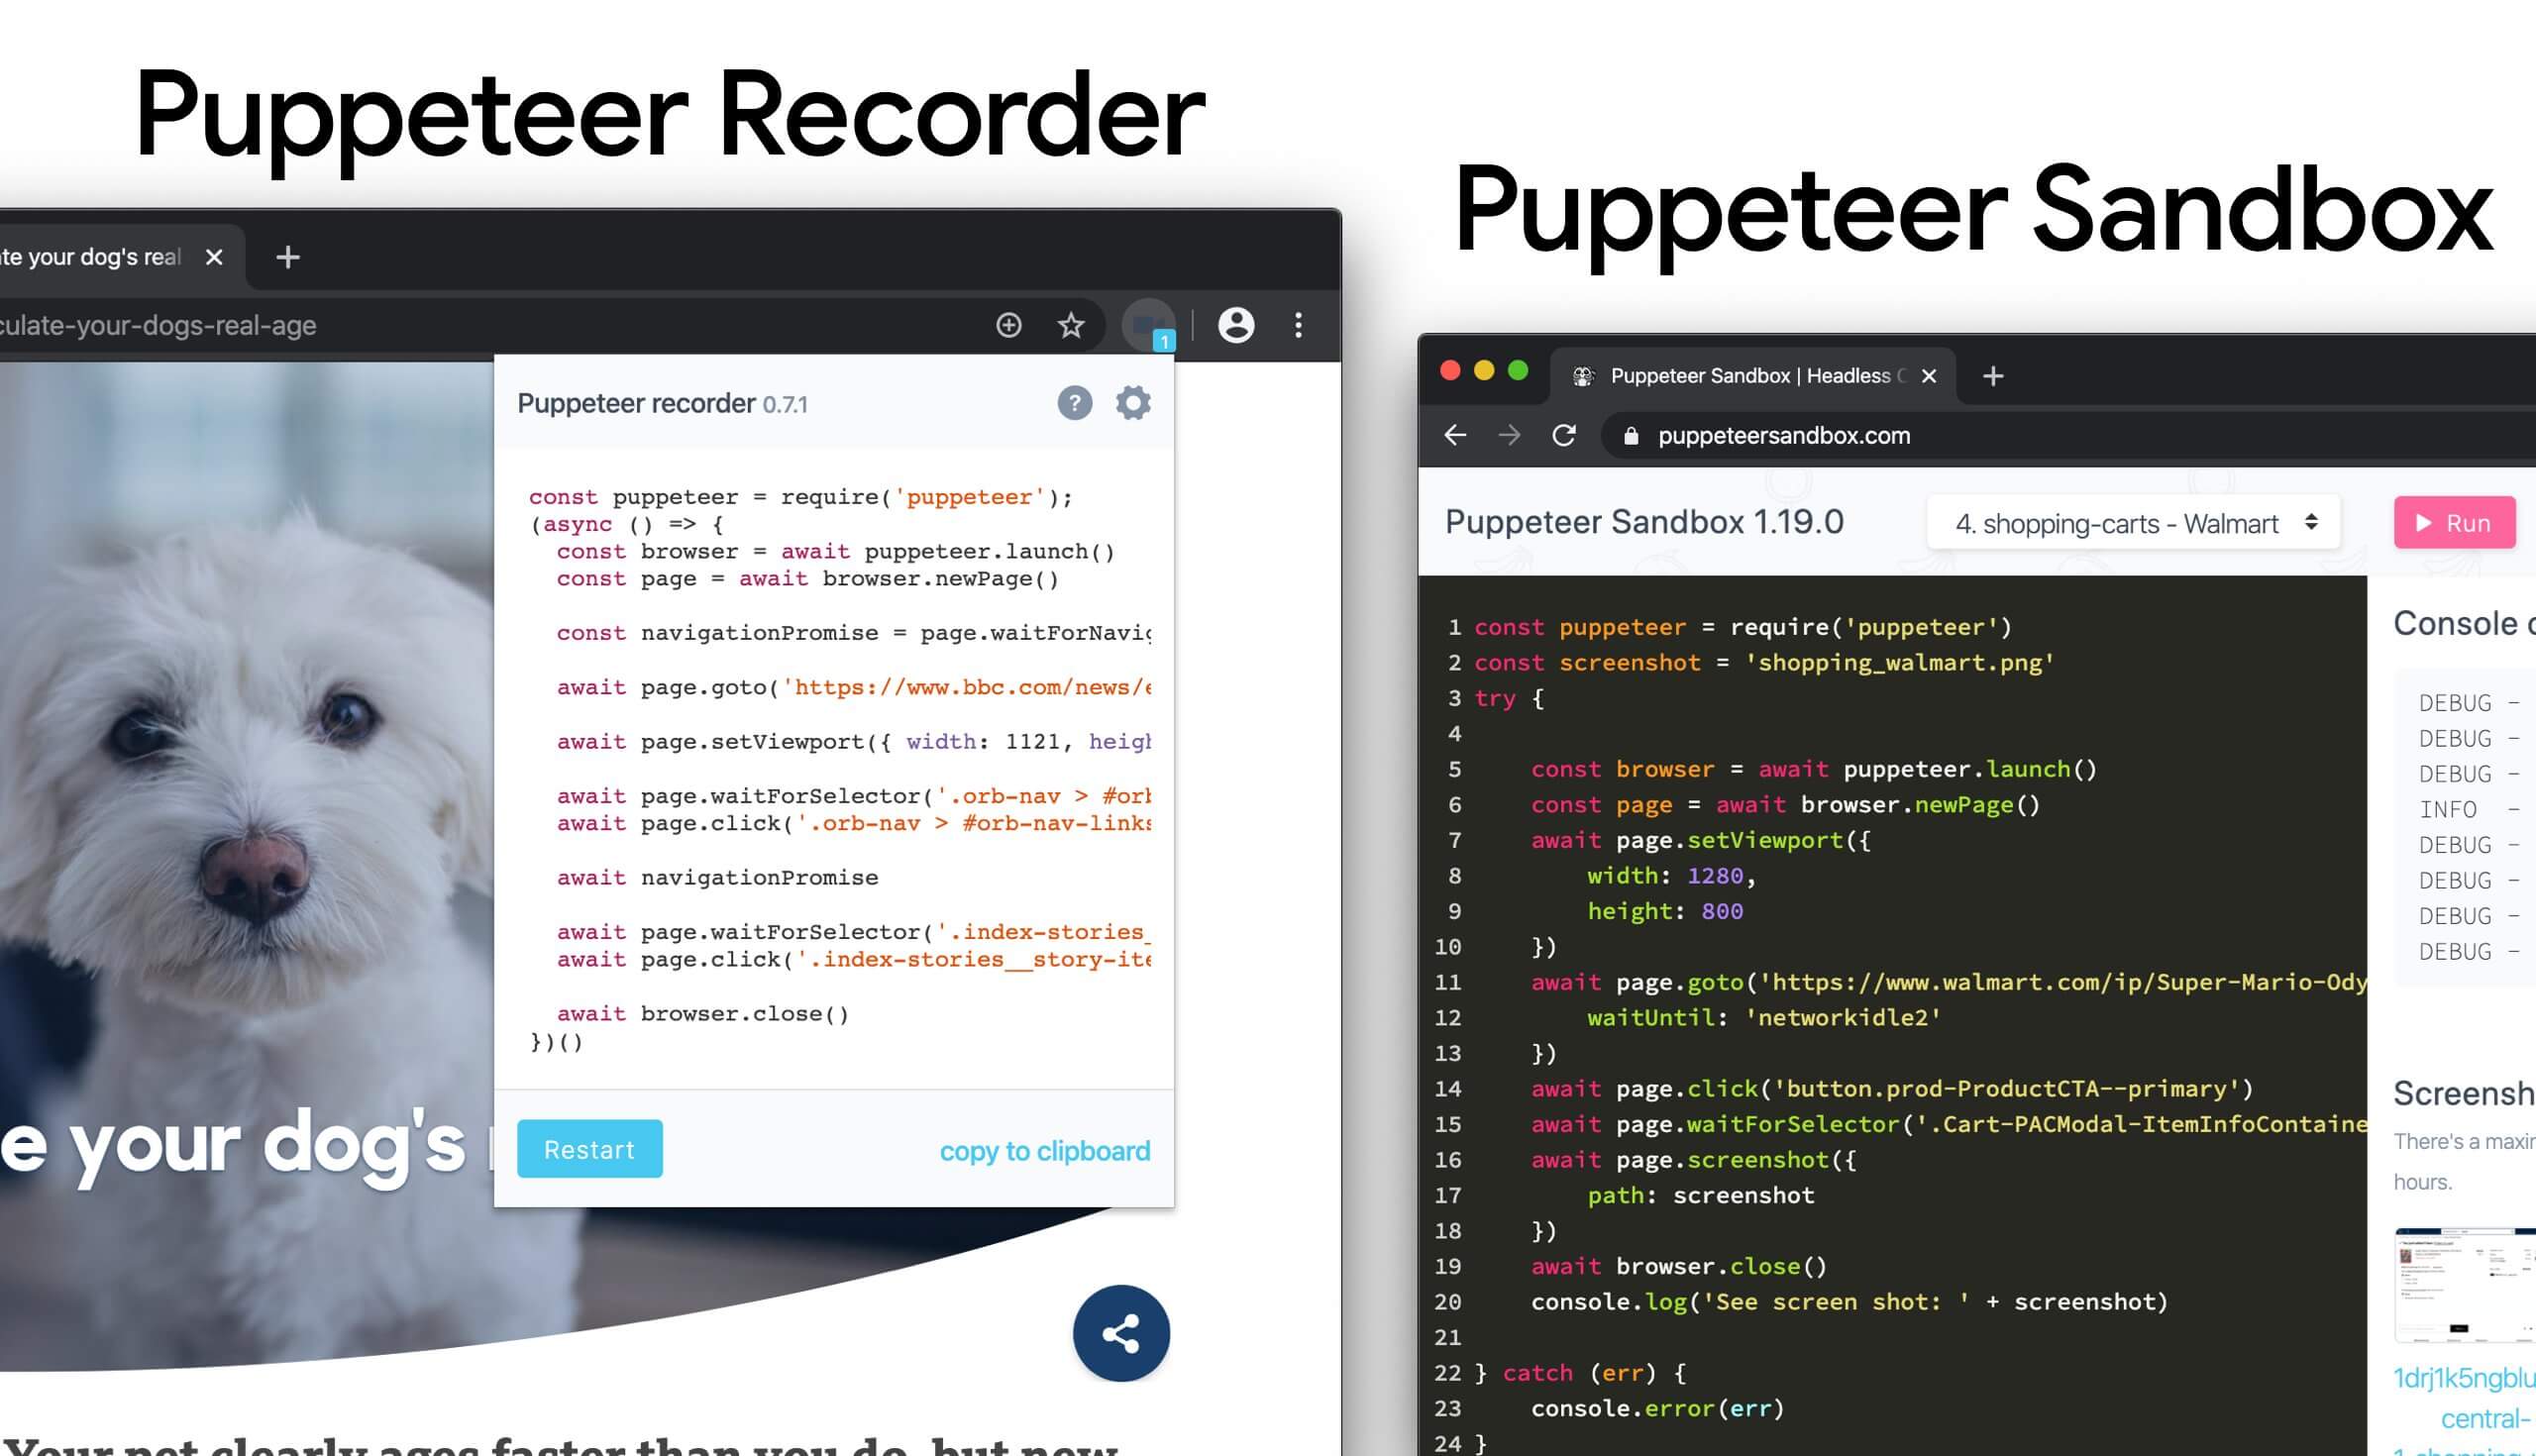
There are many other use-cases and tools for Puppetter that might need a bit more exposure:
- Use-cases for Puppeteer, such as, for example, automatic visual diffing or monitoring unused CSS with every build,
- Web performance recipes with Puppeteer,
- Useful tooling for recording and generating Pupeeteer and Playwright scripts,
- Plus, you can even record tests right in DevTools,
- Comprehensive overview of Puppeteer by Nitay Neeman, with examples and use cases.
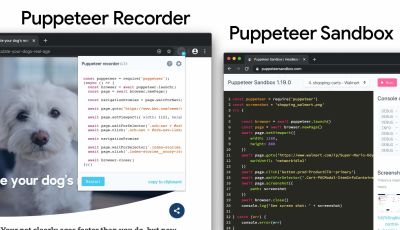
We can use Puppeteer Recorder and Puppeteer Sandbox to record browser interaction and generate Puppeteer and Playwright scripts. (Large preview) Furthermore, purgecss, UnCSS and Helium can help you remove unused styles from CSS. And if you aren’t certain if a suspicious piece of code is used somewhere, you can follow Harry Roberts' advice: create a 1×1px transparent GIF for a particular class and drop it into a
dead/directory, e.g./assets/img/dead/comments.gif.After that, you set that specific image as a background on the corresponding selector in your CSS, sit back and wait for a few months if the file is going to appear in your logs. If there are no entries, nobody had that legacy component rendered on their screen: you can probably go ahead and delete it all.
For the I-feel-adventurous-department, you could even automate gathering on unused CSS through a set of pages by monitoring DevTools using DevTools.

- Trim the size of your JavaScript bundles.
As Addy Osmani noted, there’s a high chance you’re shipping full JavaScript libraries when you only need a fraction, along with dated polyfills for browsers that don’t need them, or just duplicate code. To avoid the overhead, consider using webpack-libs-optimizations that removes unused methods and polyfills during the build process.Check and review the polyfills that you are sending to legacy browsers and to modern browsers, and be more strategic about them. Take a look at polyfill.io which is a service that accepts a request for a set of browser features and returns only the polyfills that are needed by the requesting browser.
Add bundle auditing into your regular workflow as well. There might be some lightweight alternatives to heavy libraries you’ve added years ago, e.g. Moment.js (now discontinued) could be replaced with:
- Native Internationalization API,
- Day.js with a familiar Moment.js API and patterns,
- date-fns or
- Luxon.
- You can also use Skypack Discover that combines human-reviewed package recommendations with a quality-focused search.
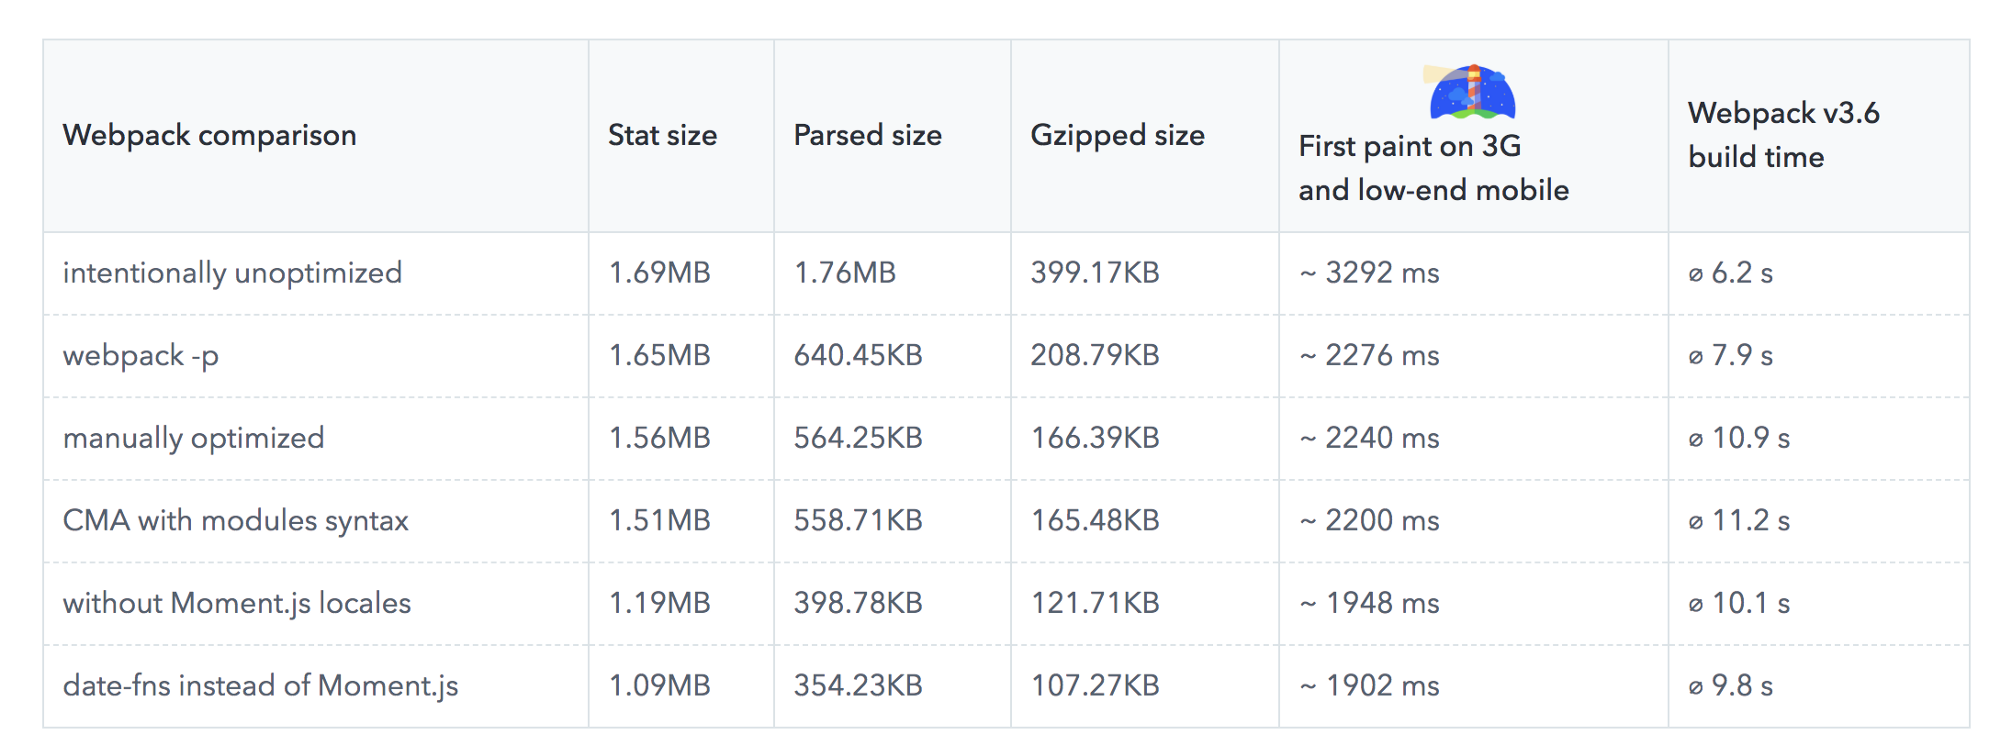
Benedikt Rötsch’s research showed that a switch from Moment.js to date-fns could shave around 300ms for First paint on 3G and a low-end mobile phone.
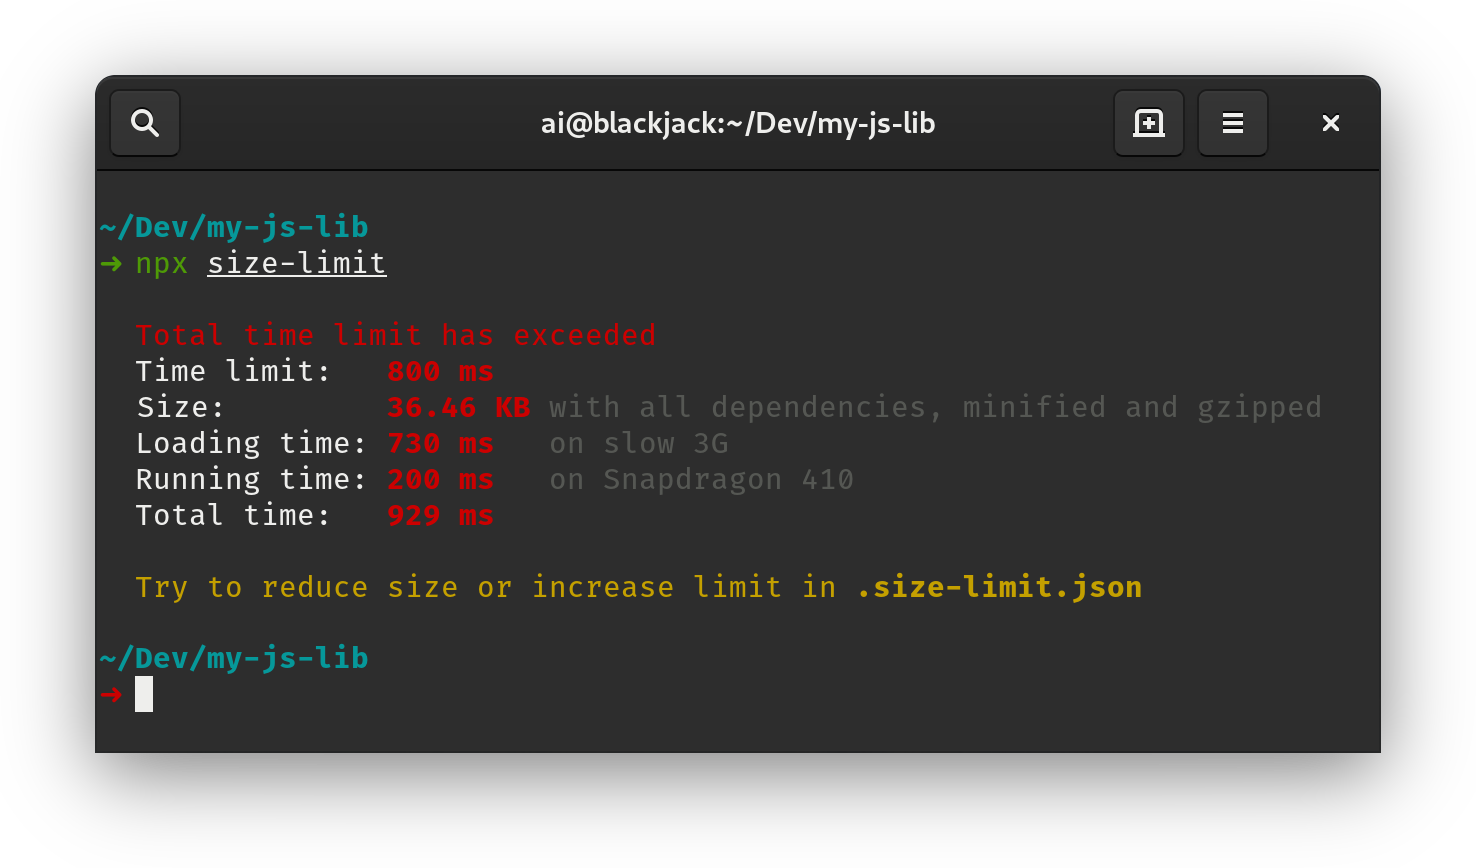
For bundle auditing, Bundlephobia could help find the cost of adding a npm package to your bundle. size-limit extends basic bundle size check with details on JavaScript execution time. You can even integrate these costs with a Lighthouse Custom Audit. This goes for frameworks, too. By removing or trimming the Vue MDC Adapter (Material Components for Vue), styles drop from 194KB to 10KB.
There are many further tools to help you make an informed decision about the impact of your dependencies and viable alternatives:
- webpack-bundle-analyzer
- Source Map Explorer
- Bundle Buddy
- Bundlephobia
- Webpack analyze shows why a specific module is included into the bundle.
- bundle-wizard also builds a map of dependencies for the whole page.
- Webpack size-plugin
- Import Cost for Visual Code
Alternatively to shipping the entire framework, you could trim your framework and compile it into a raw JavaScript bundle that does not require additional code. Svelte does it, and so does Rawact Babel plugin which transpiles React.js components to native DOM operations at build-time. Why? Well, as maintainers explain, "react-dom includes code for every possible component/HTMLElement that can be rendered, including code for incremental rendering, scheduling, event handling, etc. But there are applications that do not need all these features (at initial page load). For such applications, it might make sense to use native DOM operations to build the interactive user interface."
- Do we use partial hydration?
With the amount of JavaScript used in applications, we need to figure out ways to send as little as possible to the client. One way of doing so — and we briefly covered it already — is with partial hydration. The idea is quite simple: instead of doing SSR and then sending the entire app to the client, only small pieces of the app's JavaScript would be sent to the client and then hydrated. We can think of it as multiple tiny React apps with multiple render roots on an otherwise static website.In the article "The case of partial hydration (with Next and Preact)", Lukas Bombach explains how the team behind Welt.de, one of the news outlets in Germany, has achieved better performance with partial hydration. You can also check next-super-performance GitHub repo with explanations and code snippets.
You could also consider alternative options:
- partial hydration with Preact and Eleventy,
- progressive hydration in React GitHub repo,
- lazy-hydration in Vue.js (GitHub repo),
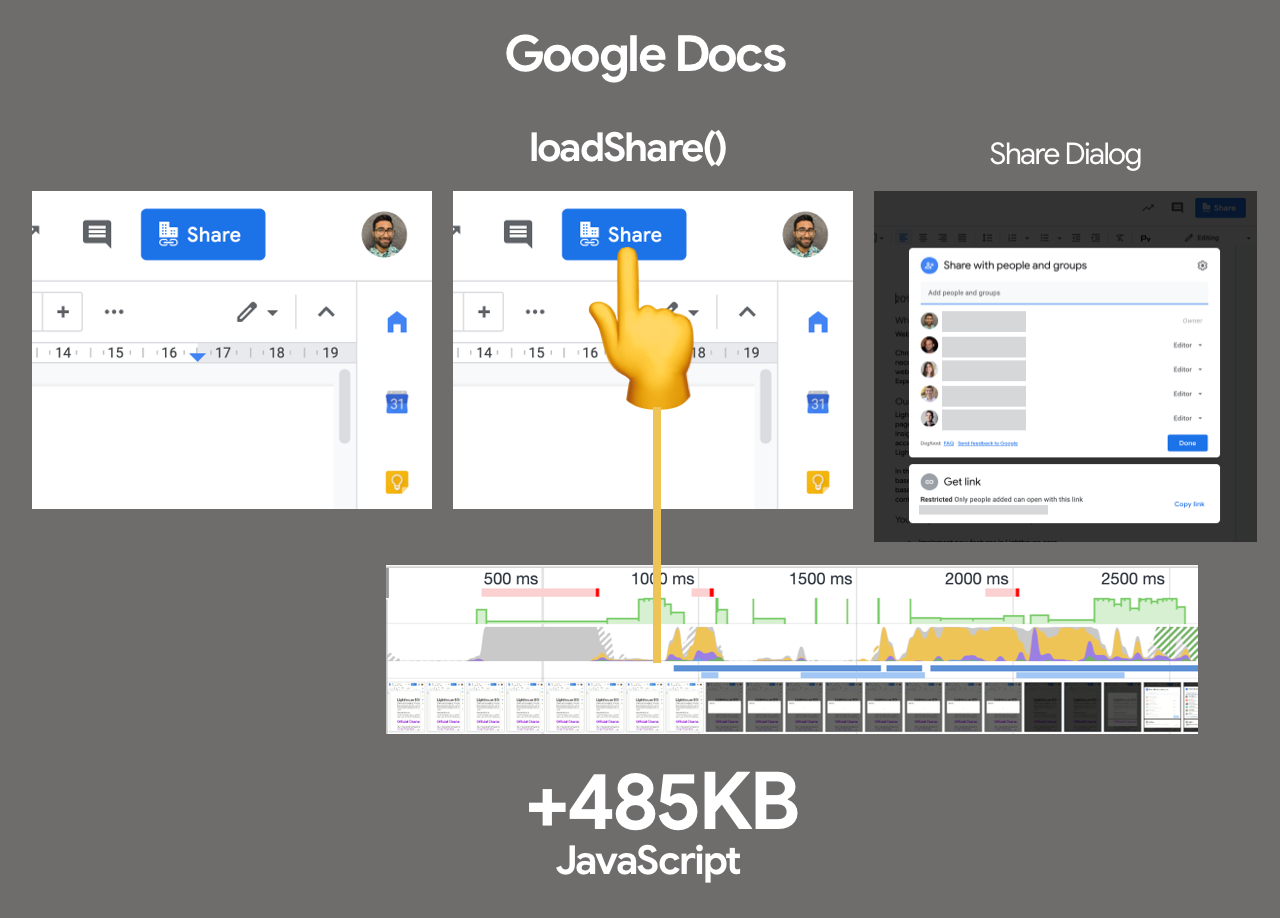
- Import on Interaction Pattern to lazy-load non-critical resources (e.g components, embeds) when a user interacts with UI that needs it.
Jason Miller has published working demos on how progressive hydration could be implemented with React, so you can use them right away: demo 1, demo 2, demo 3 (also available on GitHub). Plus, you can look into the react-prerendered-component library.

Import-on-interaction for first-party code should only be done if you’re unable to prefetch resources prior to interaction. (Large preview) - Have we optimized the strategy for React/SPA?
Struggling with performance in your single-page-application application? Jeremy Wagner has explored the impact of client-side framework performance on a variety of devices, highlighting some of the implications and guidelines we might want to be aware of when using one.As a result, here's a SPA strategy that Jeremy suggests to use for React framework (but it shouldn't change significantly for other frameworks):
- Refactor stateful components as stateless components whenever possible.
- Prerender stateless components when possible to minimize server response time. Render only on the server.
- For stateful components with simple interactivity, consider prerendering or server-rendering that component, and replace its interactivity with framework-independent event listeners.
- If you must hydrate stateful components on the client, use lazy hydration on visibility or interaction.
- For lazily-hydrated components, schedule their hydration during main thread idle time with
requestIdleCallback.
There are a few other strategies you might want to pursue or review:
- Performance considerations for CSS-in-JS in React apps
- Reduce Next.js Bundle Size by loading polyfills only when necessary, using dynamic imports and lazy hydration.
- Secrets of JavaScript: A tale of React, Performance Optimization and Multi-threading, a lengthy 7-part series on improving user interface challenges with React,
- How to measure React performance and How to profile React applications.
- Building mobile-first web animations in React, a fantastic talk by Alex Holachek, along with slides and GitHub repo (thanks for the tip, Addy!).
- webpack-libs-optimizations is a fantastic GitHub repo with plenty of useful Webpack-specific performance-related optimizations. Maintained by Ivan Akulov.
- React performance improvements in Notion, a guide by Ivan Akulov on how to improve performance in React, with plenty of useful pointers to make the app around 30% faster.
- React Refresh Webpack Plugin (experimental) allows for hot reloading that preserves component state, and supports hooks and function components.
- Watch out for zero-bundle-size React Server Components, a new proposed kind of components that will have no impact on bundle size. The project is currently in development, but any feedback from the community is much appreciated (great explainer by Sophie Alpert).
- Are you using predictive prefetching for JavaScript chunks?
We could use heuristics to decide when to preload JavaScript chunks. Guess.js is a set of tools and libraries that use Google Analytics data to determine which page a user is most likely to visit next from a given page. Based on user navigation patterns collected from Google Analytics or other sources, Guess.js builds a machine-learning model to predict and prefetch JavaScript that will be required on each subsequent page.Hence, every interactive element is receiving a probability score for engagement, and based on that score, a client-side script decides to prefetch a resource ahead of time. You can integrate the technique to your Next.js application, Angular and React, and there is a Webpack plugin which automates the setup process as well.
Obviously, you might be prompting the browser to consume unneeded data and prefetch undesirable pages, so it’s a good idea to be quite conservative in the number of prefetched requests. A good use case would be prefetching validation scripts required in the checkout, or speculative prefetch when a critical call-to-action comes into the viewport.
Need something less sophisticated? DNStradamus does DNS prefetching for outbound links as they appear in the viewport. Quicklink, InstantClick and Instant.page are small libraries that automatically prefetch links in the viewport during idle time in attempt to make next-page navigations load faster. Quicklink allows to prefetch React Router routes and Javascript; plus it’s data-considerate, so it doesn’t prefetch on 2G or if
Data-Saveris on. So is Instant.page if the mode is set to use viewport prefetching (which is a default).If you want to look into the science of predictive prefetching in full detail, Divya Tagtachian has a great talk on The Art of Predictive Prefetch, covering all the options from start to finish.
- Take advantage of optimizations for your target JavaScript engine.
Study what JavaScript engines dominate in your user base, then explore ways of optimizing for them. For example, when optimizing for V8 which is used in Blink-browsers, Node.js runtime and Electron, make use of script streaming for monolithic scripts.Script streaming allows
asyncordefer scriptsto be parsed on a separate background thread once downloading begins, hence in some cases improving page loading times by up to 10%. Practically, use `